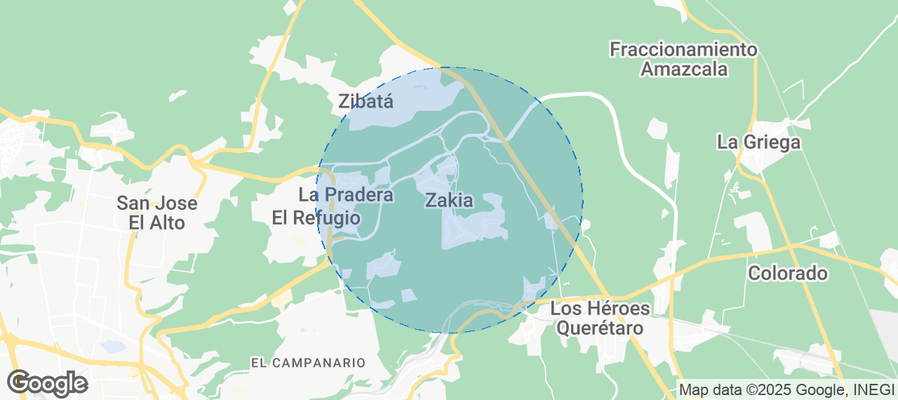
Zakia Airbnb Market Analysis 2026: Short Term Rental Data & Vacation Rental Statistics in Querétaro, Mexico
Is Airbnb profitable in Zakia in 2026? Explore comprehensive Airbnb analytics for Zakia, Querétaro, Mexico to uncover income potential. This 2026 STR market report for Zakia, based on AirROI data from February 2025 to January 2026, reveals key trends in the niche market of 23 active listings.
Whether you're considering an Airbnb investment in Zakia, optimizing your existing vacation rental, or exploring rental arbitrage opportunities, understanding the Zakia Airbnb data is crucial. Leveraging the low regulation environment is key to maximizing your short term rental income potential. Let's dive into the specifics.
Key Zakia Airbnb Performance Metrics Overview
Monthly Airbnb Revenue Variations & Income Potential in Zakia (2026)
Understanding the monthly revenue variations for Airbnb listings in Zakia is key to maximizing your short term rental income potential. Seasonality significantly impacts earnings. Our analysis, based on data from the past 12 months, shows that the peak revenue month for STRs in Zakia is typically December, while May often presents the lowest earnings, highlighting opportunities for strategic pricing adjustments during shoulder and low seasons. Explore the typical Airbnb income in Zakia across different performance tiers:
- Best-in-class properties (Top 10%) achieve $1,526+ monthly, often utilizing dynamic pricing and superior guest experiences.
- Strong performing properties (Top 25%) earn $995 or more, indicating effective management and desirable locations/amenities.
- Typical properties (Median) generate around $589 per month, representing the average market performance.
- Entry-level properties (Bottom 25%) see earnings around $299, often with potential for optimization.
Average Monthly Airbnb Earnings Trend in Zakia
Zakia Airbnb Occupancy Rate Trends (2026)
Maximize your bookings by understanding the Zakia STR occupancy trends. Seasonal demand shifts significantly influence how often properties are booked. Typically, Februarysees the highest demand (peak season occupancy), while November experiences the lowest (low season). Effective strategies, like adjusting minimum stays or offering promotions, can boost occupancy during slower periods. Here's how different property tiers perform in Zakia:
- Best-in-class properties (Top 10%) achieve 80%+ occupancy, indicating high desirability and potentially optimized availability.
- Strong performing properties (Top 25%) maintain 60% or higher occupancy, suggesting good market fit and guest satisfaction.
- Typical properties (Median) have an occupancy rate around 33%.
- Entry-level properties (Bottom 25%) average 20% occupancy, potentially facing higher vacancy.
Average Monthly Occupancy Rate Trend in Zakia
Average Daily Rate (ADR) Airbnb Trends in Zakia (2026)
Effective short term rental pricing strategy in Zakia involves understanding monthly ADR fluctuations. The Average Daily Rate (ADR) for Airbnb in Zakia typically peaks in December and dips lowest during March. Leveraging Airbnb dynamic pricing tools or strategies based on this seasonality can significantly boost revenue. Here's a look at the typical nightly rates achieved:
- Best-in-class properties (Top 10%) command rates of $87+ per night, often due to premium features or locations.
- Strong performing properties (Top 25%) achieve nightly rates of $73 or more.
- Typical properties (Median) charge around $59 per night.
- Entry-level properties (Bottom 25%) earn around $47 per night.
Average Daily Rate (ADR) Trend by Month in Zakia
Get Live Zakia Market Intelligence 👇
Explore Real-time Analytics
Airbnb Seasonality Analysis & Trends in Zakia (2026)
Peak Season (December, October, August)
- Revenue averages $879 per month
- Occupancy rates average 41.3%
- Daily rates average $66
Shoulder Season
- Revenue averages $679 per month
- Occupancy maintains around 40.1%
- Daily rates hold near $60
Low Season (April, May, July)
- Revenue drops to average $577 per month
- Occupancy decreases to average 38.3%
- Daily rates adjust to average $54
Seasonality Insights for Zakia
- The Airbnb seasonality in Zakia shows moderate seasonality with distinct peak and low periods. While the sections above show seasonal averages, it's also insightful to look at the extremes:
- During the high season, the absolute peak month showcases Zakia's highest earning potential, with monthly revenues capable of climbing to $1,014, occupancy reaching a high of 50.0%, and ADRs peaking at $73.
- Conversely, the slowest single month of the year, typically falling within the low season, marks the market's lowest point. In this month, revenue might dip to $533, occupancy could drop to 32.0%, and ADRs may adjust down to $51.
- Understanding both the seasonal averages and these monthly peaks and troughs in revenue, occupancy, and ADR is crucial for maximizing your Airbnb profit potential in Zakia.
Seasonal Strategies for Maximizing Profit
- Peak Season: Maximize revenue through premium pricing and potentially longer minimum stays. Ensure high availability.
- Low Season: Offer competitive pricing, special promotions (e.g., extended stay discounts), and flexible cancellation policies. Target off-season travelers like remote workers or budget-conscious guests.
- Shoulder Seasons: Implement dynamic pricing that balances peak and low rates. Target weekend travelers or specific events. Offer slightly more flexible terms than peak season.
- Regularly analyze your own performance against these Zakia seasonality benchmarks and adjust your pricing and availability strategy accordingly.
Best Areas for Airbnb Investment in Zakia (2026)
Exploring the top neighborhoods for short-term rentals in Zakia? This section highlights key areas, outlining why they are attractive for hosts and guests, along with notable local attractions. Consider these locations based on your target guest profile and investment strategy.
| Neighborhood / Area | Why Host Here? (Target Guests & Appeal) | Key Attractions & Landmarks |
|---|---|---|
| Centro Historico | The historic downtown area of Querétaro, filled with colonial architecture, vibrant culture, and rich history. It attracts tourists interested in history and local cuisine, making it a prime location for short-term rentals. | Querétaro Aqueduct, Templo de San Francisco, Palacio de la Corregidora, Plaza de Armas, Museo de Arte, Teatro de la República |
| Juriquilla | Juriquilla is a modern suburban area that's popular with families and expatriates. Known for its upscale neighborhoods, it offers a quieter lifestyle while being close to cultural attractions and amenities. | Antea Lifestyle Center, Juriquilla Park, Queretaro 2000, Community events, Art galleries |
| El Pueblito | A charming neighborhood that retains a traditional Mexican vibe. It's close to the historic center and offers beautiful parks and local markets, making it attractive for both tourists and locals. | Pueblo de El Pueblito, Local artisan shops, Los Arcos park, Festivals |
| Santa Rosa | A quaint area known for its local markets and vibrant community life. It’s a favorite among tourists who want to experience authentic Mexican culture. | Santa Rosa Park, Local eateries, Cultural events, Festivals |
| Lomas de Querétaro | An upscale residential area that appeals to business travelers and families. It has good access to commercial areas and recreational activities, making it a popular choice for longer stays. | Lomas Plaza, Shopping centers, Cafes and restaurants, Spas |
| Querétaro Altavista | A neighborhood with a mix of modern amenities and traditional architecture. It offers easy access to the city center and is popular among younger professionals and students. | Cerro de las Campanas, Museo Regional de Querétaro, Restaurants and cafes, Cultural venues |
| Pie de la Cuesta | Known for its proximity to nature and outdoor activities, this area attracts tourists looking for adventure and relaxation just outside of the city. | Hiking trails, Nature reserves, Picnic areas, Weekend markets |
| Los Arcos | Situated near one of Querétaro's most famous landmarks, this area is vibrant and lively, perfect for tourists who want to explore charming local shops and eateries. | Los Arcos de Querétaro, Local artisan markets, Cultural festivals, Art showcases |
Understanding Airbnb License Requirements & STR Laws in Zakia (2026)
While Zakia, Querétaro, Mexico currently shows low STR regulations, specific Airbnb license requirements might still exist or change. Always verify the latest short term rental regulations and Airbnb license requirements directly with local government authorities for Zakia to ensure full compliance before hosting.
(Source: AirROI data, 2026, finding no licensed listings among those analyzed)
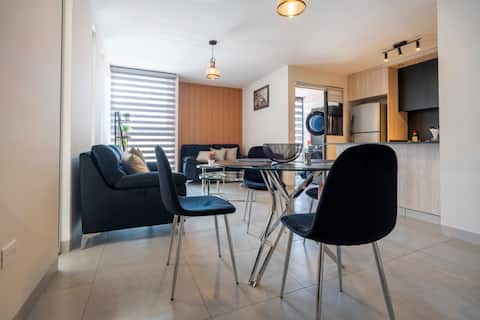
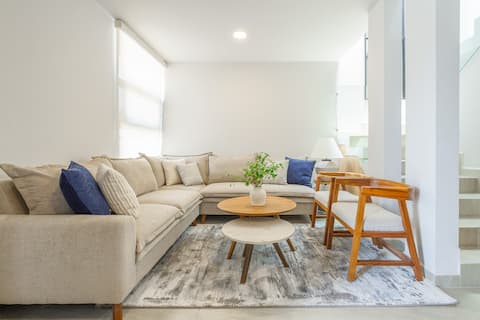
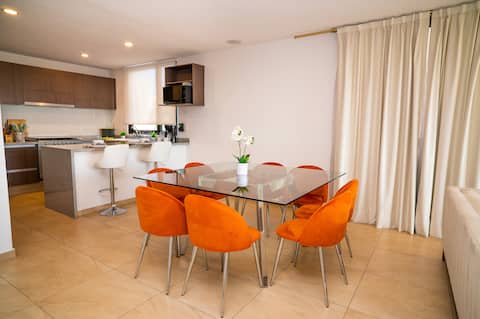
Top Performing Airbnb Properties in Zakia (2026)
Benchmark your potential! Explore examples of top-performing Airbnb properties in Zakiabased on Trailing Twelve Month (TTM) revenue. Analyze their characteristics, revenue, occupancy rate, and ADR to understand what drives success in this market.
Lagos Apartment in Zakia Ziré
Entire Place • 2 bedrooms
Casa Berilo by Cosmos Homes
Entire Place • 3 bedrooms
Sunset Duplex Getaway
Entire Place • 2 bedrooms

Beautiful apartment in Ziré (Zakia) GRIVA ll
Entire Place • 2 bedrooms
House in Zakia Vitala, Epic. Heated pool
Entire Place • 3 bedrooms
House in Zakia for 6 people
Entire Place • 3 bedrooms
Note: Performance varies based on location, size, amenities, seasonality, and management quality. Data reflects the past 12 months.
Top Performing Airbnb Hosts in Zakia (2026)
Learn from the best! This table showcases top-performing Airbnb hosts in Zakia based on the number of properties managed and estimated total revenue over the past year. Analyze their scale and performance metrics.
| Host Name | Properties | Grossing Revenue | Stay Reviews | Avg Rating |
|---|---|---|---|---|
| Enrique | 1 | $17,135 | 14 | 4.86/5.0 |
| Carlos | 1 | $16,158 | 125 | 4.98/5.0 |
| Yeseeiri | 1 | $12,736 | 31 | 5.00/5.0 |
| Iván | 1 | $10,761 | 53 | 4.91/5.0 |
| Carlos | 1 | $10,328 | 30 | 4.80/5.0 |
| Ivonne | 1 | $10,131 | 53 | 4.40/5.0 |
| Hospedia | 4 | $8,311 | 30 | 4.62/5.0 |
| Ricardo | 1 | $7,989 | 29 | 4.97/5.0 |
| Cristina | 1 | $6,114 | 33 | 4.79/5.0 |
| Karen Alvarez | 2 | $5,553 | 7 | 4.83/5.0 |
Analyzing the strategies of top hosts, such as their property selection, pricing, and guest communication, can offer valuable lessons for optimizing your own Airbnb operations in Zakia.
Dive Deeper: Advanced Zakia STR Market Data (2026)
Ready to unlock more insights? AirROI provides access to advanced metrics and comprehensive Airbnb data for Zakia. Explore detailed analytics beyond this report to refine your investment strategy, optimize pricing, and maximize your vacation rental profits.
Explore Advanced MetricsZakia Short-Term Rental Market Composition (2026): Property & Room Types
Room Type Distribution
Property Type Distribution
Market Composition Insights for Zakia
- The Zakia Airbnb market composition is heavily skewed towards Entire Home/Apt listings, which make up 87% of the 23 active rentals. This indicates strong guest preference for privacy and space.
- Looking at the property type distribution in Zakia, Apartment/Condo properties are the most common (52.2%), reflecting the local real estate landscape.
- Houses represent a significant 47.8% portion, catering likely to families or larger groups.
Zakia Airbnb Room Capacity Analysis (2026): Bedroom Distribution
Distribution of Listings by Number of Bedrooms
Room Capacity Insights for Zakia
- The dominant room capacity in Zakia is 3 bedrooms listings, making up 52.2% of the market. This suggests a strong demand for properties suitable for families or small groups.
- Together, 3 bedrooms and 2 bedrooms properties represent 91.3% of the active Airbnb listings in Zakia, indicating a high concentration in these sizes.
- A significant 52.2% of listings offer 3+ bedrooms, catering to larger groups and families seeking more space in Zakia.
Zakia Vacation Rental Guest Capacity Trends (2026)
Distribution of Listings by Guest Capacity
Guest Capacity Insights for Zakia
- The most common guest capacity trend in Zakia vacation rentals is listings accommodating 6 guests (30.4%). This suggests the primary traveler segment is likely larger groups.
- Properties designed for 6 guests and 7 guests dominate the Zakia STR market, accounting for 52.1% of listings.
- 56.4% of properties accommodate 6+ guests, serving the market segment for larger families or group travel in Zakia.
- On average, properties in Zakia are equipped to host 5.2 guests.
Zakia Airbnb Booking Patterns (2026): Available vs. Booked Days
Available Days Distribution
Booked Days Distribution
Booking Pattern Insights for Zakia
- The most common availability pattern in Zakia falls within the 271-366 days range, representing 56.5% of listings. This suggests many properties have significant open periods on their calendars.
- Approximately 82.6% of listings show high availability (181+ days open annually), indicating potential for increased bookings or specific owner usage patterns.
- For booked days, the 31-90 days range is most frequent in Zakia (34.8%), reflecting common guest stay durations or potential owner blocking patterns.
- A notable 21.7% of properties secure long booking periods (181+ days booked per year), highlighting successful long-term rental strategies or significant owner usage.
Zakia Airbnb Minimum Stay Requirements Analysis
Distribution of Listings by Minimum Night Requirement
1 Night
11 listings
47.8% of total
2 Nights
3 listings
13% of total
3 Nights
1 listings
4.3% of total
30+ Nights
8 listings
34.8% of total
Key Insights
- The most prevalent minimum stay requirement in Zakia is 1 Night, adopted by 47.8% of listings. This highlights the market's preference for shorter, flexible bookings.
- A strong majority (60.8%) of the Zakia Airbnb data shows acceptance of very short stays (1-2 nights), indicating a dynamic, high-turnover market.
- A significant segment (34.8%) caters to monthly stays (30+ nights) in Zakia, pointing to opportunities in the extended-stay market.
Recommendations
- Align with the market by considering a 1 Night minimum stay, as 47.8% of Zakia hosts use this setting.
- Explore offering discounts for stays of 30+ nights to attract the 34.8% of the market seeking extended stays.
- Adjust minimum nights based on seasonality – potentially shorter during low season and longer during peak demand periods in Zakia.
Zakia Airbnb Cancellation Policy Trends Analysis (2026)
Flexible
11 listings
47.8% of total
Moderate
3 listings
13% of total
Firm
6 listings
26.1% of total
Strict
3 listings
13% of total
Cancellation Policy Insights for Zakia
- The prevailing Airbnb cancellation policy trend in Zakia is Flexible, used by 47.8% of listings.
- There's a relatively balanced mix between guest-friendly (60.8%) and stricter (39.1%) policies, offering choices for different guest needs.
Recommendations for Hosts
- Consider adopting a Flexible policy to align with the 47.8% market standard in Zakia.
- Using a Strict policy might deter some guests, as only 13% of listings use it. Evaluate if potential revenue protection outweighs possible lower booking rates.
- Regularly review your cancellation policy against competitors and market demand shifts in Zakia.
Zakia STR Booking Lead Time Analysis (2026)
Average Booking Lead Time by Month
Booking Lead Time Insights for Zakia
- The overall average booking lead time for vacation rentals in Zakia is 11 days.
- Guests book furthest in advance for stays during December (average 18 days), likely coinciding with peak travel demand or local events.
- The shortest booking windows occur for stays in February (average 7 days), indicating more last-minute travel plans during this time.
- Seasonally, Winter (12 days avg.) sees the longest lead times, while Spring (11 days avg.) has the shortest, reflecting typical travel planning cycles.
Recommendations for Hosts
- Use the overall average lead time (11 days) as a baseline for your pricing and availability strategy in Zakia.
- Target marketing efforts for the Winter season well in advance (at least 12 days) to capture early planners.
- Monitor your own booking lead times against these Zakia averages to identify opportunities for dynamic pricing adjustments.
Popular & Essential Airbnb Amenities in Zakia (2026)
Amenity Prevalence
Amenity Insights for Zakia
- Essential amenities in Zakia that guests expect include: Wifi, Free parking on premises, TV, Clothing storage, Kitchen, Hot water. Lacking these (any) could significantly impact bookings.
- Popular amenities like Stove, Refrigerator, Dishes and silverware are common but not universal. Offering these can provide a competitive edge.
Recommendations for Hosts
- Ensure your listing includes all essential amenities for Zakia: Wifi, Free parking on premises, TV, Clothing storage, Kitchen, Hot water.
- Prioritize adding missing essentials: Clothing storage, Kitchen, Hot water.
- Consider adding popular differentiators like Stove or Refrigerator to increase appeal.
- Highlight unique or less common amenities you offer (e.g., hot tub, dedicated workspace, EV charger) in your listing description and photos.
- Regularly check competitor amenities in Zakia to stay competitive.
Zakia Airbnb Guest Demographics & Profile Analysis (2026)
Guest Profile Summary for Zakia
- The typical guest profile for Airbnb in Zakia consists of primarily domestic travelers (88%), often arriving from nearby Mexico City, typically belonging to the Post-2000s (Gen Z/Alpha) group (50%), primarily speaking Spanish or English.
- Domestic travelers account for 88.1% of guests.
- Key international markets include Mexico (88.1%) and United States (5.1%).
- Top languages spoken are Spanish (49.3%) followed by English (41.3%).
- A significant demographic segment is the Post-2000s (Gen Z/Alpha) group, representing 50% of guests.
Recommendations for Hosts
- Target domestic marketing efforts towards travelers from Mexico City and Santiago de Querétaro.
- Tailor amenities and listing descriptions to appeal to the dominant Post-2000s (Gen Z/Alpha) demographic (e.g., highlight fast WiFi, smart home features, local guides).
- Highlight unique local experiences or amenities relevant to the primary guest profile.
- Consider seasonal promotions aligned with peak travel times for key origin markets.
Nearby Short-Term Rental Market Comparison
How does the Zakia Airbnb market stack up against its neighbors? Compare key performance metrics like average monthly revenue, ADR, and occupancy rates in surrounding areas to understand the broader regional STR landscape.
| Market | Active Properties | Monthly Revenue | Daily Rate | Avg. Occupancy |
|---|---|---|---|---|
| El Santuario | 44 | $2,583 | $420.27 | 25% |
| Cerro Gordo | 38 | $2,183 | $438.64 | 21% |
| Tepeji del Rio de Ocampo | 11 | $2,125 | $315.80 | 27% |
| Avandaro | 212 | $1,892 | $411.24 | 24% |
| La Tortuga | 71 | $1,658 | $239.12 | 28% |
| Alcocer | 11 | $1,642 | $271.32 | 21% |
| San Miguel de Allende | 2,169 | $1,470 | $194.10 | 32% |
| Ejido San Gaspar | 43 | $1,386 | $267.18 | 20% |
| Lomas de Comanjilla | 21 | $1,382 | $183.03 | 27% |
| Cuauhtémoc | 13 | $1,344 | $93.02 | 54% |