Calderitas Airbnb Market Analysis 2026: Short Term Rental Data & Vacation Rental Statistics in Quintana Roo, Mexico
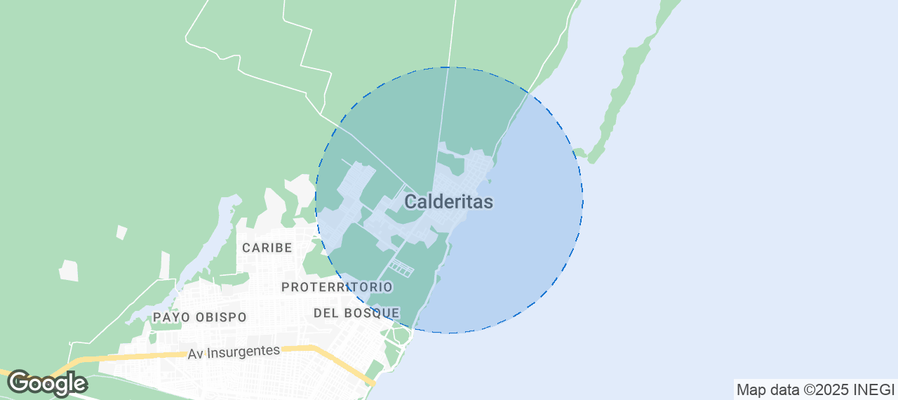
Is Airbnb profitable in Calderitas in 2026? Explore comprehensive Airbnb analytics for Calderitas, Quintana Roo, Mexico to uncover income potential. This 2026 STR market report for Calderitas, based on AirROI data from February 2025 to January 2026, reveals key trends in the niche market of 20 active listings.
Whether you're considering an Airbnb investment in Calderitas, optimizing your existing vacation rental, or exploring rental arbitrage opportunities, understanding the Calderitas Airbnb data is crucial. Leveraging the low regulation environment is key to maximizing your short term rental income potential. Let's dive into the specifics.
Key Calderitas Airbnb Performance Metrics Overview
Monthly Airbnb Revenue Variations & Income Potential in Calderitas (2026)
Understanding the monthly revenue variations for Airbnb listings in Calderitas is key to maximizing your short term rental income potential. Seasonality significantly impacts earnings. Our analysis, based on data from the past 12 months, shows that the peak revenue month for STRs in Calderitas is typically July, while January often presents the lowest earnings, highlighting opportunities for strategic pricing adjustments during shoulder and low seasons. Explore the typical Airbnb income in Calderitas across different performance tiers:
- Best-in-class properties (Top 10%) achieve $3,741+ monthly, often utilizing dynamic pricing and superior guest experiences.
- Strong performing properties (Top 25%) earn $1,626 or more, indicating effective management and desirable locations/amenities.
- Typical properties (Median) generate around $474 per month, representing the average market performance.
- Entry-level properties (Bottom 25%) see earnings around $292, often with potential for optimization.
Average Monthly Airbnb Earnings Trend in Calderitas
Calderitas Airbnb Occupancy Rate Trends (2026)
Maximize your bookings by understanding the Calderitas STR occupancy trends. Seasonal demand shifts significantly influence how often properties are booked. Typically, Aprilsees the highest demand (peak season occupancy), while January experiences the lowest (low season). Effective strategies, like adjusting minimum stays or offering promotions, can boost occupancy during slower periods. Here's how different property tiers perform in Calderitas:
- Best-in-class properties (Top 10%) achieve 55%+ occupancy, indicating high desirability and potentially optimized availability.
- Strong performing properties (Top 25%) maintain 38% or higher occupancy, suggesting good market fit and guest satisfaction.
- Typical properties (Median) have an occupancy rate around 25%.
- Entry-level properties (Bottom 25%) average 13% occupancy, potentially facing higher vacancy.
Average Monthly Occupancy Rate Trend in Calderitas
Average Daily Rate (ADR) Airbnb Trends in Calderitas (2026)
Effective short term rental pricing strategy in Calderitas involves understanding monthly ADR fluctuations. The Average Daily Rate (ADR) for Airbnb in Calderitas typically peaks in December and dips lowest during August. Leveraging Airbnb dynamic pricing tools or strategies based on this seasonality can significantly boost revenue. Here's a look at the typical nightly rates achieved:
- Best-in-class properties (Top 10%) command rates of $680+ per night, often due to premium features or locations.
- Strong performing properties (Top 25%) achieve nightly rates of $202 or more.
- Typical properties (Median) charge around $62 per night.
- Entry-level properties (Bottom 25%) earn around $43 per night.
Average Daily Rate (ADR) Trend by Month in Calderitas
Get Live Calderitas Market Intelligence 👇
Explore Real-time Analytics
Airbnb Seasonality Analysis & Trends in Calderitas (2026)
Peak Season (July, March, June)
- Revenue averages $1,878 per month
- Occupancy rates average 32.0%
- Daily rates average $223
Shoulder Season
- Revenue averages $1,264 per month
- Occupancy maintains around 32.1%
- Daily rates hold near $229
Low Season (January, September, October)
- Revenue drops to average $750 per month
- Occupancy decreases to average 17.7%
- Daily rates adjust to average $227
Seasonality Insights for Calderitas
- The Airbnb seasonality in Calderitas shows highly seasonal trends requiring careful strategy. While the sections above show seasonal averages, it's also insightful to look at the extremes:
- During the high season, the absolute peak month showcases Calderitas's highest earning potential, with monthly revenues capable of climbing to $2,084, occupancy reaching a high of 36.3%, and ADRs peaking at $253.
- Conversely, the slowest single month of the year, typically falling within the low season, marks the market's lowest point. In this month, revenue might dip to $691, occupancy could drop to 15.3%, and ADRs may adjust down to $210.
- Understanding both the seasonal averages and these monthly peaks and troughs in revenue, occupancy, and ADR is crucial for maximizing your Airbnb profit potential in Calderitas.
Seasonal Strategies for Maximizing Profit
- Peak Season: Maximize revenue through premium pricing and potentially longer minimum stays. Ensure high availability.
- Low Season: Offer competitive pricing, special promotions (e.g., extended stay discounts), and flexible cancellation policies. Target off-season travelers like remote workers or budget-conscious guests.
- Shoulder Seasons: Implement dynamic pricing that balances peak and low rates. Target weekend travelers or specific events. Offer slightly more flexible terms than peak season.
- Regularly analyze your own performance against these Calderitas seasonality benchmarks and adjust your pricing and availability strategy accordingly.
Best Areas for Airbnb Investment in Calderitas (2026)
Exploring the top neighborhoods for short-term rentals in Calderitas? This section highlights key areas, outlining why they are attractive for hosts and guests, along with notable local attractions. Consider these locations based on your target guest profile and investment strategy.
| Neighborhood / Area | Why Host Here? (Target Guests & Appeal) | Key Attractions & Landmarks |
|---|---|---|
| Calderitas Beach | A serene beach area offering a tranquil escape with beautiful scenery. Ideal for guests looking for a relaxed environment close to nature and water activities. | Calderitas Beach, Snorkeling spots, Cenote Azul, Mangrove tours, Local seafood restaurants |
| Mayan Ruins | Proximity to ancient Mayan ruins attracts history enthusiasts and tourists eager to explore rich cultural heritage. This area provides a unique blend of relaxation and education. | Ruins of Kohunlich, Templo de las Inscripciones, Mayan museums, Guided archaeological tours |
| Cenote Tours | Close to several cenotes, this area is a prime location for eco-tourism. Visitors often seek refreshing swims and unique geological formations. | Cenote dos Ojos, Cenote Ik Kil, Cenote Xcanche, Guided cenote tours, Ecological parks |
| Local Markets | Vibrant local markets provide a taste of authentic Mexican culture and cuisine, appealing to travelers interested in local experiences and culinary delights. | Mercado 23, Calderitas food market, Local craft vendors, Cultural festivals, Street food tours |
| Eco-Tourism Spots | With emphasis on eco-friendly tourism, this area attracts conscious travelers who value sustainability and nature preservation. | Eco-parks, Biosphere reserves, Wildlife observation tours, Sustainable lodges, Nature trails |
| Charming Downtown | The historic downtown of Calderitas offers a glimpse into local life, making it appealing for tourists wanting to experience the true heart of the community. | Local cafes, Cultural events, Artisans' shops, Community gatherings |
| Adventure Activities | This area is famous for adventure sports, drawing in thrill-seekers looking for activities like zip-lining, kayaking, and ATV tours. | Zip-line parks, ATV rentals, Kayak tours, Scuba diving spots |
| Cultural Festivals | Known for its vibrant cultural scene, Calderitas hosts various festivals throughout the year, making it a lively spot for tourists. | Fiestas de Calderitas, Cultural parades, Local music events, Craft fairs |
Understanding Airbnb License Requirements & STR Laws in Calderitas (2026)
While Calderitas, Quintana Roo, Mexico currently shows low STR regulations, specific Airbnb license requirements might still exist or change. Always verify the latest short term rental regulations and Airbnb license requirements directly with local government authorities for Calderitas to ensure full compliance before hosting.
(Source: AirROI data, 2026, finding no licensed listings among those analyzed)
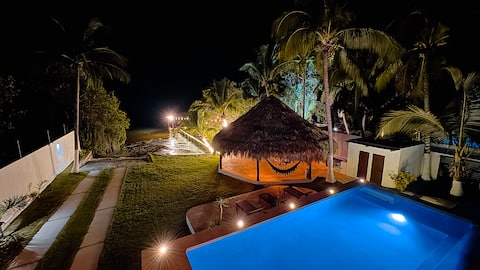
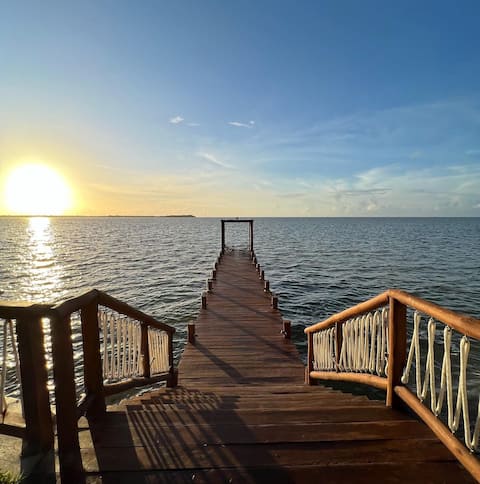
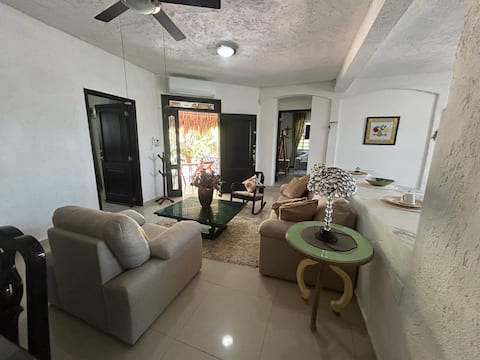
Top Performing Airbnb Properties in Calderitas (2026)
Benchmark your potential! Explore examples of top-performing Airbnb properties in Calderitasbased on Trailing Twelve Month (TTM) revenue. Analyze their characteristics, revenue, occupancy rate, and ADR to understand what drives success in this market.
Casa Xchel facing the Bay
Entire Place • 3 bedrooms
NEW House Boho Chic Ocean View
Entire Place • 2 bedrooms

Casa Xchel right on the beach, swimming pool, jacuzzi and deck
Entire Place • 3 bedrooms

Villa Muyal | 7BR | Waterfront Getaway
Entire Place • 7 bedrooms
Casa Palmas (pool and jacuzzi)
Entire Place • 3 bedrooms
IK Casa del Viento (Full House)
Entire Place • 6 bedrooms
Note: Performance varies based on location, size, amenities, seasonality, and management quality. Data reflects the past 12 months.
Top Performing Airbnb Hosts in Calderitas (2026)
Learn from the best! This table showcases top-performing Airbnb hosts in Calderitas based on the number of properties managed and estimated total revenue over the past year. Analyze their scale and performance metrics.
| Host Name | Properties | Grossing Revenue | Stay Reviews | Avg Rating |
|---|---|---|---|---|
| Mayra | 1 | $49,702 | 4 | 5.00/5.0 |
| Casa Aakal | 1 | $26,287 | 9 | 4.67/5.0 |
| Maria | 1 | $26,013 | 11 | 5.00/5.0 |
| Solmarrentals.Com | 1 | $23,479 | 27 | 4.74/5.0 |
| Michelle | 1 | $20,657 | 31 | 4.65/5.0 |
| Eduardo | 1 | $17,943 | 1 | Not Rated |
| Karla | 3 | $15,333 | 196 | 4.78/5.0 |
| Marco | 5 | $15,135 | 326 | 4.88/5.0 |
| William | 1 | $7,395 | 42 | 4.81/5.0 |
| Amanda | 1 | $4,073 | 10 | 5.00/5.0 |
Analyzing the strategies of top hosts, such as their property selection, pricing, and guest communication, can offer valuable lessons for optimizing your own Airbnb operations in Calderitas.
Dive Deeper: Advanced Calderitas STR Market Data (2026)
Ready to unlock more insights? AirROI provides access to advanced metrics and comprehensive Airbnb data for Calderitas. Explore detailed analytics beyond this report to refine your investment strategy, optimize pricing, and maximize your vacation rental profits.
Explore Advanced MetricsCalderitas Short-Term Rental Market Composition (2026): Property & Room Types
Room Type Distribution
Property Type Distribution
Market Composition Insights for Calderitas
- The Calderitas Airbnb market composition is heavily skewed towards Entire Home/Apt listings, which make up 65% of the 20 active rentals. This indicates strong guest preference for privacy and space.
- However, a notable 35% share for Private Rooms suggests opportunities for budget-conscious travelers or hosts renting out spare rooms.
- Looking at the property type distribution in Calderitas, House properties are the most common (40%), reflecting the local real estate landscape.
- Houses represent a significant 40% portion, catering likely to families or larger groups.
- The presence of 30% Hotel/Boutique listings indicates integration with traditional hospitality.
Calderitas Airbnb Room Capacity Analysis (2026): Bedroom Distribution
Distribution of Listings by Number of Bedrooms
Room Capacity Insights for Calderitas
- The dominant room capacity in Calderitas is 1 bedroom listings, making up 45% of the market. This suggests a strong demand for properties suitable for couples or solo travelers.
- Together, 1 bedroom and 2 bedrooms properties represent 65.0% of the active Airbnb listings in Calderitas, indicating a high concentration in these sizes.
- A significant 25.0% of listings offer 3+ bedrooms, catering to larger groups and families seeking more space in Calderitas.
Calderitas Vacation Rental Guest Capacity Trends (2026)
Distribution of Listings by Guest Capacity
Guest Capacity Insights for Calderitas
- The most common guest capacity trend in Calderitas vacation rentals is listings accommodating 8+ guests (30%). This suggests the primary traveler segment is likely larger groups.
- Properties designed for 8+ guests and 2 guests dominate the Calderitas STR market, accounting for 60.0% of listings.
- 30.0% of properties accommodate 6+ guests, serving the market segment for larger families or group travel in Calderitas.
- On average, properties in Calderitas are equipped to host 4.3 guests.
Calderitas Airbnb Booking Patterns (2026): Available vs. Booked Days
Available Days Distribution
Booked Days Distribution
Booking Pattern Insights for Calderitas
- The most common availability pattern in Calderitas falls within the 271-366 days range, representing 80% of listings. This suggests many properties have significant open periods on their calendars.
- Approximately 95.0% of listings show high availability (181+ days open annually), indicating potential for increased bookings or specific owner usage patterns.
- For booked days, the 31-90 days range is most frequent in Calderitas (40%), reflecting common guest stay durations or potential owner blocking patterns.
- A notable 5.0% of properties secure long booking periods (181+ days booked per year), highlighting successful long-term rental strategies or significant owner usage.
Calderitas Airbnb Minimum Stay Requirements Analysis
Distribution of Listings by Minimum Night Requirement
1 Night
13 listings
65% of total
2 Nights
2 listings
10% of total
7-29 Nights
1 listings
5% of total
30+ Nights
4 listings
20% of total
Key Insights
- The most prevalent minimum stay requirement in Calderitas is 1 Night, adopted by 65% of listings. This highlights the market's preference for shorter, flexible bookings.
- A strong majority (75.0%) of the Calderitas Airbnb data shows acceptance of very short stays (1-2 nights), indicating a dynamic, high-turnover market.
- A significant segment (20%) caters to monthly stays (30+ nights) in Calderitas, pointing to opportunities in the extended-stay market.
Recommendations
- Align with the market by considering a 1 Night minimum stay, as 65% of Calderitas hosts use this setting.
- Explore offering discounts for stays of 30+ nights to attract the 20% of the market seeking extended stays.
- Adjust minimum nights based on seasonality – potentially shorter during low season and longer during peak demand periods in Calderitas.
Calderitas Airbnb Cancellation Policy Trends Analysis (2026)
Flexible
5 listings
25% of total
Moderate
9 listings
45% of total
Firm
5 listings
25% of total
Strict
1 listings
5% of total
Cancellation Policy Insights for Calderitas
- The prevailing Airbnb cancellation policy trend in Calderitas is Moderate, used by 45% of listings.
- There's a relatively balanced mix between guest-friendly (70.0%) and stricter (30.0%) policies, offering choices for different guest needs.
- Strict cancellation policies are quite rare (5%), potentially making listings with this policy less competitive unless justified by high demand or property type.
Recommendations for Hosts
- Consider adopting a Moderate policy to align with the 45% market standard in Calderitas.
- Using a Strict policy might deter some guests, as only 5% of listings use it. Evaluate if potential revenue protection outweighs possible lower booking rates.
- Regularly review your cancellation policy against competitors and market demand shifts in Calderitas.
Calderitas STR Booking Lead Time Analysis (2026)
Average Booking Lead Time by Month
Booking Lead Time Insights for Calderitas
- The overall average booking lead time for vacation rentals in Calderitas is 31 days.
- Guests book furthest in advance for stays during October (average 56 days), likely coinciding with peak travel demand or local events.
- The shortest booking windows occur for stays in March (average 16 days), indicating more last-minute travel plans during this time.
- Seasonally, Winter (40 days avg.) sees the longest lead times, while Spring (25 days avg.) has the shortest, reflecting typical travel planning cycles.
Recommendations for Hosts
- Use the overall average lead time (31 days) as a baseline for your pricing and availability strategy in Calderitas.
- For October stays, consider implementing length-of-stay discounts or slightly higher rates for bookings made less than 56 days out to capitalize on advance planning.
- Target marketing efforts for the Winter season well in advance (at least 40 days) to capture early planners.
- Monitor your own booking lead times against these Calderitas averages to identify opportunities for dynamic pricing adjustments.
Popular & Essential Airbnb Amenities in Calderitas (2026)
Amenity Prevalence
Amenity Insights for Calderitas
- Essential amenities in Calderitas that guests expect include: Pool, Air conditioning, Free parking on premises, Wifi, TV, Clothing storage. Lacking these (any) could significantly impact bookings.
- Popular amenities like Hot water, Outdoor dining area, Hangers are common but not universal. Offering these can provide a competitive edge.
Recommendations for Hosts
- Ensure your listing includes all essential amenities for Calderitas: Pool, Air conditioning, Free parking on premises, Wifi, TV, Clothing storage.
- Prioritize adding missing essentials: TV, Clothing storage.
- Consider adding popular differentiators like Hot water or Outdoor dining area to increase appeal.
- Highlight unique or less common amenities you offer (e.g., hot tub, dedicated workspace, EV charger) in your listing description and photos.
- Regularly check competitor amenities in Calderitas to stay competitive.
Calderitas Airbnb Guest Demographics & Profile Analysis (2026)
Guest Profile Summary for Calderitas
- The typical guest profile for Airbnb in Calderitas consists of primarily domestic travelers (68%), often arriving from nearby Mexico City, typically belonging to the Post-2000s (Gen Z/Alpha) group (50%), primarily speaking Spanish or English.
- Domestic travelers account for 67.5% of guests.
- Key international markets include Mexico (67.5%) and United States (15.8%).
- Top languages spoken are Spanish (45.2%) followed by English (37.5%).
- A significant demographic segment is the Post-2000s (Gen Z/Alpha) group, representing 50% of guests.
Recommendations for Hosts
- Target domestic marketing efforts towards travelers from Mexico City and Cancún.
- Tailor amenities and listing descriptions to appeal to the dominant Post-2000s (Gen Z/Alpha) demographic (e.g., highlight fast WiFi, smart home features, local guides).
- Highlight unique local experiences or amenities relevant to the primary guest profile.
- Consider seasonal promotions aligned with peak travel times for key origin markets.
Nearby Short-Term Rental Market Comparison
How does the Calderitas Airbnb market stack up against its neighbors? Compare key performance metrics like average monthly revenue, ADR, and occupancy rates in surrounding areas to understand the broader regional STR landscape.
| Market | Active Properties | Monthly Revenue | Daily Rate | Avg. Occupancy |
|---|---|---|---|---|
| Kate Subdivision | 13 | $2,924 | $346.23 | 37% |
| San Pedro Town | 667 | $2,922 | $324.04 | 37% |
| San Pedro | 44 | $2,911 | $402.68 | 33% |
| San Pedro | 94 | $2,209 | $282.54 | 36% |
| Caye Caulker Village | 356 | $1,975 | $173.01 | 42% |
| San Ignacio & Santa Elena | 156 | $1,379 | $134.66 | 38% |
| Buenavista | 33 | $1,203 | $261.52 | 24% |
| Bacalar | 804 | $1,157 | $138.03 | 34% |
| San Ignacio | 19 | $1,084 | $212.81 | 24% |
| San José | 23 | $983 | $172.04 | 24% |