Holbox Airbnb Market Analysis 2026: Short Term Rental Data & Vacation Rental Statistics in Quintana Roo, Mexico
Is Airbnb profitable in Holbox in 2026? Explore comprehensive Airbnb analytics for Holbox, Quintana Roo, Mexico to uncover income potential. This 2026 STR market report for Holbox, based on AirROI data from February 2025 to January 2026, reveals key trends in the market of 617 active listings.
Whether you're considering an Airbnb investment in Holbox, optimizing your existing vacation rental, or exploring rental arbitrage opportunities, understanding the Holbox Airbnb data is crucial. Leveraging the low regulation environment is key to maximizing your short term rental income potential. Let's dive into the specifics.
Key Holbox Airbnb Performance Metrics Overview
Monthly Airbnb Revenue Variations & Income Potential in Holbox (2026)
Understanding the monthly revenue variations for Airbnb listings in Holbox is key to maximizing your short term rental income potential. Seasonality significantly impacts earnings. Our analysis, based on data from the past 12 months, shows that the peak revenue month for STRs in Holbox is typically March, while September often presents the lowest earnings, highlighting opportunities for strategic pricing adjustments during shoulder and low seasons. Explore the typical Airbnb income in Holbox across different performance tiers:
- Best-in-class properties (Top 10%) achieve $4,643+ monthly, often utilizing dynamic pricing and superior guest experiences.
- Strong performing properties (Top 25%) earn $1,948 or more, indicating effective management and desirable locations/amenities.
- Typical properties (Median) generate around $892 per month, representing the average market performance.
- Entry-level properties (Bottom 25%) see earnings around $375, often with potential for optimization.
Average Monthly Airbnb Earnings Trend in Holbox
Holbox Airbnb Occupancy Rate Trends (2026)
Maximize your bookings by understanding the Holbox STR occupancy trends. Seasonal demand shifts significantly influence how often properties are booked. Typically, Marchsees the highest demand (peak season occupancy), while September experiences the lowest (low season). Effective strategies, like adjusting minimum stays or offering promotions, can boost occupancy during slower periods. Here's how different property tiers perform in Holbox:
- Best-in-class properties (Top 10%) achieve 69%+ occupancy, indicating high desirability and potentially optimized availability.
- Strong performing properties (Top 25%) maintain 50% or higher occupancy, suggesting good market fit and guest satisfaction.
- Typical properties (Median) have an occupancy rate around 29%.
- Entry-level properties (Bottom 25%) average 15% occupancy, potentially facing higher vacancy.
Average Monthly Occupancy Rate Trend in Holbox
Average Daily Rate (ADR) Airbnb Trends in Holbox (2026)
Effective short term rental pricing strategy in Holbox involves understanding monthly ADR fluctuations. The Average Daily Rate (ADR) for Airbnb in Holbox typically peaks in January and dips lowest during May. Leveraging Airbnb dynamic pricing tools or strategies based on this seasonality can significantly boost revenue. Here's a look at the typical nightly rates achieved:
- Best-in-class properties (Top 10%) command rates of $322+ per night, often due to premium features or locations.
- Strong performing properties (Top 25%) achieve nightly rates of $161 or more.
- Typical properties (Median) charge around $96 per night.
- Entry-level properties (Bottom 25%) earn around $62 per night.
Average Daily Rate (ADR) Trend by Month in Holbox
Get Live Holbox Market Intelligence 👇

Explore Real-time Analytics
Airbnb Seasonality Analysis & Trends in Holbox (2026)
Peak Season (March, February, April)
- Revenue averages $2,492 per month
- Occupancy rates average 44.9%
- Daily rates average $159
Shoulder Season
- Revenue averages $1,961 per month
- Occupancy maintains around 32.9%
- Daily rates hold near $161
Low Season (January, September, October)
- Revenue drops to average $1,450 per month
- Occupancy decreases to average 25.9%
- Daily rates adjust to average $167
Seasonality Insights for Holbox
- The Airbnb seasonality in Holbox shows highly seasonal trends requiring careful strategy. While the sections above show seasonal averages, it's also insightful to look at the extremes:
- During the high season, the absolute peak month showcases Holbox's highest earning potential, with monthly revenues capable of climbing to $2,883, occupancy reaching a high of 46.9%, and ADRs peaking at $203.
- Conversely, the slowest single month of the year, typically falling within the low season, marks the market's lowest point. In this month, revenue might dip to $1,321, occupancy could drop to 25.5%, and ADRs may adjust down to $149.
- Understanding both the seasonal averages and these monthly peaks and troughs in revenue, occupancy, and ADR is crucial for maximizing your Airbnb profit potential in Holbox.
Seasonal Strategies for Maximizing Profit
- Peak Season: Maximize revenue through premium pricing and potentially longer minimum stays. Ensure high availability.
- Low Season: Offer competitive pricing, special promotions (e.g., extended stay discounts), and flexible cancellation policies. Target off-season travelers like remote workers or budget-conscious guests.
- Shoulder Seasons: Implement dynamic pricing that balances peak and low rates. Target weekend travelers or specific events. Offer slightly more flexible terms than peak season.
- Regularly analyze your own performance against these Holbox seasonality benchmarks and adjust your pricing and availability strategy accordingly.
Best Areas for Airbnb Investment in Holbox (2026)
Exploring the top neighborhoods for short-term rentals in Holbox? This section highlights key areas, outlining why they are attractive for hosts and guests, along with notable local attractions. Consider these locations based on your target guest profile and investment strategy.
| Neighborhood / Area | Why Host Here? (Target Guests & Appeal) | Key Attractions & Landmarks |
|---|---|---|
| Punta Coco | A secluded beach area offering tranquility and stunning sunsets. Ideal for guests looking for a peaceful retreat amidst natural beauty. | Punta Coco Beach, Birdwatching spots, Beautiful mangroves, Local seafood shacks |
| Punta mosquito | A popular beach destination known for its white sands and crystal clear waters. Attracts visitors seeking vibrant beach experiences and water activities. | Punta Mosquito Beach, Kayaking, Snorkeling, Beach bars |
| Town Center | The heart of Holbox, filled with local shops, restaurants, and entertainment. Offers a unique cultural experience and easy access to amenities. | Plaza Principal, Local markets, Street food, Artisan shops |
| North Beach | Famous for its long stretch of white sand and shallow waters perfect for swimming. A family-friendly area that is great for beach activities. | North Beach, Water sports, Outdoor yoga, Sunbathing spots |
| Yalahau Lagoon | A natural lagoon known for its clear waters and wildlife. Popular for ecotourism and exploring the beautiful surrounding nature. | Yalahau Lagoon, Wildlife watching, Eco tours, Photography opportunities |
| Isla de la Pasión | A nearby small island known for its secluded beaches and tranquility. Offers an escape for romantic getaways and intimacy with nature. | Isla de la Pasión Beach, Private picnics, Snorkeling spots, Kayaking |
| Cenote Los Piratas | A unique cenote nearby Holbox where visitors can swim and explore unique geological formations. Attracts adventure seekers and nature lovers. | Cenote swimming, Nature walks, Picnic areas, Wildlife viewing |
| Mangle Claro | A serene mangrove area offering guided tours and the chance to see diverse flora and fauna. Great for eco-conscious travelers. | Mangrove tours, Kayaking, Birdwatching, Natural photography |
Understanding Airbnb License Requirements & STR Laws in Holbox (2026)
While Holbox, Quintana Roo, Mexico currently shows low STR regulations, specific Airbnb license requirements might still exist or change. Always verify the latest short term rental regulations and Airbnb license requirements directly with local government authorities for Holbox to ensure full compliance before hosting.
(Source: AirROI data, 2026, based on 1% licensed listings)
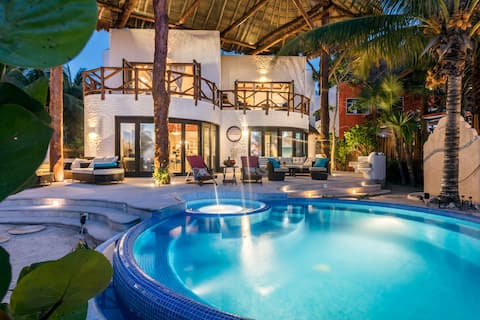
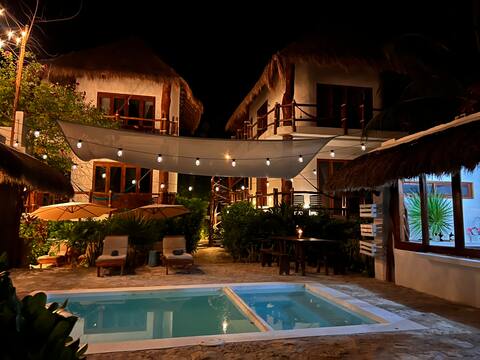
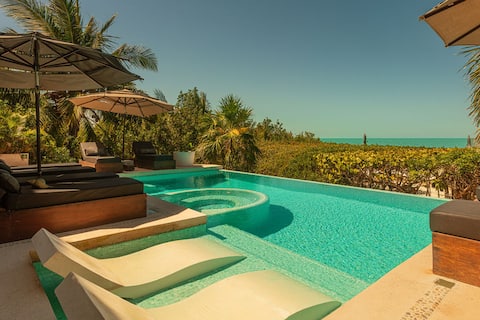
Top Performing Airbnb Properties in Holbox (2026)
Benchmark your potential! Explore examples of top-performing Airbnb properties in Holboxbased on Trailing Twelve Month (TTM) revenue. Analyze their characteristics, revenue, occupancy rate, and ADR to understand what drives success in this market.
Casa Mariposa - Amazing Beachfront House
Entire Place • 7 bedrooms
El Cielo - Cozy Villa Holbox -
Entire Place • 8 bedrooms
Punta Coco Luxury House Oceanfront + Infinity Pool
Entire Place • 5 bedrooms
Luxury Beachfront Villa in Holbox
Entire Place • 6 bedrooms

Impressive DK Ocean Front Villa
Entire Place • 3 bedrooms

Punta Coco Beach Villa
Entire Place • 4 bedrooms
Note: Performance varies based on location, size, amenities, seasonality, and management quality. Data reflects the past 12 months.
Top Performing Airbnb Hosts in Holbox (2026)
Learn from the best! This table showcases top-performing Airbnb hosts in Holbox based on the number of properties managed and estimated total revenue over the past year. Analyze their scale and performance metrics.
| Host Name | Properties | Grossing Revenue | Stay Reviews | Avg Rating |
|---|---|---|---|---|
| Holbox Deluxe Apartments | 13 | $522,863 | 1343 | 4.68/5.0 |
| Verónica | 6 | $382,157 | 459 | 4.88/5.0 |
| Gabriela | 4 | $333,489 | 249 | 4.94/5.0 |
| Awa | 9 | $326,213 | 104 | 4.82/5.0 |
| Hotel Boutique Casa Muuch | 7 | $321,604 | 203 | 4.76/5.0 |
| Matt | 1 | $295,792 | 69 | 4.80/5.0 |
| Mia | 7 | $279,222 | 22 | 5.00/5.0 |
| Malili | 1 | $233,937 | 68 | 4.94/5.0 |
| Casa Imox S De RL | 6 | $208,148 | 713 | 4.82/5.0 |
| Roberto | 1 | $203,635 | 9 | 4.67/5.0 |
Analyzing the strategies of top hosts, such as their property selection, pricing, and guest communication, can offer valuable lessons for optimizing your own Airbnb operations in Holbox.
Dive Deeper: Advanced Holbox STR Market Data (2026)
Ready to unlock more insights? AirROI provides access to advanced metrics and comprehensive Airbnb data for Holbox. Explore detailed analytics beyond this report to refine your investment strategy, optimize pricing, and maximize your vacation rental profits.
Explore Advanced MetricsHolbox Short-Term Rental Market Composition (2026): Property & Room Types
Room Type Distribution
Property Type Distribution
Market Composition Insights for Holbox
- The Holbox Airbnb market composition is heavily skewed towards Private Room listings, which make up 56.9% of the 617 active rentals. This indicates strong guest preference for privacy and space.
- Looking at the property type distribution in Holbox, Apartment/Condo properties are the most common (35.8%), reflecting the local real estate landscape.
- Houses represent a significant 20.1% portion, catering likely to families or larger groups.
- The presence of 34.4% Hotel/Boutique listings indicates integration with traditional hospitality.
- Smaller segments like unique stays, others (combined 1.7%) offer potential for unique stay experiences.
Holbox Airbnb Room Capacity Analysis (2026): Bedroom Distribution
Distribution of Listings by Number of Bedrooms
Room Capacity Insights for Holbox
- The dominant room capacity in Holbox is 1 bedroom listings, making up 64.8% of the market. This suggests a strong demand for properties suitable for couples or solo travelers.
- Together, 1 bedroom and 2 bedrooms properties represent 74.2% of the active Airbnb listings in Holbox, indicating a high concentration in these sizes.
- With over half the market (64.8%) consisting of studios or 1-bedroom units, Holbox is particularly well-suited for individuals or couples.
- Listings with 3+ bedrooms (9.5%) represent a smaller niche, potentially indicating an underserved market for larger group accommodations in Holbox.
Holbox Vacation Rental Guest Capacity Trends (2026)
Distribution of Listings by Guest Capacity
Guest Capacity Insights for Holbox
- The most common guest capacity trend in Holbox vacation rentals is listings accommodating 2 guests (38.9%). This suggests the primary traveler segment is likely couples or solo travelers.
- Properties designed for 2 guests and 4 guests dominate the Holbox STR market, accounting for 59.5% of listings.
- 14.7% of properties accommodate 6+ guests, serving the market segment for larger families or group travel in Holbox.
- On average, properties in Holbox are equipped to host 3.1 guests.
Holbox Airbnb Booking Patterns (2026): Available vs. Booked Days
Available Days Distribution
Booked Days Distribution
Booking Pattern Insights for Holbox
- The most common availability pattern in Holbox falls within the 271-366 days range, representing 63% of listings. This suggests many properties have significant open periods on their calendars.
- Approximately 90.2% of listings show high availability (181+ days open annually), indicating potential for increased bookings or specific owner usage patterns.
- For booked days, the 31-90 days range is most frequent in Holbox (33.1%), reflecting common guest stay durations or potential owner blocking patterns.
- A notable 10.3% of properties secure long booking periods (181+ days booked per year), highlighting successful long-term rental strategies or significant owner usage.
Holbox Airbnb Minimum Stay Requirements Analysis
Distribution of Listings by Minimum Night Requirement
1 Night
430 listings
69.7% of total
2 Nights
84 listings
13.6% of total
3 Nights
12 listings
1.9% of total
4-6 Nights
1 listings
0.2% of total
30+ Nights
90 listings
14.6% of total
Key Insights
- The most prevalent minimum stay requirement in Holbox is 1 Night, adopted by 69.7% of listings. This highlights the market's preference for shorter, flexible bookings.
- A strong majority (83.3%) of the Holbox Airbnb data shows acceptance of very short stays (1-2 nights), indicating a dynamic, high-turnover market.
- A significant segment (14.6%) caters to monthly stays (30+ nights) in Holbox, pointing to opportunities in the extended-stay market.
Recommendations
- Align with the market by considering a 1 Night minimum stay, as 69.7% of Holbox hosts use this setting.
- Explore offering discounts for stays of 30+ nights to attract the 14.6% of the market seeking extended stays.
- Adjust minimum nights based on seasonality – potentially shorter during low season and longer during peak demand periods in Holbox.
Holbox Airbnb Cancellation Policy Trends Analysis (2026)
Super Strict 60 Days
2 listings
0.3% of total
Limited
12 listings
2% of total
Super Strict 30 Days
13 listings
2.1% of total
Flexible
147 listings
24.1% of total
Moderate
181 listings
29.7% of total
Firm
188 listings
30.9% of total
Strict
66 listings
10.8% of total
Cancellation Policy Insights for Holbox
- The prevailing Airbnb cancellation policy trend in Holbox is Firm, used by 30.9% of listings.
- There's a relatively balanced mix between guest-friendly (53.8%) and stricter (41.7%) policies, offering choices for different guest needs.
Recommendations for Hosts
- Consider adopting a Firm policy to align with the 30.9% market standard in Holbox.
- Using a Strict policy might deter some guests, as only 10.8% of listings use it. Evaluate if potential revenue protection outweighs possible lower booking rates.
- Regularly review your cancellation policy against competitors and market demand shifts in Holbox.
Holbox STR Booking Lead Time Analysis (2026)
Average Booking Lead Time by Month
Booking Lead Time Insights for Holbox
- The overall average booking lead time for vacation rentals in Holbox is 48 days.
- Guests book furthest in advance for stays during December (average 68 days), likely coinciding with peak travel demand or local events.
- The shortest booking windows occur for stays in June (average 38 days), indicating more last-minute travel plans during this time.
- Seasonally, Winter (55 days avg.) sees the longest lead times, while Spring (42 days avg.) has the shortest, reflecting typical travel planning cycles.
Recommendations for Hosts
- Use the overall average lead time (48 days) as a baseline for your pricing and availability strategy in Holbox.
- For December stays, consider implementing length-of-stay discounts or slightly higher rates for bookings made less than 68 days out to capitalize on advance planning.
- Target marketing efforts for the Winter season well in advance (at least 55 days) to capture early planners.
- Monitor your own booking lead times against these Holbox averages to identify opportunities for dynamic pricing adjustments.
Popular & Essential Airbnb Amenities in Holbox (2026)
Amenity Prevalence
Amenity Insights for Holbox
- Essential amenities in Holbox that guests expect include: Wifi, Air conditioning. Lacking these (any) could significantly impact bookings.
- Popular amenities like Hot water, Essentials, Shampoo are common but not universal. Offering these can provide a competitive edge.
Recommendations for Hosts
- Ensure your listing includes all essential amenities for Holbox: Wifi, Air conditioning.
- Prioritize adding missing essentials: Wifi, Air conditioning.
- Consider adding popular differentiators like Hot water or Essentials to increase appeal.
- Highlight unique or less common amenities you offer (e.g., hot tub, dedicated workspace, EV charger) in your listing description and photos.
- Regularly check competitor amenities in Holbox to stay competitive.
Holbox Airbnb Guest Demographics & Profile Analysis (2026)
Guest Profile Summary for Holbox
- The typical guest profile for Airbnb in Holbox consists of predominantly international visitors (69%), with top international origins including United States, typically belonging to the Post-2000s (Gen Z/Alpha) group (50%), primarily speaking English or Spanish.
- Domestic travelers account for 30.6% of guests.
- Key international markets include Mexico (30.6%) and United States (22.3%).
- Top languages spoken are English (40.3%) followed by Spanish (30.3%).
- A significant demographic segment is the Post-2000s (Gen Z/Alpha) group, representing 50% of guests.
Recommendations for Hosts
- Focus marketing internationally, particularly towards travelers from United States.
- Tailor amenities and listing descriptions to appeal to the dominant Post-2000s (Gen Z/Alpha) demographic (e.g., highlight fast WiFi, smart home features, local guides).
- Highlight unique local experiences or amenities relevant to the primary guest profile.
- Consider seasonal promotions aligned with peak travel times for key origin markets.
Nearby Short-Term Rental Market Comparison
How does the Holbox Airbnb market stack up against its neighbors? Compare key performance metrics like average monthly revenue, ADR, and occupancy rates in surrounding areas to understand the broader regional STR landscape.
| Market | Active Properties | Monthly Revenue | Daily Rate | Avg. Occupancy |
|---|---|---|---|---|
| Punta Sam | 32 | $3,194 | $441.63 | 37% |
| Isla Mujeres | 898 | $2,309 | $237.30 | 39% |
| Quintana Roo | 85 | $1,678 | $238.66 | 34% |
| Puerto Aventuras | 399 | $1,631 | $278.65 | 32% |
| Tulum | 8,104 | $1,240 | $183.84 | 31% |
| San Miguel de Cozumel | 1,232 | $1,073 | $141.46 | 35% |
| Cancún | 5,959 | $1,046 | $117.71 | 39% |
| Playa del Carmen | 7,725 | $1,018 | $128.74 | 38% |
| Puerto Morelos | 873 | $965 | $143.05 | 35% |
| Akumal | 28 | $831 | $220.81 | 26% |