San Miguel de Cozumel Airbnb Market Analysis 2026: Short Term Rental Data & Vacation Rental Statistics in Quintana Roo, Mexico
Is Airbnb profitable in San Miguel de Cozumel in 2026? Explore comprehensive Airbnb analytics for San Miguel de Cozumel, Quintana Roo, Mexico to uncover income potential. This 2026 STR market report for San Miguel de Cozumel, based on AirROI data from February 2025 to January 2026, reveals key trends in the bustling market of 1,232 active listings.
Whether you're considering an Airbnb investment in San Miguel de Cozumel, optimizing your existing vacation rental, or exploring rental arbitrage opportunities, understanding the San Miguel de Cozumel Airbnb data is crucial. Leveraging the low regulation environment is key to maximizing your short term rental income potential. Let's dive into the specifics.
Key San Miguel de Cozumel Airbnb Performance Metrics Overview
Monthly Airbnb Revenue Variations & Income Potential in San Miguel de Cozumel (2026)
Understanding the monthly revenue variations for Airbnb listings in San Miguel de Cozumel is key to maximizing your short term rental income potential. Seasonality significantly impacts earnings. Our analysis, based on data from the past 12 months, shows that the peak revenue month for STRs in San Miguel de Cozumel is typically February, while September often presents the lowest earnings, highlighting opportunities for strategic pricing adjustments during shoulder and low seasons. Explore the typical Airbnb income in San Miguel de Cozumel across different performance tiers:
- Best-in-class properties (Top 10%) achieve $3,762+ monthly, often utilizing dynamic pricing and superior guest experiences.
- Strong performing properties (Top 25%) earn $1,799 or more, indicating effective management and desirable locations/amenities.
- Typical properties (Median) generate around $834 per month, representing the average market performance.
- Entry-level properties (Bottom 25%) see earnings around $381, often with potential for optimization.
Average Monthly Airbnb Earnings Trend in San Miguel de Cozumel
San Miguel de Cozumel Airbnb Occupancy Rate Trends (2026)
Maximize your bookings by understanding the San Miguel de Cozumel STR occupancy trends. Seasonal demand shifts significantly influence how often properties are booked. Typically, Februarysees the highest demand (peak season occupancy), while October experiences the lowest (low season). Effective strategies, like adjusting minimum stays or offering promotions, can boost occupancy during slower periods. Here's how different property tiers perform in San Miguel de Cozumel:
- Best-in-class properties (Top 10%) achieve 74%+ occupancy, indicating high desirability and potentially optimized availability.
- Strong performing properties (Top 25%) maintain 54% or higher occupancy, suggesting good market fit and guest satisfaction.
- Typical properties (Median) have an occupancy rate around 34%.
- Entry-level properties (Bottom 25%) average 17% occupancy, potentially facing higher vacancy.
Average Monthly Occupancy Rate Trend in San Miguel de Cozumel
Average Daily Rate (ADR) Airbnb Trends in San Miguel de Cozumel (2026)
Effective short term rental pricing strategy in San Miguel de Cozumel involves understanding monthly ADR fluctuations. The Average Daily Rate (ADR) for Airbnb in San Miguel de Cozumel typically peaks in January and dips lowest during August. Leveraging Airbnb dynamic pricing tools or strategies based on this seasonality can significantly boost revenue. Here's a look at the typical nightly rates achieved:
- Best-in-class properties (Top 10%) command rates of $282+ per night, often due to premium features or locations.
- Strong performing properties (Top 25%) achieve nightly rates of $152 or more.
- Typical properties (Median) charge around $81 per night.
- Entry-level properties (Bottom 25%) earn around $48 per night.
Average Daily Rate (ADR) Trend by Month in San Miguel de Cozumel
Get Live San Miguel de Cozumel Market Intelligence 👇

Explore Real-time Analytics
Airbnb Seasonality Analysis & Trends in San Miguel de Cozumel (2026)
Peak Season (February, March, December)
- Revenue averages $2,059 per month
- Occupancy rates average 47.4%
- Daily rates average $138
Shoulder Season
- Revenue averages $1,643 per month
- Occupancy maintains around 36.0%
- Daily rates hold near $135
Low Season (August, September, October)
- Revenue drops to average $1,255 per month
- Occupancy decreases to average 30.1%
- Daily rates adjust to average $132
Seasonality Insights for San Miguel de Cozumel
- The Airbnb seasonality in San Miguel de Cozumel shows moderate seasonality with distinct peak and low periods. While the sections above show seasonal averages, it's also insightful to look at the extremes:
- During the high season, the absolute peak month showcases San Miguel de Cozumel's highest earning potential, with monthly revenues capable of climbing to $2,197, occupancy reaching a high of 56.3%, and ADRs peaking at $153.
- Conversely, the slowest single month of the year, typically falling within the low season, marks the market's lowest point. In this month, revenue might dip to $1,226, occupancy could drop to 28.8%, and ADRs may adjust down to $127.
- Understanding both the seasonal averages and these monthly peaks and troughs in revenue, occupancy, and ADR is crucial for maximizing your Airbnb profit potential in San Miguel de Cozumel.
Seasonal Strategies for Maximizing Profit
- Peak Season: Maximize revenue through premium pricing and potentially longer minimum stays. Ensure high availability.
- Low Season: Offer competitive pricing, special promotions (e.g., extended stay discounts), and flexible cancellation policies. Target off-season travelers like remote workers or budget-conscious guests.
- Shoulder Seasons: Implement dynamic pricing that balances peak and low rates. Target weekend travelers or specific events. Offer slightly more flexible terms than peak season.
- Regularly analyze your own performance against these San Miguel de Cozumel seasonality benchmarks and adjust your pricing and availability strategy accordingly.
Best Areas for Airbnb Investment in San Miguel de Cozumel (2026)
Exploring the top neighborhoods for short-term rentals in San Miguel de Cozumel? This section highlights key areas, outlining why they are attractive for hosts and guests, along with notable local attractions. Consider these locations based on your target guest profile and investment strategy.
| Neighborhood / Area | Why Host Here? (Target Guests & Appeal) | Key Attractions & Landmarks |
|---|---|---|
| Centro | The downtown area of Cozumel, offering a mix of tourist attractions and local culture. It’s close to shops, restaurants, and the ferry terminal, making it a prime location for visitors. | Cozumel Island Museum, Main Plaza, Shopping District, Cozumel Art Museum, Local restaurants and cafes |
| South Cozumel | Known for its beautiful beaches and resorts, this area offers a more relaxed atmosphere compared to downtown. It appeals to tourists looking for beachfront properties and nature activities. | Playa Palancar, Chankanaab Beach Adventure Park, El Cielo, beautiful coral reefs, Snorkeling and diving spots |
| North Hotel Zone | Home to many all-inclusive resorts and luxury hotels, this area attracts families and couples seeking a complete vacation experience with amenities. | Playa Norte, various diving centers, local boutiques, traditional Mexican restaurants, scenic coastal views |
| East Side | Offers a more secluded beach experience with stunning scenery. Ideal for travelers looking for peace and quiet away from the busy tourist areas. | Playa Chen Rio, Playa de la Misiones, wildlife watching, beautiful nature |
| Dive Sites (Palancar Reef) | Cozumel is renowned for its diving spots. Properties near these areas attract diving enthusiasts from around the world. | Palancar Reef, Columbia Reef, dive shops, scuba diving excursions |
| San Gervasio | A historical archaeological site offering insight into Mayan culture. Attracts tourists interested in history and ruins, creating opportunities for unique stays. | San Gervasio Ruins, Mayan culture, guided tours, eco-friendly accommodations |
| Cozumel Downtown Market | A bustling area filled with local vendors and authentic experiences. Tourists love to stay close to the market for easy access to local cuisine and souvenirs. | Cozumel Market, local crafts, traditional foods, souvenir shops |
| Los Cinco Soles | A well-known shopping area catering to tourists looking for local crafts and gifts. Visitors appreciate convenient access to unique local products and art. | Los Cinco Soles Shop, artisan crafts, traditional handmade products, Cozumel souvenirs |
Understanding Airbnb License Requirements & STR Laws in San Miguel de Cozumel (2026)
While San Miguel de Cozumel, Quintana Roo, Mexico currently shows low STR regulations, specific Airbnb license requirements might still exist or change. Always verify the latest short term rental regulations and Airbnb license requirements directly with local government authorities for San Miguel de Cozumel to ensure full compliance before hosting.
(Source: AirROI data, 2026, based on 0% licensed listings)
Top Performing Airbnb Properties in San Miguel de Cozumel (2026)
Benchmark your potential! Explore examples of top-performing Airbnb properties in San Miguel de Cozumelbased on Trailing Twelve Month (TTM) revenue. Analyze their characteristics, revenue, occupancy rate, and ADR to understand what drives success in this market.
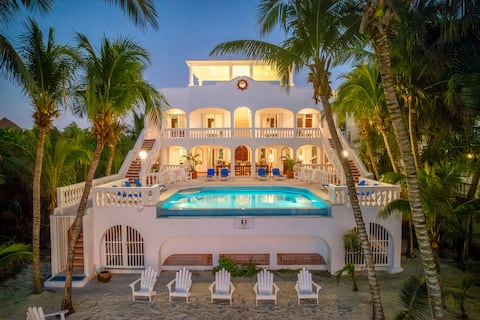
Chango Villa Ocean Front Private Beach 7 Bedrooms
Entire Place • 7 bedrooms
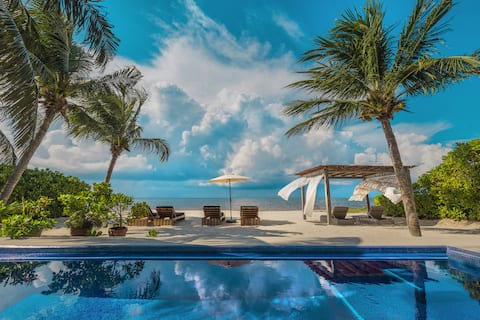
Villa Del Sol a true Luxurious Beachfront haven
Entire Place • 4 bedrooms

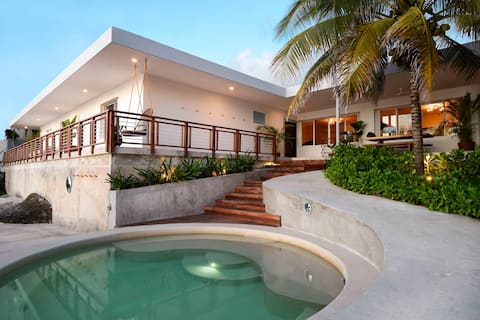
Villa RosMar Luxury Beachfront House
Entire Place • 6 bedrooms

Oceanfront Villa Santa Pilar
Entire Place • 4 bedrooms
Gorgeous Beach Front House
Entire Place • 6 bedrooms

Amazing Beachfront Villa with Pool
Entire Place • 4 bedrooms
Note: Performance varies based on location, size, amenities, seasonality, and management quality. Data reflects the past 12 months.
Top Performing Airbnb Hosts in San Miguel de Cozumel (2026)
Learn from the best! This table showcases top-performing Airbnb hosts in San Miguel de Cozumel based on the number of properties managed and estimated total revenue over the past year. Analyze their scale and performance metrics.
| Host Name | Properties | Grossing Revenue | Stay Reviews | Avg Rating |
|---|---|---|---|---|
| Five Star Property Mexico | 22 | $799,525 | 483 | 4.92/5.0 |
| Ronen | 5 | $575,478 | 60 | 4.98/5.0 |
| Camille | 3 | $472,309 | 387 | 4.93/5.0 |
| Mariano | 4 | $392,230 | 130 | 4.99/5.0 |
| Xavier | 17 | $376,258 | 1101 | 4.77/5.0 |
| Coline | 7 | $360,918 | 1611 | 4.88/5.0 |
| Alicia | 1 | $242,717 | 12 | 4.92/5.0 |
| Carolina | 4 | $242,670 | 340 | 4.95/5.0 |
| Maria Del Rocio | 19 | $232,081 | 877 | 4.77/5.0 |
| The Queen Of Cozumel | 5 | $231,666 | 89 | 4.98/5.0 |
Analyzing the strategies of top hosts, such as their property selection, pricing, and guest communication, can offer valuable lessons for optimizing your own Airbnb operations in San Miguel de Cozumel.
Dive Deeper: Advanced San Miguel de Cozumel STR Market Data (2026)
Ready to unlock more insights? AirROI provides access to advanced metrics and comprehensive Airbnb data for San Miguel de Cozumel. Explore detailed analytics beyond this report to refine your investment strategy, optimize pricing, and maximize your vacation rental profits.
Explore Advanced MetricsSan Miguel de Cozumel Short-Term Rental Market Composition (2026): Property & Room Types
Room Type Distribution
Property Type Distribution
Market Composition Insights for San Miguel de Cozumel
- The San Miguel de Cozumel Airbnb market composition is heavily skewed towards Entire Home/Apt listings, which make up 80.4% of the 1,232 active rentals. This indicates strong guest preference for privacy and space.
- Looking at the property type distribution in San Miguel de Cozumel, Apartment/Condo properties are the most common (59.8%), reflecting the local real estate landscape.
- Houses represent a significant 21.1% portion, catering likely to families or larger groups.
- The presence of 15.8% Hotel/Boutique listings indicates integration with traditional hospitality.
- Smaller segments like others, outdoor/unique (combined 3.2%) offer potential for unique stay experiences.
San Miguel de Cozumel Airbnb Room Capacity Analysis (2026): Bedroom Distribution
Distribution of Listings by Number of Bedrooms
Room Capacity Insights for San Miguel de Cozumel
- The dominant room capacity in San Miguel de Cozumel is 1 bedroom listings, making up 46% of the market. This suggests a strong demand for properties suitable for couples or solo travelers.
- Together, 1 bedroom and 2 bedrooms properties represent 69.9% of the active Airbnb listings in San Miguel de Cozumel, indicating a high concentration in these sizes.
San Miguel de Cozumel Vacation Rental Guest Capacity Trends (2026)
Distribution of Listings by Guest Capacity
Guest Capacity Insights for San Miguel de Cozumel
- The most common guest capacity trend in San Miguel de Cozumel vacation rentals is listings accommodating 2 guests (31.9%). This suggests the primary traveler segment is likely couples or solo travelers.
- Properties designed for 2 guests and 4 guests dominate the San Miguel de Cozumel STR market, accounting for 53.2% of listings.
- 26.4% of properties accommodate 6+ guests, serving the market segment for larger families or group travel in San Miguel de Cozumel.
- On average, properties in San Miguel de Cozumel are equipped to host 3.9 guests.
San Miguel de Cozumel Airbnb Booking Patterns (2026): Available vs. Booked Days
Available Days Distribution
Booked Days Distribution
Booking Pattern Insights for San Miguel de Cozumel
- The most common availability pattern in San Miguel de Cozumel falls within the 271-366 days range, representing 59.5% of listings. This suggests many properties have significant open periods on their calendars.
- Approximately 87.6% of listings show high availability (181+ days open annually), indicating potential for increased bookings or specific owner usage patterns.
- For booked days, the 31-90 days range is most frequent in San Miguel de Cozumel (34.7%), reflecting common guest stay durations or potential owner blocking patterns.
- A notable 12.5% of properties secure long booking periods (181+ days booked per year), highlighting successful long-term rental strategies or significant owner usage.
San Miguel de Cozumel Airbnb Minimum Stay Requirements Analysis
Distribution of Listings by Minimum Night Requirement
1 Night
365 listings
29.6% of total
2 Nights
341 listings
27.7% of total
3 Nights
144 listings
11.7% of total
4-6 Nights
100 listings
8.1% of total
7-29 Nights
20 listings
1.6% of total
30+ Nights
262 listings
21.3% of total
Key Insights
- The most prevalent minimum stay requirement in San Miguel de Cozumel is 1 Night, adopted by 29.6% of listings. This highlights the market's preference for shorter, flexible bookings.
- A significant segment (21.3%) caters to monthly stays (30+ nights) in San Miguel de Cozumel, pointing to opportunities in the extended-stay market.
Recommendations
- Align with the market by considering a 1 Night minimum stay, as 29.6% of San Miguel de Cozumel hosts use this setting.
- If feasible, allowing 1-night stays, especially midweek or during low season, could capture last-minute bookings, as only 29.6% currently do.
- Explore offering discounts for stays of 30+ nights to attract the 21.3% of the market seeking extended stays.
- Adjust minimum nights based on seasonality – potentially shorter during low season and longer during peak demand periods in San Miguel de Cozumel.
San Miguel de Cozumel Airbnb Cancellation Policy Trends Analysis (2026)
Super Strict 60 Days
12 listings
1% of total
Limited
21 listings
1.7% of total
Super Strict 30 Days
5 listings
0.4% of total
Flexible
323 listings
26.2% of total
Moderate
278 listings
22.6% of total
Firm
436 listings
35.4% of total
Strict
156 listings
12.7% of total
Cancellation Policy Insights for San Miguel de Cozumel
- The prevailing Airbnb cancellation policy trend in San Miguel de Cozumel is Firm, used by 35.4% of listings.
- There's a relatively balanced mix between guest-friendly (48.8%) and stricter (48.1%) policies, offering choices for different guest needs.
Recommendations for Hosts
- Consider adopting a Firm policy to align with the 35.4% market standard in San Miguel de Cozumel.
- Using a Strict policy might deter some guests, as only 12.7% of listings use it. Evaluate if potential revenue protection outweighs possible lower booking rates.
- Regularly review your cancellation policy against competitors and market demand shifts in San Miguel de Cozumel.
San Miguel de Cozumel STR Booking Lead Time Analysis (2026)
Average Booking Lead Time by Month
Booking Lead Time Insights for San Miguel de Cozumel
- The overall average booking lead time for vacation rentals in San Miguel de Cozumel is 56 days.
- Guests book furthest in advance for stays during January (average 88 days), likely coinciding with peak travel demand or local events.
- The shortest booking windows occur for stays in July (average 39 days), indicating more last-minute travel plans during this time.
- Seasonally, Winter (78 days avg.) sees the longest lead times, while Summer (40 days avg.) has the shortest, reflecting typical travel planning cycles.
Recommendations for Hosts
- Use the overall average lead time (56 days) as a baseline for your pricing and availability strategy in San Miguel de Cozumel.
- For January stays, consider implementing length-of-stay discounts or slightly higher rates for bookings made less than 88 days out to capitalize on advance planning.
- Target marketing efforts for the Winter season well in advance (at least 78 days) to capture early planners.
- Monitor your own booking lead times against these San Miguel de Cozumel averages to identify opportunities for dynamic pricing adjustments.
Popular & Essential Airbnb Amenities in San Miguel de Cozumel (2026)
Amenity Prevalence
Amenity Insights for San Miguel de Cozumel
- Essential amenities in San Miguel de Cozumel that guests expect include: Wifi, Air conditioning. Lacking these (any) could significantly impact bookings.
- Popular amenities like TV, Hot water, Hangers are common but not universal. Offering these can provide a competitive edge.
Recommendations for Hosts
- Ensure your listing includes all essential amenities for San Miguel de Cozumel: Wifi, Air conditioning.
- Prioritize adding missing essentials: Wifi, Air conditioning.
- Consider adding popular differentiators like TV or Hot water to increase appeal.
- Highlight unique or less common amenities you offer (e.g., hot tub, dedicated workspace, EV charger) in your listing description and photos.
- Regularly check competitor amenities in San Miguel de Cozumel to stay competitive.
San Miguel de Cozumel Airbnb Guest Demographics & Profile Analysis (2026)
Guest Profile Summary for San Miguel de Cozumel
- The typical guest profile for Airbnb in San Miguel de Cozumel consists of predominantly international visitors (70%), with top international origins including Mexico, typically belonging to the Post-2000s (Gen Z/Alpha) group (50%), primarily speaking English or Spanish.
- Domestic travelers account for 30.3% of guests.
- Key international markets include United States (43.4%) and Mexico (30.3%).
- Top languages spoken are English (46.4%) followed by Spanish (32.2%).
- A significant demographic segment is the Post-2000s (Gen Z/Alpha) group, representing 50% of guests.
Recommendations for Hosts
- Focus marketing internationally, particularly towards travelers from Mexico.
- Tailor amenities and listing descriptions to appeal to the dominant Post-2000s (Gen Z/Alpha) demographic (e.g., highlight fast WiFi, smart home features, local guides).
- Highlight unique local experiences or amenities relevant to the primary guest profile.
- Consider seasonal promotions aligned with peak travel times for key origin markets.
Nearby Short-Term Rental Market Comparison
How does the San Miguel de Cozumel Airbnb market stack up against its neighbors? Compare key performance metrics like average monthly revenue, ADR, and occupancy rates in surrounding areas to understand the broader regional STR landscape.
| Market | Active Properties | Monthly Revenue | Daily Rate | Avg. Occupancy |
|---|---|---|---|---|
| Punta Sam | 32 | $3,194 | $441.63 | 37% |
| Isla Mujeres | 898 | $2,309 | $237.30 | 39% |
| Cozumel | 38 | $2,211 | $321.10 | 33% |
| Quintana Roo | 85 | $1,678 | $238.66 | 34% |
| Puerto Aventuras | 399 | $1,631 | $278.65 | 32% |
| Holbox | 617 | $1,314 | $163.08 | 31% |
| Tulum | 8,104 | $1,240 | $183.84 | 31% |
| Cancún | 5,959 | $1,046 | $117.71 | 39% |
| Playa del Carmen | 7,725 | $1,018 | $128.74 | 38% |
| Puerto Morelos | 873 | $965 | $143.05 | 35% |