Sonora Airbnb Market Analysis 2026: Short Term Rental Data & Vacation Rental Statistics in Sonora, Mexico
Is Airbnb profitable in Sonora in 2026? Explore comprehensive Airbnb analytics for Sonora, Sonora, Mexico to uncover income potential. This 2026 STR market report for Sonora, based on AirROI data from February 2025 to January 2026, reveals key trends in the niche market of 27 active listings.
Whether you're considering an Airbnb investment in Sonora, optimizing your existing vacation rental, or exploring rental arbitrage opportunities, understanding the Sonora Airbnb data is crucial. Leveraging the low regulation environment is key to maximizing your short term rental income potential. Let's dive into the specifics.
Key Sonora Airbnb Performance Metrics Overview
Monthly Airbnb Revenue Variations & Income Potential in Sonora (2026)
Understanding the monthly revenue variations for Airbnb listings in Sonora is key to maximizing your short term rental income potential. Seasonality significantly impacts earnings. Our analysis, based on data from the past 12 months, shows that the peak revenue month for STRs in Sonora is typically April, while February often presents the lowest earnings, highlighting opportunities for strategic pricing adjustments during shoulder and low seasons. Explore the typical Airbnb income in Sonora across different performance tiers:
- Best-in-class properties (Top 10%) achieve $5,843+ monthly, often utilizing dynamic pricing and superior guest experiences.
- Strong performing properties (Top 25%) earn $3,315 or more, indicating effective management and desirable locations/amenities.
- Typical properties (Median) generate around $1,770 per month, representing the average market performance.
- Entry-level properties (Bottom 25%) see earnings around $836, often with potential for optimization.
Average Monthly Airbnb Earnings Trend in Sonora
Sonora Airbnb Occupancy Rate Trends (2026)
Maximize your bookings by understanding the Sonora STR occupancy trends. Seasonal demand shifts significantly influence how often properties are booked. Typically, Aprilsees the highest demand (peak season occupancy), while December experiences the lowest (low season). Effective strategies, like adjusting minimum stays or offering promotions, can boost occupancy during slower periods. Here's how different property tiers perform in Sonora:
- Best-in-class properties (Top 10%) achieve 52%+ occupancy, indicating high desirability and potentially optimized availability.
- Strong performing properties (Top 25%) maintain 39% or higher occupancy, suggesting good market fit and guest satisfaction.
- Typical properties (Median) have an occupancy rate around 22%.
- Entry-level properties (Bottom 25%) average 12% occupancy, potentially facing higher vacancy.
Average Monthly Occupancy Rate Trend in Sonora
Average Daily Rate (ADR) Airbnb Trends in Sonora (2026)
Effective short term rental pricing strategy in Sonora involves understanding monthly ADR fluctuations. The Average Daily Rate (ADR) for Airbnb in Sonora typically peaks in January and dips lowest during February. Leveraging Airbnb dynamic pricing tools or strategies based on this seasonality can significantly boost revenue. Here's a look at the typical nightly rates achieved:
- Best-in-class properties (Top 10%) command rates of $584+ per night, often due to premium features or locations.
- Strong performing properties (Top 25%) achieve nightly rates of $387 or more.
- Typical properties (Median) charge around $230 per night.
- Entry-level properties (Bottom 25%) earn around $145 per night.
Average Daily Rate (ADR) Trend by Month in Sonora
Get Live Sonora Market Intelligence 👇
Explore Real-time Analytics
Airbnb Seasonality Analysis & Trends in Sonora (2026)
Peak Season (April, July, August)
- Revenue averages $3,999 per month
- Occupancy rates average 35.5%
- Daily rates average $338
Shoulder Season
- Revenue averages $2,753 per month
- Occupancy maintains around 24.8%
- Daily rates hold near $352
Low Season (February, May, June)
- Revenue drops to average $2,256 per month
- Occupancy decreases to average 24.2%
- Daily rates adjust to average $331
Seasonality Insights for Sonora
- The Airbnb seasonality in Sonora shows highly seasonal trends requiring careful strategy. While the sections above show seasonal averages, it's also insightful to look at the extremes:
- During the high season, the absolute peak month showcases Sonora's highest earning potential, with monthly revenues capable of climbing to $4,166, occupancy reaching a high of 40.3%, and ADRs peaking at $366.
- Conversely, the slowest single month of the year, typically falling within the low season, marks the market's lowest point. In this month, revenue might dip to $1,837, occupancy could drop to 15.0%, and ADRs may adjust down to $321.
- Understanding both the seasonal averages and these monthly peaks and troughs in revenue, occupancy, and ADR is crucial for maximizing your Airbnb profit potential in Sonora.
Seasonal Strategies for Maximizing Profit
- Peak Season: Maximize revenue through premium pricing and potentially longer minimum stays. Ensure high availability.
- Low Season: Offer competitive pricing, special promotions (e.g., extended stay discounts), and flexible cancellation policies. Target off-season travelers like remote workers or budget-conscious guests.
- Shoulder Seasons: Implement dynamic pricing that balances peak and low rates. Target weekend travelers or specific events. Offer slightly more flexible terms than peak season.
- Regularly analyze your own performance against these Sonora seasonality benchmarks and adjust your pricing and availability strategy accordingly.
Best Areas for Airbnb Investment in Sonora (2026)
Exploring the top neighborhoods for short-term rentals in Sonora? This section highlights key areas, outlining why they are attractive for hosts and guests, along with notable local attractions. Consider these locations based on your target guest profile and investment strategy.
| Neighborhood / Area | Why Host Here? (Target Guests & Appeal) | Key Attractions & Landmarks |
|---|---|---|
| Centro | The heart of Sonora, attracting tourists with its vibrant culture, shopping, and dining. A lively area with historical landmarks and a local atmosphere. | Plaza Zaragoza, Sonora Museum, Government Palace, Cathedral of Hermosillo, Cerro de la Campana |
| Puerto Peñasco | A popular beach destination along the Sea of Cortez, known for its stunning beaches and recreational activities. Attracts both local and international tourists. | Sandy Beach, La Malecón, Cholla Bay, Cabo Peñasco Marina, Cerro de la Pólvora |
| Nogales | A border city that offers a unique blend of Mexican and American culture, attracting visitors for shopping and cultural exchanges. | Paseo del Comercio, Nogales Mall, Museo de Arte de Nogales, Parque Nogales, Plaza de la Bandera |
| San Carlos | A picturesque beach town on the Sonoran coast, known for its beautiful views and water sports, appealing to outdoor enthusiasts. | San Carlos Beach, Marina San Carlos, Mirador Escénico, Las Palmas Beach, El Geiser |
| Guaymas | A coastal city with rich history and cultural heritage. Known for its port and seafood, attracting travelers seeking both adventure and relaxation. | Guaymas Bay, San Fernando Cathedral, Delfinario Sonora, Playa de la Siete Mares, Museo de la Ciudad |
| Hermosillo | The capital city of Sonora, it has a diverse range of activities from cultural experiences to modern dining, appealing to various tourists. | Centro Ecologico de Sonora, Museo Sonora en la Revolución, Plaza Bicentenario, Cerro de la Campana, Casa de la Cultura |
| Sierra de San Pedro Mártir | A stunning natural park area that offers hiking and camping, attracting nature lovers and adventure seekers. | Astronomical Observatory, Natural Park, Biodiversity, Lakes and Mountains, Camping Sites |
| Alamos | A charming colonial town, known for its beautiful architecture and cultural festivals. Attracts those interested in history and arts. | Plaza de Alamos, Museo Costumbrista, Templo de la Purísima Concepción, Festival Internacional de Cine |
Understanding Airbnb License Requirements & STR Laws in Sonora (2026)
While Sonora, Sonora, Mexico currently shows low STR regulations, specific Airbnb license requirements might still exist or change. Always verify the latest short term rental regulations and Airbnb license requirements directly with local government authorities for Sonora to ensure full compliance before hosting.
(Source: AirROI data, 2026, finding no licensed listings among those analyzed)
Top Performing Airbnb Properties in Sonora (2026)
Benchmark your potential! Explore examples of top-performing Airbnb properties in Sonorabased on Trailing Twelve Month (TTM) revenue. Analyze their characteristics, revenue, occupancy rate, and ADR to understand what drives success in this market.

Casa Bellavista amazing sea views!
Entire Place • 5 bedrooms
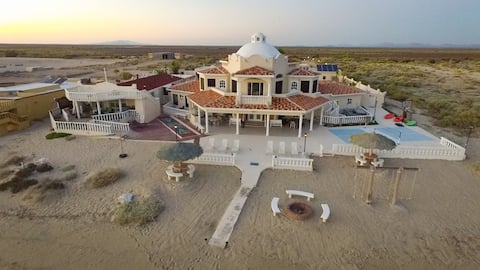
The Sandcastle, Beachfront, Sleeps 50!
Entire Place • 11 bedrooms

Casa Alegria with pool & jacuzzi - Marina Real SC
Entire Place • 5 bedrooms

San Carlos viewpoint pool house
Entire Place • 4 bedrooms

Marina Real 39, Beach House
Entire Place • 4 bedrooms

ENCANTAME TOWERS- 20TH FLOOR - 1B/1B - SLEEPS 4!!
Entire Place • 1 bedroom
Note: Performance varies based on location, size, amenities, seasonality, and management quality. Data reflects the past 12 months.
Top Performing Airbnb Hosts in Sonora (2026)
Learn from the best! This table showcases top-performing Airbnb hosts in Sonora based on the number of properties managed and estimated total revenue over the past year. Analyze their scale and performance metrics.
| Host Name | Properties | Grossing Revenue | Stay Reviews | Avg Rating |
|---|---|---|---|---|
| Humberto | 1 | $141,041 | 18 | 4.94/5.0 |
| Eric | 2 | $103,355 | 6 | 4.83/5.0 |
| Roberto | 1 | $58,224 | 32 | 4.84/5.0 |
| Hedman | 1 | $42,160 | 128 | 4.79/5.0 |
| Tricia | 2 | $37,962 | 29 | 4.97/5.0 |
| Rosario | 1 | $36,369 | 46 | 5.00/5.0 |
| Tom | 1 | $29,835 | 67 | 4.97/5.0 |
| Liz | 1 | $29,519 | 1 | Not Rated |
| Eduardo | 2 | $29,269 | 23 | 4.79/5.0 |
| JKW Vacation Club | 1 | $26,597 | 38 | 4.95/5.0 |
Analyzing the strategies of top hosts, such as their property selection, pricing, and guest communication, can offer valuable lessons for optimizing your own Airbnb operations in Sonora.
Dive Deeper: Advanced Sonora STR Market Data (2026)
Ready to unlock more insights? AirROI provides access to advanced metrics and comprehensive Airbnb data for Sonora. Explore detailed analytics beyond this report to refine your investment strategy, optimize pricing, and maximize your vacation rental profits.
Explore Advanced MetricsSonora Short-Term Rental Market Composition (2026): Property & Room Types
Room Type Distribution
Property Type Distribution
Market Composition Insights for Sonora
- The Sonora Airbnb market composition is heavily skewed towards Entire Home/Apt listings, which make up 100% of the 27 active rentals. This indicates strong guest preference for privacy and space.
- Looking at the property type distribution in Sonora, Apartment/Condo properties are the most common (55.6%), reflecting the local real estate landscape.
- Houses represent a significant 40.7% portion, catering likely to families or larger groups.
- Smaller segments like hotel/boutique (combined 3.7%) offer potential for unique stay experiences.
Sonora Airbnb Room Capacity Analysis (2026): Bedroom Distribution
Distribution of Listings by Number of Bedrooms
Room Capacity Insights for Sonora
- The dominant room capacity in Sonora is 1 bedroom listings, making up 25.9% of the market. This suggests a strong demand for properties suitable for couples or solo travelers.
- Together, 1 bedroom and 3 bedrooms properties represent 51.8% of the active Airbnb listings in Sonora, indicating a high concentration in these sizes.
- A significant 51.8% of listings offer 3+ bedrooms, catering to larger groups and families seeking more space in Sonora.
Sonora Vacation Rental Guest Capacity Trends (2026)
Distribution of Listings by Guest Capacity
Guest Capacity Insights for Sonora
- The most common guest capacity trend in Sonora vacation rentals is listings accommodating 8+ guests (51.9%). This suggests the primary traveler segment is likely larger groups.
- Properties designed for 8+ guests and 4 guests dominate the Sonora STR market, accounting for 81.5% of listings.
- 70.4% of properties accommodate 6+ guests, serving the market segment for larger families or group travel in Sonora.
- On average, properties in Sonora are equipped to host 6.5 guests.
Sonora Airbnb Booking Patterns (2026): Available vs. Booked Days
Available Days Distribution
Booked Days Distribution
Booking Pattern Insights for Sonora
- The most common availability pattern in Sonora falls within the 271-366 days range, representing 74.1% of listings. This suggests many properties have significant open periods on their calendars.
- Approximately 100.0% of listings show high availability (181+ days open annually), indicating potential for increased bookings or specific owner usage patterns.
- For booked days, the 31-90 days range is most frequent in Sonora (51.9%), reflecting common guest stay durations or potential owner blocking patterns.
Sonora Airbnb Minimum Stay Requirements Analysis
Distribution of Listings by Minimum Night Requirement
1 Night
3 listings
11.1% of total
2 Nights
20 listings
74.1% of total
3 Nights
2 listings
7.4% of total
30+ Nights
2 listings
7.4% of total
Key Insights
- The most prevalent minimum stay requirement in Sonora is 2 Nights, adopted by 74.1% of listings. This highlights the market's preference for shorter, flexible bookings.
- A strong majority (85.2%) of the Sonora Airbnb data shows acceptance of very short stays (1-2 nights), indicating a dynamic, high-turnover market.
Recommendations
- Align with the market by considering a 2 Nights minimum stay, as 74.1% of Sonora hosts use this setting.
- If feasible, allowing 1-night stays, especially midweek or during low season, could capture last-minute bookings, as only 11.1% currently do.
- A 2-night minimum appears standard (74.1%). Consider this for weekends or peak periods.
- Explore offering discounts for stays of 30+ nights to attract the 7.4% of the market seeking extended stays.
- Adjust minimum nights based on seasonality – potentially shorter during low season and longer during peak demand periods in Sonora.
Sonora Airbnb Cancellation Policy Trends Analysis (2026)
Limited
1 listings
3.7% of total
Flexible
7 listings
25.9% of total
Moderate
4 listings
14.8% of total
Firm
13 listings
48.1% of total
Strict
2 listings
7.4% of total
Cancellation Policy Insights for Sonora
- The prevailing Airbnb cancellation policy trend in Sonora is Firm, used by 48.1% of listings.
- A majority (55.5%) of hosts in Sonora utilize Firm or Strict policies, indicating a market where hosts prioritize booking security.
- Strict cancellation policies are quite rare (7.4%), potentially making listings with this policy less competitive unless justified by high demand or property type.
Recommendations for Hosts
- Consider adopting a Firm policy to align with the 48.1% market standard in Sonora.
- Using a Strict policy might deter some guests, as only 7.4% of listings use it. Evaluate if potential revenue protection outweighs possible lower booking rates.
- Regularly review your cancellation policy against competitors and market demand shifts in Sonora.
Sonora STR Booking Lead Time Analysis (2026)
Average Booking Lead Time by Month
Booking Lead Time Insights for Sonora
- The overall average booking lead time for vacation rentals in Sonora is 39 days.
- Guests book furthest in advance for stays during November (average 72 days), likely coinciding with peak travel demand or local events.
- The shortest booking windows occur for stays in August (average 17 days), indicating more last-minute travel plans during this time.
- Seasonally, Fall (51 days avg.) sees the longest lead times, while Summer (29 days avg.) has the shortest, reflecting typical travel planning cycles.
Recommendations for Hosts
- Use the overall average lead time (39 days) as a baseline for your pricing and availability strategy in Sonora.
- For November stays, consider implementing length-of-stay discounts or slightly higher rates for bookings made less than 72 days out to capitalize on advance planning.
- Target marketing efforts for the Fall season well in advance (at least 51 days) to capture early planners.
- Monitor your own booking lead times against these Sonora averages to identify opportunities for dynamic pricing adjustments.
Popular & Essential Airbnb Amenities in Sonora (2026)
Amenity Prevalence
Amenity Insights for Sonora
- Essential amenities in Sonora that guests expect include: Air conditioning, Wifi, Free parking on premises, Kitchen, Refrigerator. Lacking these (any) could significantly impact bookings.
- Popular amenities like Dishes and silverware, Washer, Cooking basics are common but not universal. Offering these can provide a competitive edge.
Recommendations for Hosts
- Ensure your listing includes all essential amenities for Sonora: Air conditioning, Wifi, Free parking on premises, Kitchen, Refrigerator.
- Prioritize adding missing essentials: Kitchen, Refrigerator.
- Consider adding popular differentiators like Dishes and silverware or Washer to increase appeal.
- Highlight unique or less common amenities you offer (e.g., hot tub, dedicated workspace, EV charger) in your listing description and photos.
- Regularly check competitor amenities in Sonora to stay competitive.
Sonora Airbnb Guest Demographics & Profile Analysis (2026)
Guest Profile Summary for Sonora
- The typical guest profile for Airbnb in Sonora consists of a mix of domestic (52%) and international guests, often arriving from nearby Hermosillo, typically belonging to the Post-2000s (Gen Z/Alpha) group (50%), primarily speaking English or Spanish.
- Domestic travelers account for 51.6% of guests.
- Key international markets include Mexico (51.6%) and United States (46.3%).
- Top languages spoken are English (45.5%) followed by Spanish (44.2%).
- A significant demographic segment is the Post-2000s (Gen Z/Alpha) group, representing 50% of guests.
Recommendations for Hosts
- Balance marketing efforts between domestic and international channels based on the guest mix.
- Tailor amenities and listing descriptions to appeal to the dominant Post-2000s (Gen Z/Alpha) demographic (e.g., highlight fast WiFi, smart home features, local guides).
- Highlight unique local experiences or amenities relevant to the primary guest profile.
- Consider seasonal promotions aligned with peak travel times for key origin markets.
Nearby Short-Term Rental Market Comparison
How does the Sonora Airbnb market stack up against its neighbors? Compare key performance metrics like average monthly revenue, ADR, and occupancy rates in surrounding areas to understand the broader regional STR landscape.
| Market | Active Properties | Monthly Revenue | Daily Rate | Avg. Occupancy |
|---|---|---|---|---|
| Bahía de Kino | 20 | $1,458 | $304.15 | 22% |
| Bahía Kino | 213 | $1,378 | $241.58 | 24% |
| San Pedro el Saucito | 11 | $838 | $248.22 | 16% |
| Hermosillo | 1,226 | $393 | $50.95 | 35% |
| Heroica Caborca | 15 | $243 | $47.16 | 23% |
| Magdalena de Kino | 14 | $219 | $73.90 | 19% |
| Huépac | 10 | $33 | $29.19 | 7% |