Lerma Airbnb Market Analysis 2026: Short Term Rental Data & Vacation Rental Statistics in State of Mexico, Mexico
Is Airbnb profitable in Lerma in 2026? Explore comprehensive Airbnb analytics for Lerma, State of Mexico, Mexico to uncover income potential. This 2026 STR market report for Lerma, based on AirROI data from January 2025 to December 2025, reveals key trends in the niche market of 19 active listings.
Whether you're considering an Airbnb investment in Lerma, optimizing your existing vacation rental, or exploring rental arbitrage opportunities, understanding the Lerma Airbnb data is crucial. Leveraging the low regulation environment is key to maximizing your short term rental income potential. Let's dive into the specifics.
Key Lerma Airbnb Performance Metrics Overview
Monthly Airbnb Revenue Variations & Income Potential in Lerma (2026)
Understanding the monthly revenue variations for Airbnb listings in Lerma is key to maximizing your short term rental income potential. Seasonality significantly impacts earnings. Our analysis, based on data from the past 12 months, shows that the peak revenue month for STRs in Lerma is typically November, while December often presents the lowest earnings, highlighting opportunities for strategic pricing adjustments during shoulder and low seasons. Explore the typical Airbnb income in Lerma across different performance tiers:
- Best-in-class properties (Top 10%) achieve $1,273+ monthly, often utilizing dynamic pricing and superior guest experiences.
- Strong performing properties (Top 25%) earn $590 or more, indicating effective management and desirable locations/amenities.
- Typical properties (Median) generate around $313 per month, representing the average market performance.
- Entry-level properties (Bottom 25%) see earnings around $159, often with potential for optimization.
Average Monthly Airbnb Earnings Trend in Lerma
Lerma Airbnb Occupancy Rate Trends (2026)
Maximize your bookings by understanding the Lerma STR occupancy trends. Seasonal demand shifts significantly influence how often properties are booked. Typically, Februarysees the highest demand (peak season occupancy), while June experiences the lowest (low season). Effective strategies, like adjusting minimum stays or offering promotions, can boost occupancy during slower periods. Here's how different property tiers perform in Lerma:
- Best-in-class properties (Top 10%) achieve 72%+ occupancy, indicating high desirability and potentially optimized availability.
- Strong performing properties (Top 25%) maintain 54% or higher occupancy, suggesting good market fit and guest satisfaction.
- Typical properties (Median) have an occupancy rate around 33%.
- Entry-level properties (Bottom 25%) average 18% occupancy, potentially facing higher vacancy.
Average Monthly Occupancy Rate Trend in Lerma
Average Daily Rate (ADR) Airbnb Trends in Lerma (2026)
Effective short term rental pricing strategy in Lerma involves understanding monthly ADR fluctuations. The Average Daily Rate (ADR) for Airbnb in Lerma typically peaks in August and dips lowest during March. Leveraging Airbnb dynamic pricing tools or strategies based on this seasonality can significantly boost revenue. Here's a look at the typical nightly rates achieved:
- Best-in-class properties (Top 10%) command rates of $103+ per night, often due to premium features or locations.
- Strong performing properties (Top 25%) achieve nightly rates of $51 or more.
- Typical properties (Median) charge around $25 per night.
- Entry-level properties (Bottom 25%) earn around $18 per night.
Average Daily Rate (ADR) Trend by Month in Lerma
Get Live Lerma Market Intelligence 👇

Explore Real-time Analytics
Airbnb Seasonality Analysis & Trends in Lerma (2025)
Peak Season (November, August, February)
- Revenue averages $660 per month
- Occupancy rates average 45.5%
- Daily rates average $77
Shoulder Season
- Revenue averages $481 per month
- Occupancy maintains around 36.4%
- Daily rates hold near $75
Low Season (April, May, December)
- Revenue drops to average $385 per month
- Occupancy decreases to average 33.1%
- Daily rates adjust to average $75
Seasonality Insights for Lerma
- The Airbnb seasonality in Lerma shows moderate seasonality with distinct peak and low periods. While the sections above show seasonal averages, it's also insightful to look at the extremes:
- During the high season, the absolute peak month showcases Lerma's highest earning potential, with monthly revenues capable of climbing to $720, occupancy reaching a high of 54.4%, and ADRs peaking at $79.
- Conversely, the slowest single month of the year, typically falling within the low season, marks the market's lowest point. In this month, revenue might dip to $378, occupancy could drop to 24.2%, and ADRs may adjust down to $72.
- Understanding both the seasonal averages and these monthly peaks and troughs in revenue, occupancy, and ADR is crucial for maximizing your Airbnb profit potential in Lerma.
Seasonal Strategies for Maximizing Profit
- Peak Season: Maximize revenue through premium pricing and potentially longer minimum stays. Ensure high availability.
- Low Season: Offer competitive pricing, special promotions (e.g., extended stay discounts), and flexible cancellation policies. Target off-season travelers like remote workers or budget-conscious guests.
- Shoulder Seasons: Implement dynamic pricing that balances peak and low rates. Target weekend travelers or specific events. Offer slightly more flexible terms than peak season.
- Regularly analyze your own performance against these Lerma seasonality benchmarks and adjust your pricing and availability strategy accordingly.
Best Areas for Airbnb Investment in Lerma (2026)
Exploring the top neighborhoods for short-term rentals in Lerma? This section highlights key areas, outlining why they are attractive for hosts and guests, along with notable local attractions. Consider these locations based on your target guest profile and investment strategy.
| Neighborhood / Area | Why Host Here? (Target Guests & Appeal) | Key Attractions & Landmarks |
|---|---|---|
| Centro Lerma | The heart of Lerma, offering easy access to restaurants, shops, and cultural attractions. A prime location for travelers who want to explore the local culture and amenities. | Plaza Central Lerma, Catedral de Lerma, Museo de Historia Natural, Local markets, Nearby parks |
| Toluca | Just a short drive from Lerma, Toluca is the capital of the State of Mexico with a rich history and vibrant culture. Ideal for travelers looking for more urban experiences and historical sites. | Toluca Cathedral, Cosmovitral Botanical Garden, Cultural Center Mexiquense, Museo de Bellas Artes, Nevado de Toluca National Park |
| Ixtapan de la Sal | A popular tourist destination known for its warm waters and relaxing spas. Attracts visitors looking for a weekend getaway or a wellness retreat. | Terma de Ixtapan, Ixtapan de la Sal Golf Club, Water parks, Spa resorts, Cerro de las Palomas |
| Malinalco | A picturesque town known for its pre-Hispanic archaeological sites and stunning landscapes. Ideal for those interested in culture and natural beauty. | Malinalco Archaeological Site, Convent of the Augustinians, Nature trails, Local artisan shops, Scenic viewpoints |
| Valle de Bravo | A charming lakeside town known for its outdoor activities and beautiful scenery. A popular destination for both adventure seekers and relaxation. | Laguna de Valle de Bravo, El peñón, Valle de Bravo waterfall, Cerro Gordo, Historic town center |
| Zinacantepec | A quiet town close to Lerma and Toluca, providing a peaceful atmosphere with access to nature and local attractions. | Cerro de la Silla, Museo de la Independencia, Local cultural events, Nature parks, Tranquil ambiance |
| San Mateo Atenco | Known for its artisan culture and proximity to Toluca, it offers visitors a glimpse into traditional handicrafts and local gastronomy. | Plaza de los Artesanos, Traditional markets, Local culinary experiences, Cultural festivals, Vibrant community |
| Santo Tomás de los Plátanos | A small, scenic village known for its natural beauty and outdoor activities. Ideal for those looking to escape the urban environment. | Hiking trails, Natural landscapes, Local festivals, Community events, Traditional cuisine |
Understanding Airbnb License Requirements & STR Laws in Lerma (2026)
While Lerma, State of Mexico, Mexico currently shows low STR regulations, specific Airbnb license requirements might still exist or change. Always verify the latest short term rental regulations and Airbnb license requirements directly with local government authorities for Lerma to ensure full compliance before hosting.
(Source: AirROI data, 2026, finding no licensed listings among those analyzed)
Top Performing Airbnb Properties in Lerma (2026)
Benchmark your potential! Explore examples of top-performing Airbnb properties in Lermabased on Trailing Twelve Month (TTM) revenue. Analyze their characteristics, revenue, occupancy rate, and ADR to understand what drives success in this market.
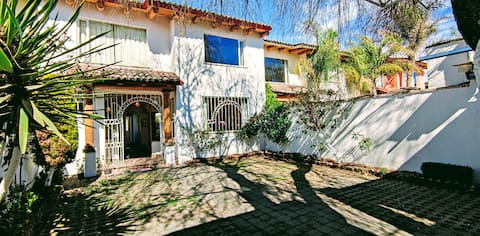
Exclusive whole house for home office or leisure
Entire Place • 4 bedrooms

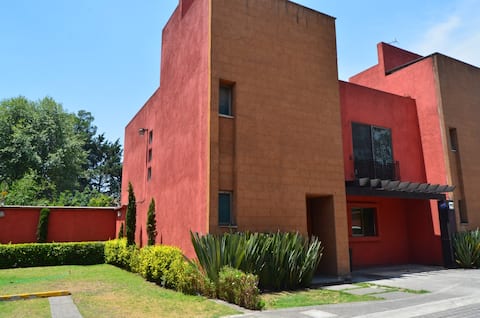
Private house | 6 beds + WiFi + parking
Entire Place • 3 bedrooms
perfect location to rent 7 min to Toluca airport
Entire Place • 3 bedrooms

Nice Entire Accommodation, Lerma
Entire Place • 2 bedrooms

ENJOY YOUR STAY
Private Room • N/A

Nice furnished apartment
Entire Place • 1 bedroom
Note: Performance varies based on location, size, amenities, seasonality, and management quality. Data reflects the past 12 months.
Top Performing Airbnb Hosts in Lerma (2026)
Learn from the best! This table showcases top-performing Airbnb hosts in Lerma based on the number of properties managed and estimated total revenue over the past year. Analyze their scale and performance metrics.
| Host Name | Properties | Grossing Revenue | Stay Reviews | Avg Rating |
|---|---|---|---|---|
| Jose Luis | 3 | $36,792 | 129 | 4.85/5.0 |
| Ramon | 1 | $4,384 | 10 | 5.00/5.0 |
| Silvia | 1 | $3,735 | 168 | 4.95/5.0 |
| Jaime Alfredo | 1 | $3,717 | 23 | 4.83/5.0 |
| Alfonso | 4 | $2,926 | 49 | 4.43/5.0 |
| Betty | 1 | $2,016 | 8 | 4.63/5.0 |
| Alfonso | 2 | $1,884 | 32 | 3.96/5.0 |
| Zianya | 1 | $940 | 3 | 4.67/5.0 |
| Gina | 1 | $804 | 44 | 4.91/5.0 |
| Mariel | 2 | $663 | 10 | 3.92/5.0 |
Analyzing the strategies of top hosts, such as their property selection, pricing, and guest communication, can offer valuable lessons for optimizing your own Airbnb operations in Lerma.
Dive Deeper: Advanced Lerma STR Market Data (2026)
Ready to unlock more insights? AirROI provides access to advanced metrics and comprehensive Airbnb data for Lerma. Explore detailed analytics beyond this report to refine your investment strategy, optimize pricing, and maximize your vacation rental profits.
Explore Advanced MetricsLerma Short-Term Rental Market Composition (2026): Property & Room Types
Room Type Distribution
Property Type Distribution
Market Composition Insights for Lerma
- The Lerma Airbnb market composition is heavily skewed towards Entire Home/Apt listings, which make up 84.2% of the 19 active rentals. This indicates strong guest preference for privacy and space.
- Looking at the property type distribution in Lerma, Apartment/Condo properties are the most common (52.6%), reflecting the local real estate landscape.
- Houses represent a significant 47.4% portion, catering likely to families or larger groups.
Lerma Airbnb Room Capacity Analysis (2026): Bedroom Distribution
Distribution of Listings by Number of Bedrooms
Room Capacity Insights for Lerma
- The dominant room capacity in Lerma is 2 bedrooms listings, making up 52.6% of the market. This suggests a strong demand for properties suitable for couples or solo travelers.
- Together, 2 bedrooms and 3 bedrooms properties represent 68.4% of the active Airbnb listings in Lerma, indicating a high concentration in these sizes.
- A significant 21.1% of listings offer 3+ bedrooms, catering to larger groups and families seeking more space in Lerma.
Lerma Vacation Rental Guest Capacity Trends (2026)
Distribution of Listings by Guest Capacity
Guest Capacity Insights for Lerma
- The most common guest capacity trend in Lerma vacation rentals is listings accommodating 6 guests (21.1%). This suggests the primary traveler segment is likely larger groups.
- Properties designed for 6 guests and 4 guests dominate the Lerma STR market, accounting for 36.9% of listings.
- 47.4% of properties accommodate 6+ guests, serving the market segment for larger families or group travel in Lerma.
- On average, properties in Lerma are equipped to host 4.7 guests.
Lerma Airbnb Booking Patterns (2026): Available vs. Booked Days
Available Days Distribution
Booked Days Distribution
Booking Pattern Insights for Lerma
- The most common availability pattern in Lerma falls within the 271-366 days range, representing 63.2% of listings. This suggests many properties have significant open periods on their calendars.
- Approximately 89.5% of listings show high availability (181+ days open annually), indicating potential for increased bookings or specific owner usage patterns.
- For booked days, the 1-30 days range is most frequent in Lerma (52.6%), reflecting common guest stay durations or potential owner blocking patterns.
- A notable 15.8% of properties secure long booking periods (181+ days booked per year), highlighting successful long-term rental strategies or significant owner usage.
Lerma Airbnb Minimum Stay Requirements Analysis
Distribution of Listings by Minimum Night Requirement
1 Night
2 listings
10.5% of total
2 Nights
14 listings
73.7% of total
4-6 Nights
3 listings
15.8% of total
Key Insights
- The most prevalent minimum stay requirement in Lerma is 2 Nights, adopted by 73.7% of listings. This highlights the market's preference for shorter, flexible bookings.
- A strong majority (84.2%) of the Lerma Airbnb data shows acceptance of very short stays (1-2 nights), indicating a dynamic, high-turnover market.
Recommendations
- Align with the market by considering a 2 Nights minimum stay, as 73.7% of Lerma hosts use this setting.
- If feasible, allowing 1-night stays, especially midweek or during low season, could capture last-minute bookings, as only 10.5% currently do.
- A 2-night minimum appears standard (73.7%). Consider this for weekends or peak periods.
- Adjust minimum nights based on seasonality – potentially shorter during low season and longer during peak demand periods in Lerma.
Lerma Airbnb Cancellation Policy Trends Analysis (2026)
Flexible
13 listings
68.4% of total
Moderate
3 listings
15.8% of total
Firm
1 listings
5.3% of total
Strict
2 listings
10.5% of total
Cancellation Policy Insights for Lerma
- The prevailing Airbnb cancellation policy trend in Lerma is Flexible, used by 68.4% of listings.
- The market strongly favors guest-friendly terms, with 84.2% of listings offering Flexible or Moderate policies. This suggests guests in Lerma may expect booking flexibility.
Recommendations for Hosts
- Consider adopting a Flexible policy to align with the 68.4% market standard in Lerma.
- Given the high prevalence of Flexible policies (68.4%), offering this can enhance booking appeal, especially during shoulder seasons.
- Using a Strict policy might deter some guests, as only 10.5% of listings use it. Evaluate if potential revenue protection outweighs possible lower booking rates.
- Regularly review your cancellation policy against competitors and market demand shifts in Lerma.
Lerma STR Booking Lead Time Analysis (2026)
Average Booking Lead Time by Month
Booking Lead Time Insights for Lerma
- The overall average booking lead time for vacation rentals in Lerma is 8 days.
- Guests book furthest in advance for stays during August (average 19 days), likely coinciding with peak travel demand or local events.
- The shortest booking windows occur for stays in September (average 3 days), indicating more last-minute travel plans during this time.
- Seasonally, Winter (11 days avg.) sees the longest lead times, while Fall (5 days avg.) has the shortest, reflecting typical travel planning cycles.
Recommendations for Hosts
- Use the overall average lead time (8 days) as a baseline for your pricing and availability strategy in Lerma.
- For August stays, consider implementing length-of-stay discounts or slightly higher rates for bookings made less than 19 days out to capitalize on advance planning.
- Target marketing efforts for the Winter season well in advance (at least 11 days) to capture early planners.
- Monitor your own booking lead times against these Lerma averages to identify opportunities for dynamic pricing adjustments.
Popular & Essential Airbnb Amenities in Lerma (2026)
Amenity Prevalence
Amenity Insights for Lerma
- Essential amenities in Lerma that guests expect include: Wifi, Free parking on premises. Lacking these (any) could significantly impact bookings.
- Popular amenities like TV, Kitchen, Carbon monoxide alarm are common but not universal. Offering these can provide a competitive edge.
Recommendations for Hosts
- Ensure your listing includes all essential amenities for Lerma: Wifi, Free parking on premises.
- Consider adding popular differentiators like TV or Kitchen to increase appeal.
- Highlight unique or less common amenities you offer (e.g., hot tub, dedicated workspace, EV charger) in your listing description and photos.
- Regularly check competitor amenities in Lerma to stay competitive.
Lerma Airbnb Guest Demographics & Profile Analysis (2026)
Guest Profile Summary for Lerma
- The typical guest profile for Airbnb in Lerma consists of primarily domestic travelers (89%), often arriving from nearby Mexico City, typically belonging to the Post-2000s (Gen Z/Alpha) group (50%), primarily speaking Spanish or English.
- Domestic travelers account for 89.3% of guests.
- Key international markets include Mexico (89.3%) and Spain (7.1%).
- Top languages spoken are Spanish (63.2%) followed by English (36.8%).
- A significant demographic segment is the Post-2000s (Gen Z/Alpha) group, representing 50% of guests.
Recommendations for Hosts
- Target domestic marketing efforts towards travelers from Mexico City and Guadalajara.
- Tailor amenities and listing descriptions to appeal to the dominant Post-2000s (Gen Z/Alpha) demographic (e.g., highlight fast WiFi, smart home features, local guides).
- Highlight unique local experiences or amenities relevant to the primary guest profile.
- Consider seasonal promotions aligned with peak travel times for key origin markets.
Nearby Short-Term Rental Market Comparison
How does the Lerma Airbnb market stack up against its neighbors? Compare key performance metrics like average monthly revenue, ADR, and occupancy rates in surrounding areas to understand the broader regional STR landscape.
| Market | Active Properties | Monthly Revenue | Daily Rate | Avg. Occupancy |
|---|---|---|---|---|
| El Santuario | 44 | $2,651 | $417.54 | 25% |
| Tepeji del Rio de Ocampo | 10 | $2,458 | $328.78 | 29% |
| Cerro Gordo | 41 | $2,231 | $432.57 | 22% |
| Xalmolonco | 24 | $1,952 | $279.88 | 29% |
| Avandaro | 217 | $1,944 | $413.79 | 24% |
| Yautepec de Zaragoza | 17 | $1,896 | $250.74 | 26% |
| Alcocer | 11 | $1,857 | $276.85 | 28% |
| Rancho San Diego | 21 | $1,818 | $274.62 | 26% |
| La Ladrillera | 28 | $1,740 | $276.03 | 28% |
| Lomas de Cocoyoc | 140 | $1,674 | $257.78 | 28% |