La Guadalupe Airbnb Market Analysis 2026: Short Term Rental Data & Vacation Rental Statistics in Veracruz, Mexico
Is Airbnb profitable in La Guadalupe in 2026? Explore comprehensive Airbnb analytics for La Guadalupe, Veracruz, Mexico to uncover income potential. This 2026 STR market report for La Guadalupe, based on AirROI data from February 2025 to January 2026, reveals key trends in the niche market of 19 active listings.
Whether you're considering an Airbnb investment in La Guadalupe, optimizing your existing vacation rental, or exploring rental arbitrage opportunities, understanding the La Guadalupe Airbnb data is crucial. Leveraging the low regulation environment is key to maximizing your short term rental income potential. Let's dive into the specifics.
Key La Guadalupe Airbnb Performance Metrics Overview
Monthly Airbnb Revenue Variations & Income Potential in La Guadalupe (2026)
Understanding the monthly revenue variations for Airbnb listings in La Guadalupe is key to maximizing your short term rental income potential. Seasonality significantly impacts earnings. Our analysis, based on data from the past 12 months, shows that the peak revenue month for STRs in La Guadalupe is typically August, while January often presents the lowest earnings, highlighting opportunities for strategic pricing adjustments during shoulder and low seasons. Explore the typical Airbnb income in La Guadalupe across different performance tiers:
- Best-in-class properties (Top 10%) achieve $5,376+ monthly, often utilizing dynamic pricing and superior guest experiences.
- Strong performing properties (Top 25%) earn $3,185 or more, indicating effective management and desirable locations/amenities.
- Typical properties (Median) generate around $1,531 per month, representing the average market performance.
- Entry-level properties (Bottom 25%) see earnings around $622, often with potential for optimization.
Average Monthly Airbnb Earnings Trend in La Guadalupe
La Guadalupe Airbnb Occupancy Rate Trends (2026)
Maximize your bookings by understanding the La Guadalupe STR occupancy trends. Seasonal demand shifts significantly influence how often properties are booked. Typically, Augustsees the highest demand (peak season occupancy), while January experiences the lowest (low season). Effective strategies, like adjusting minimum stays or offering promotions, can boost occupancy during slower periods. Here's how different property tiers perform in La Guadalupe:
- Best-in-class properties (Top 10%) achieve 54%+ occupancy, indicating high desirability and potentially optimized availability.
- Strong performing properties (Top 25%) maintain 43% or higher occupancy, suggesting good market fit and guest satisfaction.
- Typical properties (Median) have an occupancy rate around 29%.
- Entry-level properties (Bottom 25%) average 20% occupancy, potentially facing higher vacancy.
Average Monthly Occupancy Rate Trend in La Guadalupe
Average Daily Rate (ADR) Airbnb Trends in La Guadalupe (2026)
Effective short term rental pricing strategy in La Guadalupe involves understanding monthly ADR fluctuations. The Average Daily Rate (ADR) for Airbnb in La Guadalupe typically peaks in December and dips lowest during March. Leveraging Airbnb dynamic pricing tools or strategies based on this seasonality can significantly boost revenue. Here's a look at the typical nightly rates achieved:
- Best-in-class properties (Top 10%) command rates of $397+ per night, often due to premium features or locations.
- Strong performing properties (Top 25%) achieve nightly rates of $276 or more.
- Typical properties (Median) charge around $191 per night.
- Entry-level properties (Bottom 25%) earn around $95 per night.
Average Daily Rate (ADR) Trend by Month in La Guadalupe
Get Live La Guadalupe Market Intelligence 👇

Explore Real-time Analytics
Airbnb Seasonality Analysis & Trends in La Guadalupe (2026)
Peak Season (August, July, April)
- Revenue averages $3,473 per month
- Occupancy rates average 50.7%
- Daily rates average $192
Shoulder Season
- Revenue averages $2,001 per month
- Occupancy maintains around 29.9%
- Daily rates hold near $206
Low Season (January, February, October)
- Revenue drops to average $1,348 per month
- Occupancy decreases to average 19.7%
- Daily rates adjust to average $215
Seasonality Insights for La Guadalupe
- The Airbnb seasonality in La Guadalupe shows highly seasonal trends requiring careful strategy. While the sections above show seasonal averages, it's also insightful to look at the extremes:
- During the high season, the absolute peak month showcases La Guadalupe's highest earning potential, with monthly revenues capable of climbing to $3,815, occupancy reaching a high of 54.0%, and ADRs peaking at $238.
- Conversely, the slowest single month of the year, typically falling within the low season, marks the market's lowest point. In this month, revenue might dip to $1,109, occupancy could drop to 16.0%, and ADRs may adjust down to $179.
- Understanding both the seasonal averages and these monthly peaks and troughs in revenue, occupancy, and ADR is crucial for maximizing your Airbnb profit potential in La Guadalupe.
Seasonal Strategies for Maximizing Profit
- Peak Season: Maximize revenue through premium pricing and potentially longer minimum stays. Ensure high availability.
- Low Season: Offer competitive pricing, special promotions (e.g., extended stay discounts), and flexible cancellation policies. Target off-season travelers like remote workers or budget-conscious guests.
- Shoulder Seasons: Implement dynamic pricing that balances peak and low rates. Target weekend travelers or specific events. Offer slightly more flexible terms than peak season.
- Regularly analyze your own performance against these La Guadalupe seasonality benchmarks and adjust your pricing and availability strategy accordingly.
Best Areas for Airbnb Investment in La Guadalupe (2026)
Exploring the top neighborhoods for short-term rentals in La Guadalupe? This section highlights key areas, outlining why they are attractive for hosts and guests, along with notable local attractions. Consider these locations based on your target guest profile and investment strategy.
| Neighborhood / Area | Why Host Here? (Target Guests & Appeal) | Key Attractions & Landmarks |
|---|---|---|
| Centro Histórico | The historic center of Veracruz, known for its colonial architecture, rich history, and cultural significance. It's a vibrant area with many attractions, making it ideal for tourists. | Zócalo de Veracruz, Fuerte de San Juan de Ulúa, Museo Naval, Baluarte de Santiago, Casa de la Cultura |
| Boca del Río | A popular coastal area known for its beaches and resorts. Ideal for vacationers seeking a relaxing stay by the sea with numerous dining and entertainment options. | Playa Mocambo, World Trade Center Veracruz, Plaza Las Américas, Parque Ecológico, Aquarium of Veracruz |
| Veracruz Puerto | The bustling port area that attracts both business travelers and tourists. It's a hub of activity with a lively atmosphere and numerous seafood restaurants. | Malecon de Veracruz, Mercado de Pino Suarez, Museo de la Ciudad, Aquarium of Veracruz, Catedral de Veracruz |
| Las Americas | A modern neighborhood with newer developments and amenities. This area caters to families and tourists seeking a comfortable and safe environment. | Plaza Las Americas, Parque Cultural, Centro Comercial La Isla, Cinemex, Deportivo Veracruz |
| El Castillo | Known for its views and historic castle. This area attracts visitors interested in history and stunning vistas of the Gulf of Mexico. | Castillo de San Juan de Ulúa, Museo Histórico Naval, Playa de la Armada, Parque Malecón, Fuerte de San Carlos |
| Ángeles | A residential area that offers a more local experience, with authentic cuisine and a close-knit community feel. Great for those looking to explore local culture. | Parque de los Niños, Centro Comercial Plaza Crystal, Templo de Santa María, Cafés y restaurantes locales |
| North Veracruz | A growing area with new hotels and restaurants, perfect for visitors who prefer a quieter environment away from the hustle and bustle. | Laguna de Mandinga, Museo de Cespedes, Parque Ecológico Tevisto, Próceres |
| La Boca | A picturesque location at the confluence of rivers and the sea, known for its stunning views and traditional fishing villages. Ideal for eco-tourism and nature lovers. | Playa La Boca, Boca de Río, Centro de Ecoturismo, Restaurantes de mariscos |
Understanding Airbnb License Requirements & STR Laws in La Guadalupe (2026)
While La Guadalupe, Veracruz, Mexico currently shows low STR regulations, specific Airbnb license requirements might still exist or change. Always verify the latest short term rental regulations and Airbnb license requirements directly with local government authorities for La Guadalupe to ensure full compliance before hosting.
(Source: AirROI data, 2026, based on 5% licensed listings)
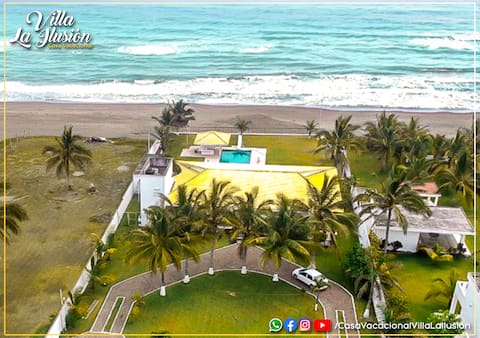
Top Performing Airbnb Properties in La Guadalupe (2026)
Benchmark your potential! Explore examples of top-performing Airbnb properties in La Guadalupebased on Trailing Twelve Month (TTM) revenue. Analyze their characteristics, revenue, occupancy rate, and ADR to understand what drives success in this market.
The best vacation home in Costa Esmeralda
Entire Place • 3 bedrooms

Casa Tecolutla, Costa Esmeralda (El Coquí)
Entire Place • 5 bedrooms

Casa AguaLuna pool and Costa Esmeralda beach
Entire Place • 4 bedrooms

Oceanfront house with private pool
Entire Place • 3 bedrooms

Don Luis Vacation Home
Entire Place • 3 bedrooms

Villa Encanto Coastal
Entire Place • 4 bedrooms
Note: Performance varies based on location, size, amenities, seasonality, and management quality. Data reflects the past 12 months.
Top Performing Airbnb Hosts in La Guadalupe (2026)
Learn from the best! This table showcases top-performing Airbnb hosts in La Guadalupe based on the number of properties managed and estimated total revenue over the past year. Analyze their scale and performance metrics.
| Host Name | Properties | Grossing Revenue | Stay Reviews | Avg Rating |
|---|---|---|---|---|
| Villa La Ilusión Kayam | 1 | $70,820 | 41 | 4.71/5.0 |
| Rosario | 1 | $57,579 | 129 | 4.73/5.0 |
| Alexandra | 2 | $53,434 | 48 | 4.90/5.0 |
| Jose Luis | 1 | $48,568 | 53 | 4.96/5.0 |
| Luis Manuel | 1 | $36,081 | 16 | 5.00/5.0 |
| America | 1 | $27,045 | 28 | 4.79/5.0 |
| Alfredo | 1 | $18,620 | 19 | 4.32/5.0 |
| Carlos | 1 | $17,982 | 209 | 4.84/5.0 |
| Enrique | 1 | $16,014 | 226 | 4.77/5.0 |
| David | 1 | $15,844 | 88 | 4.70/5.0 |
Analyzing the strategies of top hosts, such as their property selection, pricing, and guest communication, can offer valuable lessons for optimizing your own Airbnb operations in La Guadalupe.
Dive Deeper: Advanced La Guadalupe STR Market Data (2026)
Ready to unlock more insights? AirROI provides access to advanced metrics and comprehensive Airbnb data for La Guadalupe. Explore detailed analytics beyond this report to refine your investment strategy, optimize pricing, and maximize your vacation rental profits.
Explore Advanced MetricsLa Guadalupe Short-Term Rental Market Composition (2026): Property & Room Types
Room Type Distribution
Property Type Distribution
Market Composition Insights for La Guadalupe
- The La Guadalupe Airbnb market composition is heavily skewed towards Entire Home/Apt listings, which make up 78.9% of the 19 active rentals. This indicates strong guest preference for privacy and space.
- Looking at the property type distribution in La Guadalupe, House properties are the most common (89.5%), reflecting the local real estate landscape.
- Houses represent a significant 89.5% portion, catering likely to families or larger groups.
- The presence of 5.3% Hotel/Boutique listings indicates integration with traditional hospitality.
La Guadalupe Airbnb Room Capacity Analysis (2026): Bedroom Distribution
Distribution of Listings by Number of Bedrooms
Room Capacity Insights for La Guadalupe
- The dominant room capacity in La Guadalupe is 3 bedrooms listings, making up 36.8% of the market. This suggests a strong demand for properties suitable for families or small groups.
- Together, 3 bedrooms and 2 bedrooms properties represent 57.9% of the active Airbnb listings in La Guadalupe, indicating a high concentration in these sizes.
- A significant 52.6% of listings offer 3+ bedrooms, catering to larger groups and families seeking more space in La Guadalupe.
La Guadalupe Vacation Rental Guest Capacity Trends (2026)
Distribution of Listings by Guest Capacity
Guest Capacity Insights for La Guadalupe
- The most common guest capacity trend in La Guadalupe vacation rentals is listings accommodating 8+ guests (57.9%). This suggests the primary traveler segment is likely larger groups.
- Properties designed for 8+ guests and 6 guests dominate the La Guadalupe STR market, accounting for 73.7% of listings.
- 79.0% of properties accommodate 6+ guests, serving the market segment for larger families or group travel in La Guadalupe.
- On average, properties in La Guadalupe are equipped to host 6.4 guests.
La Guadalupe Airbnb Booking Patterns (2026): Available vs. Booked Days
Available Days Distribution
Booked Days Distribution
Booking Pattern Insights for La Guadalupe
- The most common availability pattern in La Guadalupe falls within the 181-270 days range, representing 47.4% of listings. This suggests many properties have significant open periods on their calendars.
- Approximately 94.8% of listings show high availability (181+ days open annually), indicating potential for increased bookings or specific owner usage patterns.
- For booked days, the 91-180 days range is most frequent in La Guadalupe (47.4%), reflecting common guest stay durations or potential owner blocking patterns.
- A notable 5.3% of properties secure long booking periods (181+ days booked per year), highlighting successful long-term rental strategies or significant owner usage.
La Guadalupe Airbnb Minimum Stay Requirements Analysis
Distribution of Listings by Minimum Night Requirement
1 Night
11 listings
57.9% of total
2 Nights
5 listings
26.3% of total
30+ Nights
3 listings
15.8% of total
Key Insights
- The most prevalent minimum stay requirement in La Guadalupe is 1 Night, adopted by 57.9% of listings. This highlights the market's preference for shorter, flexible bookings.
- A strong majority (84.2%) of the La Guadalupe Airbnb data shows acceptance of very short stays (1-2 nights), indicating a dynamic, high-turnover market.
- A significant segment (15.8%) caters to monthly stays (30+ nights) in La Guadalupe, pointing to opportunities in the extended-stay market.
Recommendations
- Align with the market by considering a 1 Night minimum stay, as 57.9% of La Guadalupe hosts use this setting.
- Explore offering discounts for stays of 30+ nights to attract the 15.8% of the market seeking extended stays.
- Adjust minimum nights based on seasonality – potentially shorter during low season and longer during peak demand periods in La Guadalupe.
La Guadalupe Airbnb Cancellation Policy Trends Analysis (2026)
Flexible
9 listings
47.4% of total
Moderate
2 listings
10.5% of total
Firm
7 listings
36.8% of total
Strict
1 listings
5.3% of total
Cancellation Policy Insights for La Guadalupe
- The prevailing Airbnb cancellation policy trend in La Guadalupe is Flexible, used by 47.4% of listings.
- There's a relatively balanced mix between guest-friendly (57.9%) and stricter (42.1%) policies, offering choices for different guest needs.
- Strict cancellation policies are quite rare (5.3%), potentially making listings with this policy less competitive unless justified by high demand or property type.
Recommendations for Hosts
- Consider adopting a Flexible policy to align with the 47.4% market standard in La Guadalupe.
- Using a Strict policy might deter some guests, as only 5.3% of listings use it. Evaluate if potential revenue protection outweighs possible lower booking rates.
- Regularly review your cancellation policy against competitors and market demand shifts in La Guadalupe.
La Guadalupe STR Booking Lead Time Analysis (2026)
Average Booking Lead Time by Month
Booking Lead Time Insights for La Guadalupe
- The overall average booking lead time for vacation rentals in La Guadalupe is 28 days.
- Guests book furthest in advance for stays during December (average 60 days), likely coinciding with peak travel demand or local events.
- The shortest booking windows occur for stays in February (average 11 days), indicating more last-minute travel plans during this time.
- Seasonally, Winter (35 days avg.) sees the longest lead times, while Spring (25 days avg.) has the shortest, reflecting typical travel planning cycles.
Recommendations for Hosts
- Use the overall average lead time (28 days) as a baseline for your pricing and availability strategy in La Guadalupe.
- For December stays, consider implementing length-of-stay discounts or slightly higher rates for bookings made less than 60 days out to capitalize on advance planning.
- During February, focus on last-minute booking availability and promotions, as guests book with very short notice (11 days avg.).
- Target marketing efforts for the Winter season well in advance (at least 35 days) to capture early planners.
- Monitor your own booking lead times against these La Guadalupe averages to identify opportunities for dynamic pricing adjustments.
Popular & Essential Airbnb Amenities in La Guadalupe (2026)
Amenity Prevalence
Amenity Insights for La Guadalupe
- Popular amenities like Free parking on premises, Wifi, Air conditioning are common but not universal. Offering these can provide a competitive edge.
- A pool is a highly desired but not standard amenity, making it a key feature for attracting guests seeking leisure in La Guadalupe.
- Warning: Wifi is not universally provided but is considered essential globally. Ensure reliable Wifi is offered.
Recommendations for Hosts
- Consider adding popular differentiators like Free parking on premises or Wifi to increase appeal.
- Highlight unique or less common amenities you offer (e.g., hot tub, dedicated workspace, EV charger) in your listing description and photos.
- Regularly check competitor amenities in La Guadalupe to stay competitive.
La Guadalupe Airbnb Guest Demographics & Profile Analysis (2026)
Guest Profile Summary for La Guadalupe
- The typical guest profile for Airbnb in La Guadalupe consists of primarily domestic travelers (94%), often arriving from nearby Mexico City, typically belonging to the Post-2000s (Gen Z/Alpha) group (50%), primarily speaking Spanish or English.
- Domestic travelers account for 94.4% of guests.
- Key international markets include Mexico (94.4%) and United States (3.3%).
- Top languages spoken are Spanish (54.4%) followed by English (30.9%).
- A significant demographic segment is the Post-2000s (Gen Z/Alpha) group, representing 50% of guests.
Recommendations for Hosts
- Target domestic marketing efforts towards travelers from Mexico City and Santiago de Querétaro.
- Tailor amenities and listing descriptions to appeal to the dominant Post-2000s (Gen Z/Alpha) demographic (e.g., highlight fast WiFi, smart home features, local guides).
- Highlight unique local experiences or amenities relevant to the primary guest profile.
- Consider seasonal promotions aligned with peak travel times for key origin markets.
Nearby Short-Term Rental Market Comparison
How does the La Guadalupe Airbnb market stack up against its neighbors? Compare key performance metrics like average monthly revenue, ADR, and occupancy rates in surrounding areas to understand the broader regional STR landscape.
| Market | Active Properties | Monthly Revenue | Daily Rate | Avg. Occupancy |
|---|---|---|---|---|
| Costa Esmeralda | 18 | $1,183 | $182.50 | 26% |
| Monte Gordo | 29 | $1,065 | $166.24 | 24% |
| Playa de Chachalacas | 70 | $1,064 | $158.49 | 26% |
| Terrenos del Lote "La Isla" | 39 | $990 | $139.28 | 24% |
| Jalcomulco | 26 | $793 | $110.40 | 24% |
| Mandinga y Matoza | 52 | $757 | $113.41 | 29% |
| Veracruz | 283 | $735 | $93.45 | 33% |
| Tecolutla | 110 | $709 | $112.07 | 23% |
| Boca del Río | 624 | $708 | $88.52 | 34% |
| Casitas | 30 | $700 | $186.29 | 18% |