Tlaltenango de Sánchez Román Airbnb Market Analysis 2026: Short Term Rental Data & Vacation Rental Statistics in Zacatecas, Mexico
Is Airbnb profitable in Tlaltenango de Sánchez Román in 2026? Explore comprehensive Airbnb analytics for Tlaltenango de Sánchez Román, Zacatecas, Mexico to uncover income potential. This 2026 STR market report for Tlaltenango de Sánchez Román, based on AirROI data from February 2025 to January 2026, reveals key trends in the niche market of 34 active listings.
Whether you're considering an Airbnb investment in Tlaltenango de Sánchez Román, optimizing your existing vacation rental, or exploring rental arbitrage opportunities, understanding the Tlaltenango de Sánchez Román Airbnb data is crucial. Leveraging the low regulation environment is key to maximizing your short term rental income potential. Let's dive into the specifics.
Key Tlaltenango de Sánchez Román Airbnb Performance Metrics Overview
Monthly Airbnb Revenue Variations & Income Potential in Tlaltenango de Sánchez Román (2026)
Understanding the monthly revenue variations for Airbnb listings in Tlaltenango de Sánchez Román is key to maximizing your short term rental income potential. Seasonality significantly impacts earnings. Our analysis, based on data from the past 12 months, shows that the peak revenue month for STRs in Tlaltenango de Sánchez Román is typically December, while February often presents the lowest earnings, highlighting opportunities for strategic pricing adjustments during shoulder and low seasons. Explore the typical Airbnb income in Tlaltenango de Sánchez Román across different performance tiers:
- Best-in-class properties (Top 10%) achieve $712+ monthly, often utilizing dynamic pricing and superior guest experiences.
- Strong performing properties (Top 25%) earn $449 or more, indicating effective management and desirable locations/amenities.
- Typical properties (Median) generate around $265 per month, representing the average market performance.
- Entry-level properties (Bottom 25%) see earnings around $165, often with potential for optimization.
Average Monthly Airbnb Earnings Trend in Tlaltenango de Sánchez Román
Tlaltenango de Sánchez Román Airbnb Occupancy Rate Trends (2026)
Maximize your bookings by understanding the Tlaltenango de Sánchez Román STR occupancy trends. Seasonal demand shifts significantly influence how often properties are booked. Typically, Julysees the highest demand (peak season occupancy), while January experiences the lowest (low season). Effective strategies, like adjusting minimum stays or offering promotions, can boost occupancy during slower periods. Here's how different property tiers perform in Tlaltenango de Sánchez Román:
- Best-in-class properties (Top 10%) achieve 48%+ occupancy, indicating high desirability and potentially optimized availability.
- Strong performing properties (Top 25%) maintain 29% or higher occupancy, suggesting good market fit and guest satisfaction.
- Typical properties (Median) have an occupancy rate around 20%.
- Entry-level properties (Bottom 25%) average 11% occupancy, potentially facing higher vacancy.
Average Monthly Occupancy Rate Trend in Tlaltenango de Sánchez Román
Average Daily Rate (ADR) Airbnb Trends in Tlaltenango de Sánchez Román (2026)
Effective short term rental pricing strategy in Tlaltenango de Sánchez Román involves understanding monthly ADR fluctuations. The Average Daily Rate (ADR) for Airbnb in Tlaltenango de Sánchez Román typically peaks in December and dips lowest during April. Leveraging Airbnb dynamic pricing tools or strategies based on this seasonality can significantly boost revenue. Here's a look at the typical nightly rates achieved:
- Best-in-class properties (Top 10%) command rates of $63+ per night, often due to premium features or locations.
- Strong performing properties (Top 25%) achieve nightly rates of $53 or more.
- Typical properties (Median) charge around $45 per night.
- Entry-level properties (Bottom 25%) earn around $36 per night.
Average Daily Rate (ADR) Trend by Month in Tlaltenango de Sánchez Román
Get Live Tlaltenango de Sánchez Román Market Intelligence 👇

Explore Real-time Analytics
Airbnb Seasonality Analysis & Trends in Tlaltenango de Sánchez Román (2026)
Peak Season (December, July, October)
- Revenue averages $577 per month
- Occupancy rates average 35.6%
- Daily rates average $52
Shoulder Season
- Revenue averages $295 per month
- Occupancy maintains around 20.1%
- Daily rates hold near $48
Low Season (February, June, August)
- Revenue drops to average $219 per month
- Occupancy decreases to average 17.2%
- Daily rates adjust to average $45
Seasonality Insights for Tlaltenango de Sánchez Rom�án
- The Airbnb seasonality in Tlaltenango de Sánchez Román shows highly seasonal trends requiring careful strategy. While the sections above show seasonal averages, it's also insightful to look at the extremes:
- During the high season, the absolute peak month showcases Tlaltenango de Sánchez Román's highest earning potential, with monthly revenues capable of climbing to $683, occupancy reaching a high of 42.4%, and ADRs peaking at $60.
- Conversely, the slowest single month of the year, typically falling within the low season, marks the market's lowest point. In this month, revenue might dip to $206, occupancy could drop to 14.7%, and ADRs may adjust down to $42.
- Understanding both the seasonal averages and these monthly peaks and troughs in revenue, occupancy, and ADR is crucial for maximizing your Airbnb profit potential in Tlaltenango de Sánchez Román.
Seasonal Strategies for Maximizing Profit
- Peak Season: Maximize revenue through premium pricing and potentially longer minimum stays. Ensure high availability.
- Low Season: Offer competitive pricing, special promotions (e.g., extended stay discounts), and flexible cancellation policies. Target off-season travelers like remote workers or budget-conscious guests.
- Shoulder Seasons: Implement dynamic pricing that balances peak and low rates. Target weekend travelers or specific events. Offer slightly more flexible terms than peak season.
- Regularly analyze your own performance against these Tlaltenango de Sánchez Román seasonality benchmarks and adjust your pricing and availability strategy accordingly.
Best Areas for Airbnb Investment in Tlaltenango de Sánchez Román (2026)
Exploring the top neighborhoods for short-term rentals in Tlaltenango de Sánchez Román? This section highlights key areas, outlining why they are attractive for hosts and guests, along with notable local attractions. Consider these locations based on your target guest profile and investment strategy.
| Neighborhood / Area | Why Host Here? (Target Guests & Appeal) | Key Attractions & Landmarks |
|---|---|---|
| Downtown Tlaltenango | Central area with access to local markets, shops, and restaurants. Popular among visitors exploring the local culture and cuisine. | Tlaltenango Market, Parroquia de San Juan Bautista, Callejón del Cuervo, Plaza de Armas, Eat Street |
| Natural Park of Tlaltenango | Scenic area popular for nature lovers and outdoor activities such as hiking and camping. Great for attracting eco-tourists. | Cerro de la Soledad, Hiking trails, Wildlife observation, Picnic areas, Scenic overlooks |
| Historic Center | Rich in history and architecture, this area attracts tourists interested in culture and heritage. Close to significant landmarks and museums. | Centro Histórico, Museo de Tlaltenango, Casa de la Cultura, Catedral de Tlaltenango, Old Town |
| Local Gastronomy Spots | Known for its traditional food and local cuisine, this area draws food enthusiasts and culinary tourists. | Tacos de Guisado, Local empanadas, Ritual Coffee, Tlaltenango Street Food, Gastronomy tours |
| Artisan Workshops | Offers a glimpse into local crafts and artisan goods, appealing to those looking for unique, handmade souvenirs. | Pottery workshops, Textile artisans, Local craft markets, Artisan fairs, Cultural workshops |
| Cultural Festivals | The area hosts several local festivals throughout the year, attracting visitors looking for vibrant cultural experiences. | Festival de Tlaltenango, Day of the Dead celebrations, Cultural Heritage week, Music festivals, Local fairs |
| Scenic Viewpoints | With various viewpoints around, this area is perfect for those looking for stunning photos and vistas, attracting photographers and nature lovers. | Mirador de Tlaltenango, Picturesque scenery, Sunset views, Photography spots, Nature trails |
| Relaxation and Wellness Retreats | Popular for relaxation seekers, offering wellness programs and retreats, which appeals to travelers looking to unwind. | Wellness centers, Spas and massage therapy, Yoga retreats, Rejuvenation programs, Nature therapy sessions |
Understanding Airbnb License Requirements & STR Laws in Tlaltenango de Sánchez Román (2026)
While Tlaltenango de Sánchez Román, Zacatecas, Mexico currently shows low STR regulations, specific Airbnb license requirements might still exist or change. Always verify the latest short term rental regulations and Airbnb license requirements directly with local government authorities for Tlaltenango de Sánchez Román to ensure full compliance before hosting.
(Source: AirROI data, 2026, finding no licensed listings among those analyzed)
Top Performing Airbnb Properties in Tlaltenango de Sánchez Román (2026)
Benchmark your potential! Explore examples of top-performing Airbnb properties in Tlaltenango de Sánchez Románbased on Trailing Twelve Month (TTM) revenue. Analyze their characteristics, revenue, occupancy rate, and ADR to understand what drives success in this market.

Amazing House 6 People
Entire Place • 3 bedrooms
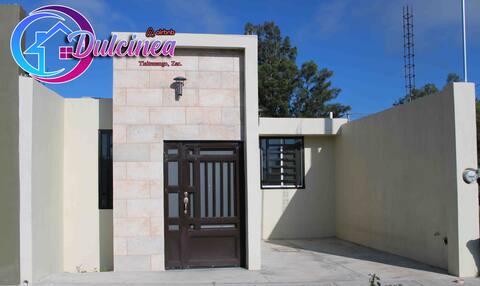
Airbnb Dulcinea
Entire Place • 3 bedrooms

8 People (2 apartments together) Centrally located nice Loft 1 2z
Entire Place • 4 bedrooms
Amazing House for 2 People
Entire Place • 1 bedroom
Amazing House for 4 People
Entire Place • 2 bedrooms

4 People Comfortable and Centrally-located Apartment with Kitchen
Entire Place • 2 bedrooms
Note: Performance varies based on location, size, amenities, seasonality, and management quality. Data reflects the past 12 months.
Top Performing Airbnb Hosts in Tlaltenango de Sánchez Román (2026)
Learn from the best! This table showcases top-performing Airbnb hosts in Tlaltenango de Sánchez Román based on the number of properties managed and estimated total revenue over the past year. Analyze their scale and performance metrics.
| Host Name | Properties | Grossing Revenue | Stay Reviews | Avg Rating |
|---|---|---|---|---|
| Alejandro | 19 | $72,639 | 268 | 4.86/5.0 |
| Miguel Angel | 1 | $7,122 | 25 | 4.96/5.0 |
| Susana A | 3 | $6,257 | 7 | 5.00/5.0 |
| Jorge | 1 | $4,226 | 8 | 4.88/5.0 |
| Mirko | 3 | $3,396 | 26 | 4.98/5.0 |
| Lalo | 5 | $2,000 | 29 | 4.66/5.0 |
| Alma | 2 | $972 | 20 | 4.66/5.0 |
Analyzing the strategies of top hosts, such as their property selection, pricing, and guest communication, can offer valuable lessons for optimizing your own Airbnb operations in Tlaltenango de Sánchez Román.
Dive Deeper: Advanced Tlaltenango de Sánchez Román STR Market Data (2026)
Ready to unlock more insights? AirROI provides access to advanced metrics and comprehensive Airbnb data for Tlaltenango de Sánchez Román. Explore detailed analytics beyond this report to refine your investment strategy, optimize pricing, and maximize your vacation rental profits.
Explore Advanced MetricsTlaltenango de Sánchez Román Short-Term Rental Market Composition (2026): Property & Room Types
Room Type Distribution
Property Type Distribution
Market Composition Insights for Tlaltenango de Sánchez Román
- The Tlaltenango de Sánchez Román Airbnb market composition is heavily skewed towards Entire Home/Apt listings, which make up 79.4% of the 34 active rentals. This indicates strong guest preference for privacy and space.
- Looking at the property type distribution in Tlaltenango de Sánchez Román, Apartment/Condo properties are the most common (73.5%), reflecting the local real estate landscape.
- The presence of 14.7% Hotel/Boutique listings indicates integration with traditional hospitality.
Tlaltenango de Sánchez Román Airbnb Room Capacity Analysis (2026): Bedroom Distribution
Distribution of Listings by Number of Bedrooms
Room Capacity Insights for Tlaltenango de Sánchez Román
- The dominant room capacity in Tlaltenango de Sánchez Román is 1 bedroom listings, making up 52.9% of the market. This suggests a strong demand for properties suitable for couples or solo travelers.
- Together, 1 bedroom and 2 bedrooms properties represent 88.2% of the active Airbnb listings in Tlaltenango de Sánchez Román, indicating a high concentration in these sizes.
- With over half the market (52.9%) consisting of studios or 1-bedroom units, Tlaltenango de Sánchez Román is particularly well-suited for individuals or couples.
Tlaltenango de Sánchez Román Vacation Rental Guest Capacity Trends (2026)
Distribution of Listings by Guest Capacity
Guest Capacity Insights for Tlaltenango de Sánchez Román
- The most common guest capacity trend in Tlaltenango de Sánchez Román vacation rentals is listings accommodating 2 guests (38.2%). This suggests the primary traveler segment is likely couples or solo travelers.
- Properties designed for 2 guests and 4 guests dominate the Tlaltenango de Sánchez Román STR market, accounting for 73.5% of listings.
- 14.7% of properties accommodate 6+ guests, serving the market segment for larger families or group travel in Tlaltenango de Sánchez Román.
- On average, properties in Tlaltenango de Sánchez Román are equipped to host 3.5 guests.
Tlaltenango de Sánchez Román Airbnb Booking Patterns (2026): Available vs. Booked Days
Available Days Distribution
Booked Days Distribution
Booking Pattern Insights for Tlaltenango de Sánchez Román
- The most common availability pattern in Tlaltenango de Sánchez Román falls within the 271-366 days range, representing 82.4% of listings. This suggests many properties have significant open periods on their calendars.
- Approximately 100.0% of listings show high availability (181+ days open annually), indicating potential for increased bookings or specific owner usage patterns.
- For booked days, the 31-90 days range is most frequent in Tlaltenango de Sánchez Román (55.9%), reflecting common guest stay durations or potential owner blocking patterns.
Tlaltenango de Sánchez Román Airbnb Minimum Stay Requirements Analysis
Distribution of Listings by Minimum Night Requirement
1 Night
32 listings
94.1% of total
2 Nights
1 listings
2.9% of total
30+ Nights
1 listings
2.9% of total
Key Insights
- The most prevalent minimum stay requirement in Tlaltenango de Sánchez Román is 1 Night, adopted by 94.1% of listings. This highlights the market's preference for shorter, flexible bookings.
- A strong majority (97.0%) of the Tlaltenango de Sánchez Román Airbnb data shows acceptance of very short stays (1-2 nights), indicating a dynamic, high-turnover market.
- Dedicated monthly rentals (30+ nights) represent a small niche (2.9%), possibly an untapped area for hosts.
Recommendations
- Align with the market by considering a 1 Night minimum stay, as 94.1% of Tlaltenango de Sánchez Román hosts use this setting.
- Adjust minimum nights based on seasonality – potentially shorter during low season and longer during peak demand periods in Tlaltenango de Sánchez Román.
Tlaltenango de Sánchez Román Airbnb Cancellation Policy Trends Analysis (2026)
Flexible
14 listings
41.2% of total
Moderate
12 listings
35.3% of total
Firm
3 listings
8.8% of total
Strict
5 listings
14.7% of total
Cancellation Policy Insights for Tlaltenango de Sánchez Román
- The prevailing Airbnb cancellation policy trend in Tlaltenango de Sánchez Román is Flexible, used by 41.2% of listings.
- The market strongly favors guest-friendly terms, with 76.5% of listings offering Flexible or Moderate policies. This suggests guests in Tlaltenango de Sánchez Román may expect booking flexibility.
Recommendations for Hosts
- Consider adopting a Flexible policy to align with the 41.2% market standard in Tlaltenango de Sánchez Román.
- Using a Strict policy might deter some guests, as only 14.7% of listings use it. Evaluate if potential revenue protection outweighs possible lower booking rates.
- Regularly review your cancellation policy against competitors and market demand shifts in Tlaltenango de Sánchez Román.
Tlaltenango de Sánchez Román STR Booking Lead Time Analysis (2026)
Average Booking Lead Time by Month
Booking Lead Time Insights for Tlaltenango de Sánchez Román
- The overall average booking lead time for vacation rentals in Tlaltenango de Sánchez Román is 27 days.
- Guests book furthest in advance for stays during April (average 49 days), likely coinciding with peak travel demand or local events.
- The shortest booking windows occur for stays in February (average 8 days), indicating more last-minute travel plans during this time.
- Seasonally, Winter (30 days avg.) sees the longest lead times, while Summer (22 days avg.) has the shortest, reflecting typical travel planning cycles.
Recommendations for Hosts
- Use the overall average lead time (27 days) as a baseline for your pricing and availability strategy in Tlaltenango de Sánchez Román.
- For April stays, consider implementing length-of-stay discounts or slightly higher rates for bookings made less than 49 days out to capitalize on advance planning.
- During February, focus on last-minute booking availability and promotions, as guests book with very short notice (8 days avg.).
- Target marketing efforts for the Winter season well in advance (at least 30 days) to capture early planners.
- Monitor your own booking lead times against these Tlaltenango de Sánchez Román averages to identify opportunities for dynamic pricing adjustments.
Popular & Essential Airbnb Amenities in Tlaltenango de Sánchez Román (2026)
Amenity Prevalence
Amenity Insights for Tlaltenango de Sánchez Román
- Essential amenities in Tlaltenango de Sánchez Román that guests expect include: Wifi. Lacking these (this) could significantly impact bookings.
- Popular amenities like Hot water, Shampoo, Carbon monoxide alarm are common but not universal. Offering these can provide a competitive edge.
Recommendations for Hosts
- Ensure your listing includes all essential amenities for Tlaltenango de Sánchez Román: Wifi.
- Prioritize adding missing essentials: Wifi.
- Consider adding popular differentiators like Hot water or Shampoo to increase appeal.
- Highlight unique or less common amenities you offer (e.g., hot tub, dedicated workspace, EV charger) in your listing description and photos.
- Regularly check competitor amenities in Tlaltenango de Sánchez Román to stay competitive.
Tlaltenango de Sánchez Román Airbnb Guest Demographics & Profile Analysis (2026)
Guest Profile Summary for Tlaltenango de Sánchez Román
- The typical guest profile for Airbnb in Tlaltenango de Sánchez Román consists of primarily domestic travelers (67%), often arriving from nearby Zapopan, typically belonging to the Post-2000s (Gen Z/Alpha) group (50%), primarily speaking Spanish or English.
- Domestic travelers account for 66.7% of guests.
- Key international markets include Mexico (66.7%) and United States (33.3%).
- Top languages spoken are Spanish (67.4%) followed by English (30.2%).
- A significant demographic segment is the Post-2000s (Gen Z/Alpha) group, representing 50% of guests.
Recommendations for Hosts
- Target domestic marketing efforts towards travelers from Zapopan and Guadalajara.
- Tailor amenities and listing descriptions to appeal to the dominant Post-2000s (Gen Z/Alpha) demographic (e.g., highlight fast WiFi, smart home features, local guides).
- Highlight unique local experiences or amenities relevant to the primary guest profile.
- Consider seasonal promotions aligned with peak travel times for key origin markets.
Nearby Short-Term Rental Market Comparison
How does the Tlaltenango de Sánchez Román Airbnb market stack up against its neighbors? Compare key performance metrics like average monthly revenue, ADR, and occupancy rates in surrounding areas to understand the broader regional STR landscape.
| Market | Active Properties | Monthly Revenue | Daily Rate | Avg. Occupancy |
|---|---|---|---|---|
| San Juan Cosalá | 97 | $2,085 | $259.66 | 29% |
| La Calera | 25 | $1,725 | $227.68 | 29% |
| San Pedro Tesistán | 13 | $1,669 | $306.69 | 25% |
| Cajititlán | 27 | $1,663 | $216.62 | 26% |
| San Miguel | 36 | $1,487 | $280.59 | 20% |
| La Laguna | 33 | $1,240 | $178.33 | 26% |
| Santa María del Oro | 45 | $1,121 | $183.55 | 19% |
| San Luis Soyatlán | 21 | $1,120 | $184.09 | 22% |
| Ixtlahuacán de los Membrillos | 38 | $1,089 | $195.63 | 25% |
| San Nicolás de Ibarra | 11 | $1,062 | $188.84 | 29% |