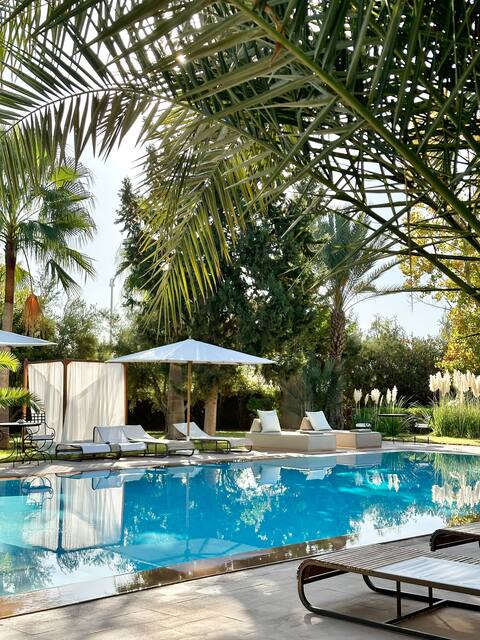
Al Ouidane Airbnb Market Analysis 2026: Short Term Rental Data & Vacation Rental Statistics in Marrakech-Safi, Morocco
Is Airbnb profitable in Al Ouidane in 2026? Explore comprehensive Airbnb analytics for Al Ouidane, Marrakech-Safi, Morocco to uncover income potential. This 2026 STR market report for Al Ouidane, based on AirROI data from February 2025 to January 2026, reveals key trends in the market of 291 active listings.
Whether you're considering an Airbnb investment in Al Ouidane, optimizing your existing vacation rental, or exploring rental arbitrage opportunities, understanding the Al Ouidane Airbnb data is crucial. Leveraging the low regulation environment is key to maximizing your short term rental income potential. Let's dive into the specifics.
Key Al Ouidane Airbnb Performance Metrics Overview
Monthly Airbnb Revenue Variations & Income Potential in Al Ouidane (2026)
Understanding the monthly revenue variations for Airbnb listings in Al Ouidane is key to maximizing your short term rental income potential. Seasonality significantly impacts earnings. Our analysis, based on data from the past 12 months, shows that the peak revenue month for STRs in Al Ouidane is typically August, while January often presents the lowest earnings, highlighting opportunities for strategic pricing adjustments during shoulder and low seasons. Explore the typical Airbnb income in Al Ouidane across different performance tiers:
- Best-in-class properties (Top 10%) achieve $12,936+ monthly, often utilizing dynamic pricing and superior guest experiences.
- Strong performing properties (Top 25%) earn $8,375 or more, indicating effective management and desirable locations/amenities.
- Typical properties (Median) generate around $4,919 per month, representing the average market performance.
- Entry-level properties (Bottom 25%) see earnings around $2,438, often with potential for optimization.
Average Monthly Airbnb Earnings Trend in Al Ouidane
Al Ouidane Airbnb Occupancy Rate Trends (2026)
Maximize your bookings by understanding the Al Ouidane STR occupancy trends. Seasonal demand shifts significantly influence how often properties are booked. Typically, Augustsees the highest demand (peak season occupancy), while January experiences the lowest (low season). Effective strategies, like adjusting minimum stays or offering promotions, can boost occupancy during slower periods. Here's how different property tiers perform in Al Ouidane:
- Best-in-class properties (Top 10%) achieve 76%+ occupancy, indicating high desirability and potentially optimized availability.
- Strong performing properties (Top 25%) maintain 60% or higher occupancy, suggesting good market fit and guest satisfaction.
- Typical properties (Median) have an occupancy rate around 39%.
- Entry-level properties (Bottom 25%) average 21% occupancy, potentially facing higher vacancy.
Average Monthly Occupancy Rate Trend in Al Ouidane
Average Daily Rate (ADR) Airbnb Trends in Al Ouidane (2026)
Effective short term rental pricing strategy in Al Ouidane involves understanding monthly ADR fluctuations. The Average Daily Rate (ADR) for Airbnb in Al Ouidane typically peaks in August and dips lowest during March. Leveraging Airbnb dynamic pricing tools or strategies based on this seasonality can significantly boost revenue. Here's a look at the typical nightly rates achieved:
- Best-in-class properties (Top 10%) command rates of $931+ per night, often due to premium features or locations.
- Strong performing properties (Top 25%) achieve nightly rates of $578 or more.
- Typical properties (Median) charge around $388 per night.
- Entry-level properties (Bottom 25%) earn around $290 per night.
Average Daily Rate (ADR) Trend by Month in Al Ouidane
Get Live Al Ouidane Market Intelligence 👇

Explore Real-time Analytics
Airbnb Seasonality Analysis & Trends in Al Ouidane (2026)
Peak Season (August, July, April)
- Revenue averages $8,227 per month
- Occupancy rates average 54.5%
- Daily rates average $503
Shoulder Season
- Revenue averages $6,222 per month
- Occupancy maintains around 41.8%
- Daily rates hold near $482
Low Season (January, November, December)
- Revenue drops to average $4,585 per month
- Occupancy decreases to average 27.2%
- Daily rates adjust to average $505
Seasonality Insights for Al Ouidane
- The Airbnb seasonality in Al Ouidane shows highly seasonal trends requiring careful strategy. While the sections above show seasonal averages, it's also insightful to look at the extremes:
- During the high season, the absolute peak month showcases Al Ouidane's highest earning potential, with monthly revenues capable of climbing to $9,231, occupancy reaching a high of 58.0%, and ADRs peaking at $525.
- Conversely, the slowest single month of the year, typically falling within the low season, marks the market's lowest point. In this month, revenue might dip to $3,723, occupancy could drop to 23.5%, and ADRs may adjust down to $449.
- Understanding both the seasonal averages and these monthly peaks and troughs in revenue, occupancy, and ADR is crucial for maximizing your Airbnb profit potential in Al Ouidane.
Seasonal Strategies for Maximizing Profit
- Peak Season: Maximize revenue through premium pricing and potentially longer minimum stays. Ensure high availability.
- Low Season: Offer competitive pricing, special promotions (e.g., extended stay discounts), and flexible cancellation policies. Target off-season travelers like remote workers or budget-conscious guests.
- Shoulder Seasons: Implement dynamic pricing that balances peak and low rates. Target weekend travelers or specific events. Offer slightly more flexible terms than peak season.
- Regularly analyze your own performance against these Al Ouidane seasonality benchmarks and adjust your pricing and availability strategy accordingly.
Best Areas for Airbnb Investment in Al Ouidane (2026)
Exploring the top neighborhoods for short-term rentals in Al Ouidane? This section highlights key areas, outlining why they are attractive for hosts and guests, along with notable local attractions. Consider these locations based on your target guest profile and investment strategy.
| Neighborhood / Area | Why Host Here? (Target Guests & Appeal) | Key Attractions & Landmarks |
|---|---|---|
| Palmeraie | A luxurious oasis on the outskirts of Marrakech, known for its stunning palm groves, upscale villas, and tranquil atmosphere. Perfect for travelers seeking a peaceful retreat while being close to Marrakech's lively city center. | Jardin Majorelle, Palmeraie Golf Palace, Camel rides, Spa resorts, Traditional Moroccan riads |
| Medina | The historic heart of Marrakech, famous for its narrow winding streets, vibrant souks, and rich cultural heritage. It's ideal for tourists wanting an authentic Moroccan experience and proximity to key landmarks. | Koutoubia Mosque, Jemaa el-Fnaa, Saadian Tombs, Maison de la Photographie, Bahia Palace |
| Hivernage | A modern neighborhood that combines Moroccan architecture with contemporary amenities. It's lively and attracts a mix of tourists and locals looking for upscale dining and vibrant nightlife. | Luxury hotels, Restaurants and lounges, Marrakech Plaza, Casino de Marrakech, Royal Theatre |
| Gueliz | A modern district known for its trendy cafes, boutiques, and art galleries. It's popular among younger travelers and expats seeking a cosmopolitan vibe close to traditional elements. | Jardin Secret, Galerie Noir sur Blanc, Café de la Presse, Café des Épices, Dar el Bacha Museum |
| Agdal | A residential area known for its spacious parks and proximity to the Agdal Gardens. It’s family-friendly and caters to travelers looking for a quieter stay while being a short drive to the main attractions. | Agdal Gardens, Marrakech Royal Palace, Food markets, Cafes along Avenue Mohammed VI |
| Ouarzazate Road | A scenic route towards the Atlas Mountains, popular for adventure tourists and filmmakers. It offers stunning views and opportunities for outdoor activities in a unique setting. | Atlas Studios, Ait Benhaddou, Tizi n'Tichka pass, Kasbahs |
| La Palmeraie | Another luxurious area surrounded by palm trees, featuring large villas and resorts. This area is serene and provides a relaxing environment for guests looking for an escape from the city hustle. | Berber cultural experiences, Horse riding, Traditional Moroccan spas |
| Marrakech-Safi Coast | An emerging destination along the coast of the region, known for its beaches and surf spots. It's gaining popularity among domestic and international tourists looking for coastal experiences. | Beach resorts, Surf schools, Local seafood markets, Clifftop views |
Understanding Airbnb License Requirements & STR Laws in Al Ouidane (2026)
While Al Ouidane, Marrakech-Safi, Morocco currently shows low STR regulations, specific Airbnb license requirements might still exist or change. Always verify the latest short term rental regulations and Airbnb license requirements directly with local government authorities for Al Ouidane to ensure full compliance before hosting.
(Source: AirROI data, 2026, based on 2% licensed listings)
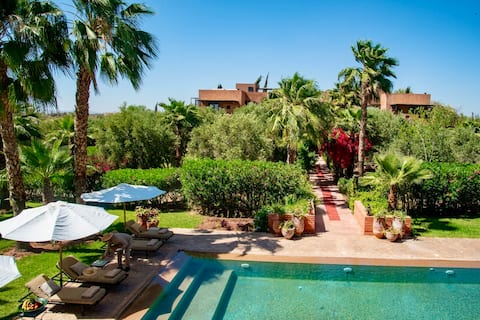
Top Performing Airbnb Properties in Al Ouidane (2026)
Benchmark your potential! Explore examples of top-performing Airbnb properties in Al Ouidanebased on Trailing Twelve Month (TTM) revenue. Analyze their characteristics, revenue, occupancy rate, and ADR to understand what drives success in this market.

Exclusive Villa - Chef & heated Pool
Entire Place • 6 bedrooms

Palais Lona
Entire Place • 10 bedrooms
Maggy Rose
Entire Place • 8 bedrooms

Ania
Entire Place • 8 bedrooms
Splendid Villa in Marrakech (in exclusivity)
Entire Place • 9 bedrooms

Villa Sophia Marrakech: Great for groups
Entire Place • 8 bedrooms
Note: Performance varies based on location, size, amenities, seasonality, and management quality. Data reflects the past 12 months.
Top Performing Airbnb Hosts in Al Ouidane (2026)
Learn from the best! This table showcases top-performing Airbnb hosts in Al Ouidane based on the number of properties managed and estimated total revenue over the past year. Analyze their scale and performance metrics.
| Host Name | Properties | Grossing Revenue | Stay Reviews | Avg Rating |
|---|---|---|---|---|
| Vincent De MARRENZA Marrakech | 24 | $1,631,574 | 633 | 4.82/5.0 |
| Palm Agency Marrakech | 15 | $986,744 | 709 | 4.85/5.0 |
| Philippe | 12 | $822,365 | 48 | 4.63/5.0 |
| Sarah | 2 | $380,731 | 64 | 5.00/5.0 |
| Karima | 1 | $378,829 | 27 | 5.00/5.0 |
| Jamila | 1 | $319,516 | 135 | 5.00/5.0 |
| The French Concierge | 2 | $228,583 | 88 | 4.90/5.0 |
| Rut | 1 | $220,338 | 108 | 4.92/5.0 |
| Sybille | 2 | $218,002 | 23 | 4.95/5.0 |
| Linda | 1 | $212,382 | 143 | 4.95/5.0 |
Analyzing the strategies of top hosts, such as their property selection, pricing, and guest communication, can offer valuable lessons for optimizing your own Airbnb operations in Al Ouidane.
Dive Deeper: Advanced Al Ouidane STR Market Data (2026)
Ready to unlock more insights? AirROI provides access to advanced metrics and comprehensive Airbnb data for Al Ouidane. Explore detailed analytics beyond this report to refine your investment strategy, optimize pricing, and maximize your vacation rental profits.
Explore Advanced MetricsAl Ouidane Short-Term Rental Market Composition (2026): Property & Room Types
Room Type Distribution
Property Type Distribution
Market Composition Insights for Al Ouidane
- The Al Ouidane Airbnb market composition is heavily skewed towards Entire Home/Apt listings, which make up 97.3% of the 291 active rentals. This indicates strong guest preference for privacy and space.
- Looking at the property type distribution in Al Ouidane, House properties are the most common (89%), reflecting the local real estate landscape.
- Houses represent a significant 89% portion, catering likely to families or larger groups.
- Smaller segments like apartment/condo, hotel/boutique, unique stays, outdoor/unique, others (combined 10.9%) offer potential for unique stay experiences.
Al Ouidane Airbnb Room Capacity Analysis (2026): Bedroom Distribution
Distribution of Listings by Number of Bedrooms
Room Capacity Insights for Al Ouidane
- The dominant room capacity in Al Ouidane is 5+ bedrooms listings, making up 33% of the market. This suggests a strong demand for properties suitable for families or small groups.
- Together, 5+ bedrooms and 4 bedrooms properties represent 64.6% of the active Airbnb listings in Al Ouidane, indicating a high concentration in these sizes.
- A significant 91.7% of listings offer 3+ bedrooms, catering to larger groups and families seeking more space in Al Ouidane.
Al Ouidane Vacation Rental Guest Capacity Trends (2026)
Distribution of Listings by Guest Capacity
Guest Capacity Insights for Al Ouidane
- The most common guest capacity trend in Al Ouidane vacation rentals is listings accommodating 8+ guests (66.7%). This suggests the primary traveler segment is likely larger groups.
- Properties designed for 8+ guests and 6 guests dominate the Al Ouidane STR market, accounting for 88.7% of listings.
- 92.1% of properties accommodate 6+ guests, serving the market segment for larger families or group travel in Al Ouidane.
- On average, properties in Al Ouidane are equipped to host 7.1 guests.
Al Ouidane Airbnb Booking Patterns (2026): Available vs. Booked Days
Available Days Distribution
Booked Days Distribution
Booking Pattern Insights for Al Ouidane
- The most common availability pattern in Al Ouidane falls within the 271-366 days range, representing 47.4% of listings. This suggests many properties have significant open periods on their calendars.
- Approximately 81.8% of listings show high availability (181+ days open annually), indicating potential for increased bookings or specific owner usage patterns.
- For booked days, the 91-180 days range is most frequent in Al Ouidane (34.7%), reflecting common guest stay durations or potential owner blocking patterns.
- A notable 18.9% of properties secure long booking periods (181+ days booked per year), highlighting successful long-term rental strategies or significant owner usage.
Al Ouidane Airbnb Minimum Stay Requirements Analysis
Distribution of Listings by Minimum Night Requirement
1 Night
31 listings
10.7% of total
2 Nights
47 listings
16.2% of total
3 Nights
42 listings
14.4% of total
4-6 Nights
8 listings
2.7% of total
7-29 Nights
2 listings
0.7% of total
30+ Nights
161 listings
55.3% of total
Key Insights
- The most prevalent minimum stay requirement in Al Ouidane is 30+ Nights, adopted by 55.3% of listings. This highlights the market's preference for longer commitments.
- A significant segment (55.3%) caters to monthly stays (30+ nights) in Al Ouidane, pointing to opportunities in the extended-stay market.
Recommendations
- Align with the market by considering a 30+ Nights minimum stay, as 55.3% of Al Ouidane hosts use this setting.
- If feasible, allowing 1-night stays, especially midweek or during low season, could capture last-minute bookings, as only 10.7% currently do.
- Explore offering discounts for stays of 30+ nights to attract the 55.3% of the market seeking extended stays.
- Adjust minimum nights based on seasonality – potentially shorter during low season and longer during peak demand periods in Al Ouidane.
Al Ouidane Airbnb Cancellation Policy Trends Analysis (2026)
Super Strict 60 Days
2 listings
0.7% of total
Limited
10 listings
3.5% of total
Super Strict 30 Days
14 listings
4.9% of total
Flexible
51 listings
17.7% of total
Moderate
51 listings
17.7% of total
Firm
97 listings
33.7% of total
Strict
63 listings
21.9% of total
Cancellation Policy Insights for Al Ouidane
- The prevailing Airbnb cancellation policy trend in Al Ouidane is Firm, used by 33.7% of listings.
- A majority (55.6%) of hosts in Al Ouidane utilize Firm or Strict policies, indicating a market where hosts prioritize booking security.
Recommendations for Hosts
- Consider adopting a Firm policy to align with the 33.7% market standard in Al Ouidane.
- Regularly review your cancellation policy against competitors and market demand shifts in Al Ouidane.
Al Ouidane STR Booking Lead Time Analysis (2026)
Average Booking Lead Time by Month
Booking Lead Time Insights for Al Ouidane
- The overall average booking lead time for vacation rentals in Al Ouidane is 60 days.
- Guests book furthest in advance for stays during October (average 82 days), likely coinciding with peak travel demand or local events.
- The shortest booking windows occur for stays in March (average 39 days), indicating more last-minute travel plans during this time.
- Seasonally, Fall (69 days avg.) sees the longest lead times, while Winter (55 days avg.) has the shortest, reflecting typical travel planning cycles.
Recommendations for Hosts
- Use the overall average lead time (60 days) as a baseline for your pricing and availability strategy in Al Ouidane.
- For October stays, consider implementing length-of-stay discounts or slightly higher rates for bookings made less than 82 days out to capitalize on advance planning.
- Target marketing efforts for the Fall season well in advance (at least 69 days) to capture early planners.
- Monitor your own booking lead times against these Al Ouidane averages to identify opportunities for dynamic pricing adjustments.
Popular & Essential Airbnb Amenities in Al Ouidane (2026)
Amenity Prevalence
Amenity Insights for Al Ouidane
- Essential amenities in Al Ouidane that guests expect include: Wifi, Air conditioning, Pool, Free parking on premises, Washer, TV. Lacking these (any) could significantly impact bookings.
- Popular amenities like Kitchen, Heating, Hot water are common but not universal. Offering these can provide a competitive edge.
Recommendations for Hosts
- Ensure your listing includes all essential amenities for Al Ouidane: Wifi, Air conditioning, Pool, Free parking on premises, Washer, TV.
- Prioritize adding missing essentials: Air conditioning, Pool, Free parking on premises, Washer, TV.
- Consider adding popular differentiators like Kitchen or Heating to increase appeal.
- Highlight unique or less common amenities you offer (e.g., hot tub, dedicated workspace, EV charger) in your listing description and photos.
- Regularly check competitor amenities in Al Ouidane to stay competitive.
Al Ouidane Airbnb Guest Demographics & Profile Analysis (2026)
Guest Profile Summary for Al Ouidane
- The typical guest profile for Airbnb in Al Ouidane consists of predominantly international visitors (97%), with top international origins including United Kingdom, typically belonging to the Post-2000s (Gen Z/Alpha) group (50%), primarily speaking English or French.
- Domestic travelers account for 3.5% of guests.
- Key international markets include France (48.7%) and United Kingdom (22.2%).
- Top languages spoken are English (37.9%) followed by French (30.1%).
- A significant demographic segment is the Post-2000s (Gen Z/Alpha) group, representing 50% of guests.
Recommendations for Hosts
- Focus marketing internationally, particularly towards travelers from United Kingdom.
- Tailor amenities and listing descriptions to appeal to the dominant Post-2000s (Gen Z/Alpha) demographic (e.g., highlight fast WiFi, smart home features, local guides).
- Highlight unique local experiences or amenities relevant to the primary guest profile.
- Consider seasonal promotions aligned with peak travel times for key origin markets.
Nearby Short-Term Rental Market Comparison
How does the Al Ouidane Airbnb market stack up against its neighbors? Compare key performance metrics like average monthly revenue, ADR, and occupancy rates in surrounding areas to understand the broader regional STR landscape.
| Market | Active Properties | Monthly Revenue | Daily Rate | Avg. Occupancy |
|---|---|---|---|---|
| Tamazouzte | 13 | $5,719 | $598.25 | 36% |
| Sidi Abdallah Ghiat سيدي عبد الله غيات | 84 | $3,889 | $477.80 | 36% |
| Tameslouht | 90 | $3,556 | $430.48 | 33% |
| Oulad Hassoune | 102 | $3,051 | $388.70 | 33% |
| Tassoultante | 464 | $2,600 | $284.71 | 40% |
| Mechouar Kasbah | 321 | $1,963 | $216.60 | 43% |
| Ghmate اغمات | 28 | $1,571 | $265.01 | 37% |
| Marrakesh | 8,108 | $1,408 | $151.20 | 42% |
| Ouahat Sidi Brahim | 68 | $1,380 | $169.71 | 37% |
| Aghouatim اغواطيم | 28 | $1,309 | $184.19 | 28% |