AirROI ranking · 202653 markets ranked
Best Places to Buy an Airbnb in Morocco (2026)
Marrakesh is the best place to buy an Airbnb in Morocco in 2026, according to AirROI's ranking of 53 markets. Its listings averaged MAD 164,000 in revenue over the 12 months to October 2026 and were booked on 40% of nights. It leads on the blend rather than on any one measure, placing 1st of 53 for market size, 1st of 53 for year-round demand and 4th of 53 for revenue per listing. Taghazout and Essaouira come next.
- Markets tracked
- 139
- Active Airbnb listings
- 42,600
- Avg. revenue per listing
- MAD 107,000
- Occupancy rate
- 36%
- Avg. nightly rate
- MAD 1,140
- Revenue change, typical market
- +6%
The short answer
Morocco Airbnb Market at a Glance
Marrakech-Safi and Souss-Massa hold eight of the top ten places between them but only 14 of the 53 ranked markets. Their listings earn more: their ranked markets average MAD 148,000 per listing, against MAD 65,600 for ranked markets elsewhere.
Across Morocco, the 42,600 active Airbnb listings tracked by AirROI, a short-term-rental data firm, averaged MAD 107,000 over the same period. They were booked on 36% of nights at about MAD 1,140 a night; the ranking covers the 53 markets with at least 100 active listings. Revenue per listing rose in 31 of the 43 ranked markets with a comparable year of data, by 6% in the typical one.
The ranking weighs revenue per listing most, then occupancy and market size, then how evenly income spreads across the year and how it changed on the year. It reflects rental performance, not purchase prices or local short-term rental rules. How the ranking works.
Where the top 10 Airbnb markets in Morocco are
Each dot is one of the 139 markets AirROI tracks in Morocco (2 outlying ones fall outside the map), sized by active listings and coloured by average revenue per listing. Select a number to jump to its profile.
Money figures on this page are in Moroccan dirhams, converted from US dollars at MAD 9.26 per US$, the typical rate from November 2025 to October 2026.
Top 10
The Top 10 Airbnb Markets in Morocco
Each profile draws on the market's full AirROI report: how it earns, when in the year, who books and what sells. Monthly figures are averages per listing active in that month, so twelve of them add up to more than the annual average, which also counts listings that operated for only part of the year.
| # | Market | Avg. revenue | Occupancy |
|---|---|---|---|
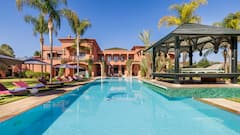 Marrakesh Large market · Year-round demand | MAD 164,000 | 40% | |
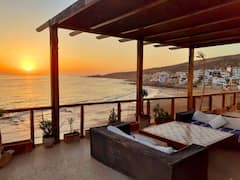 Taghazout High occupancy · High earnings | MAD 140,000 | 45% | |
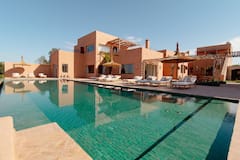 Essaouira High occupancy · High earnings | MAD 124,000 | 39% | |
| 4 |  Rabat Large market · High occupancy | MAD 85,700 | 38% |
| 5 | 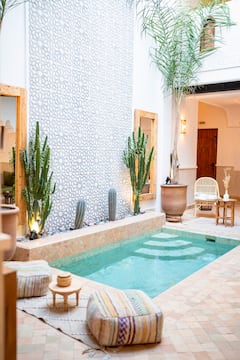 Mechouar Kasbah High earnings · Year-round demand | MAD 224,000 | 37% |
| 6 | 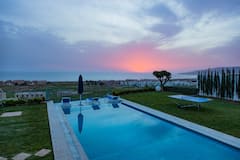 Aourir High occupancy · Large market | MAD 94,300 | 38% |
| 7 | 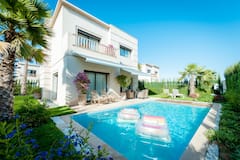 Agadir Large market · High occupancy | MAD 86,400 | 39% |
| 8 | 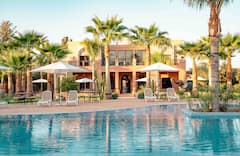 Tassoultante High earnings · Large market | MAD 306,000 | 35% |
| 9 |  Al Ouidane High earnings · High occupancy | MAD 538,000 | 37% |
| 10 | 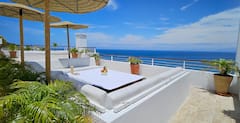 Tangier Large market | MAD 87,400 | 36% |
1. Marrakesh
Known for: Large market · Year-round demand
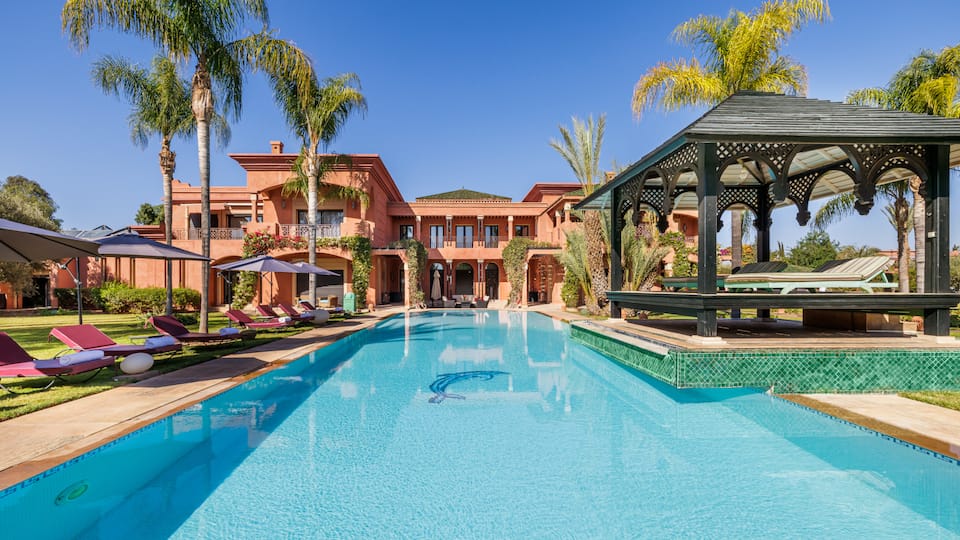

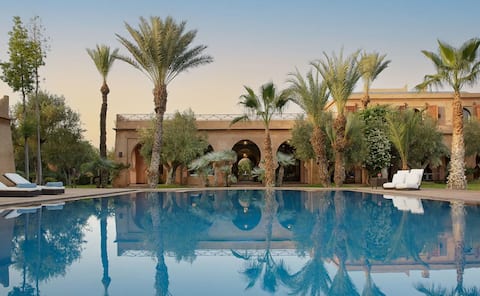
Top-earning Airbnb listings in Marrakesh - Avg. revenue
- MAD 164,000 +1% vs. last year
- Occupancy
- 40%
- Nightly rate
- MAD 1,535
- Active listings
- 11,900
Where it places among the 53 ranked markets in Morocco
- Revenue 4th of 53
- Occupancy 4th of 53
- Market size 1st of 53
- Year-round 1st of 53
- Growth 28th of 43
- How it earns
- Marrakesh fills more nights than most of Morocco: 40% of them, the fourth-highest occupancy of the 53 ranked markets, at about MAD 1,535 a night. That adds up to MAD 164,000 per listing over the year, the fourth-highest of the 53 ranked markets. A typical listing takes in about MAD 12,500 a month; the top quarter clear MAD 24,700 or more.
- When it earns
- Demand in Marrakesh holds up through the year: January, the slowest month, still brings in about two-thirds of August's revenue.
- What sells
- The most common entire home has 2 bedrooms (41% of entire homes), and apartments and condos make up 62% of supply.
- Who books
- Most guests come from abroad (94%), led by visitors from France, the United Kingdom and the United States.
- Who it suits
- It suits buyers who want income that holds up all year.
Revenue per listing by month
MAD 25,600 MAD 17,000- Median listing
- MAD 12,500/mo
- Top 25% of listings
- MAD 24,700+/mo
- Booked ahead
- 36 days
- Average stay
- 5 nights
- Most common home size
- 2 bedrooms
- Superhosts
- 51%
Areas in the full report: Medina · Guéliz · Hivernage
Full Marrakesh Airbnb report2. Taghazout
Known for: High occupancy · High earnings
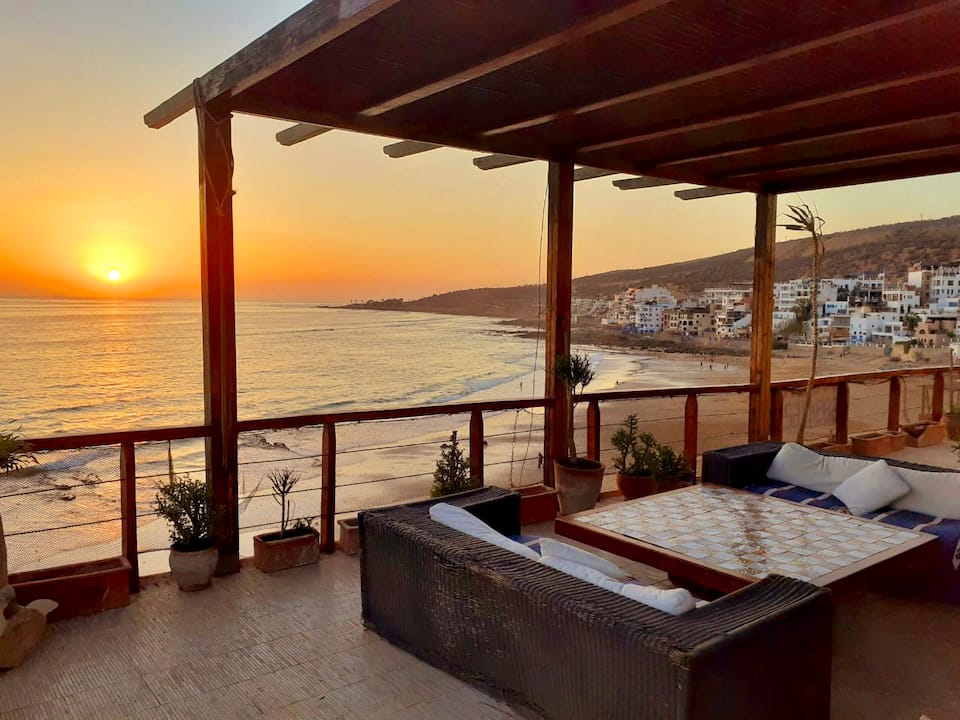
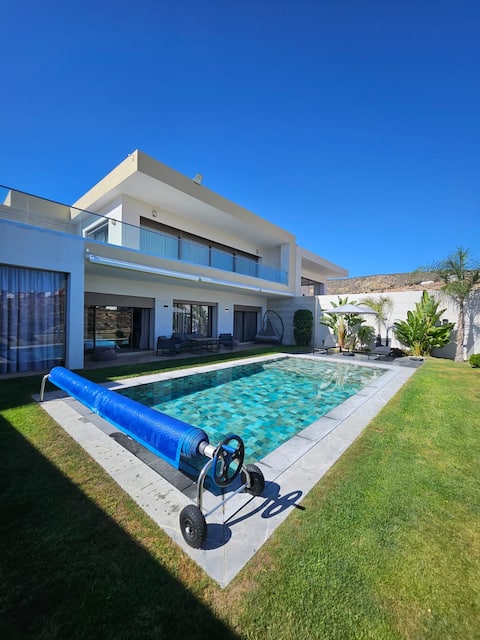

Top-earning Airbnb listings in Taghazout - Avg. revenue
- MAD 140,000 +16% vs. last year
- Occupancy
- 45%
- Nightly rate
- MAD 1,055
- Active listings
- 674
Where it places among the 53 ranked markets in Morocco
- Revenue 5th of 53
- Occupancy 1st of 53
- Market size 9th of 53
- Year-round 11th of 53
- Growth 11th of 43
- How it earns
- Listings in Taghazout are booked on 45% of nights, the highest occupancy of the 53 ranked markets, at about MAD 1,055 a night. Listings averaged MAD 140,000 in revenue over the year, the fifth-highest of the 53 ranked markets. In a typical month the median listing brings in about MAD 12,000, and the best quarter clear MAD 22,900. Revenue per listing rose 16% over the year, helped by nightly rates 23% higher, even as the number of listings grew 47%.
- When it earns
- Taghazout's season runs from July to September, peaking in August at about MAD 27,100 per listing; January, the quietest month, brings in about MAD 13,000.
- What sells
- Two-bedroom homes lead the market (43% of entire homes), and apartments and condos make up 73% of supply.
- Who books
- Most guests come from abroad (94%), led by visitors from France, the United Kingdom and Germany.
Revenue per listing by month
MAD 27,100 MAD 13,000- Median listing
- MAD 12,000/mo
- Top 25% of listings
- MAD 22,900+/mo
- Booked ahead
- 36 days
- Average stay
- 5 nights
- Most common home size
- 2 bedrooms
- Superhosts
- 38%
Areas in the full report: Taghazout Beach · Azazoul · Imsouane
Full Taghazout Airbnb report3. Essaouira
Known for: High occupancy · High earnings
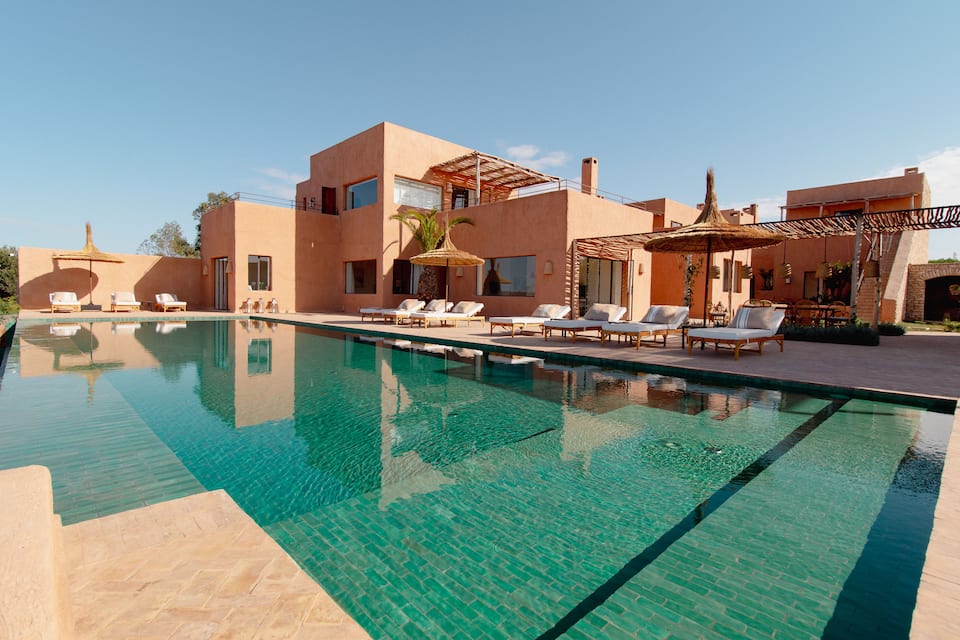


Top-earning Airbnb listings in Essaouira - Avg. revenue
- MAD 124,000 +10% vs. last year
- Occupancy
- 39%
- Nightly rate
- MAD 1,100
- Active listings
- 1,870
Where it places among the 53 ranked markets in Morocco
- Revenue 6th of 53
- Occupancy 5th of 53
- Market size 6th of 53
- Year-round 9th of 53
- Growth 16th of 43
- How it earns
- Demand runs high in Essaouira: 39% of nights booked, the fifth-highest occupancy of the 53 ranked markets, at about MAD 1,100 a night. Average revenue per listing came to MAD 124,000, the sixth-highest of the 53 ranked markets. Month to month, the median listing earns about MAD 9,080 and a top-quarter listing MAD 18,100 or more. Revenue per listing rose 10% over the year, helped by nightly rates 10% higher, even as the number of listings grew 30%.
- When it earns
- Revenue in Essaouira concentrates in July and August: August earns about MAD 22,900 per listing, about twice as much as November. Guests book early, about 46 days ahead against roughly 28 for the typical market in Morocco, and stay about 5 nights.
- What sells
- The most common entire home has 2 bedrooms (43% of entire homes), and apartments and condos make up 51% of supply.
- Who books
- Most guests come from abroad (94%), led by visitors from France, the United Kingdom and Germany.
Revenue per listing by month
MAD 22,900 MAD 11,500- Median listing
- MAD 9,080/mo
- Top 25% of listings
- MAD 18,100+/mo
- Booked ahead
- 46 days
- Average stay
- 5 nights
- Most common home size
- 2 bedrooms
- Superhosts
- 42%
Areas in the full report: Medina of Essaouira · Essaouira Beach · Mellah
Full Essaouira Airbnb report4. Rabat
Known for: Large market · High occupancy
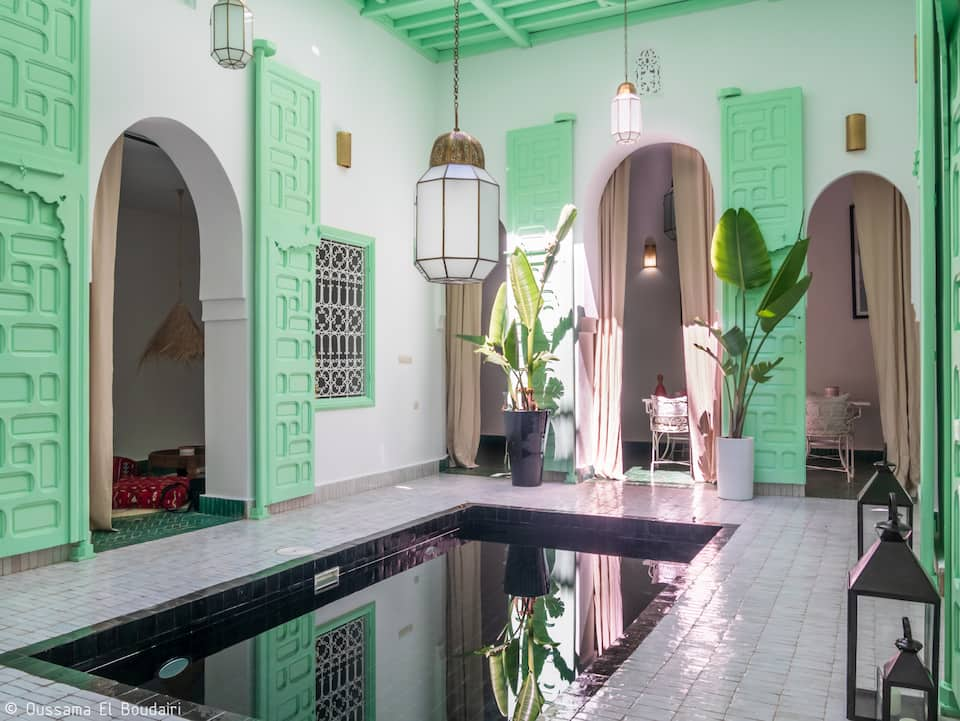
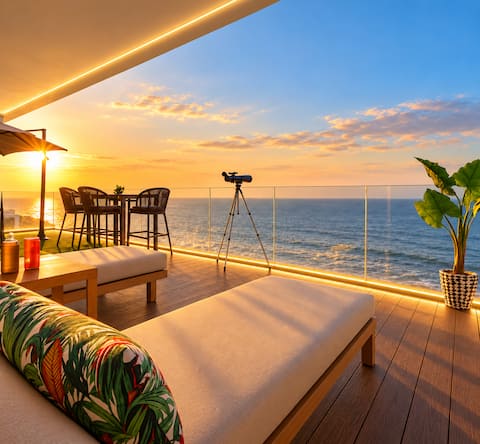
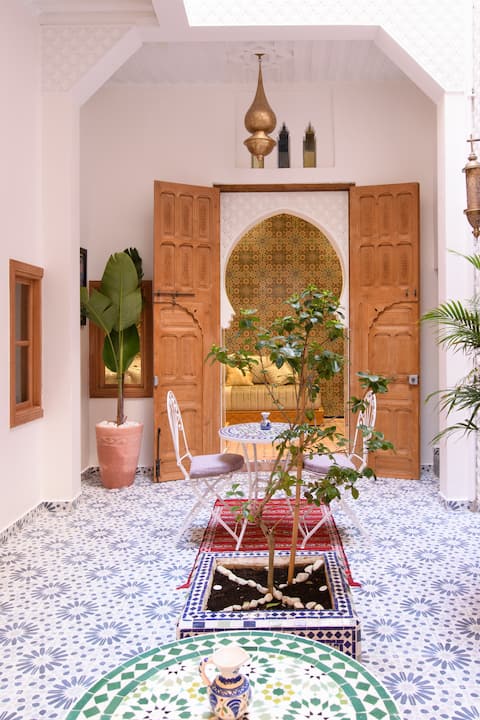
Top-earning Airbnb listings in Rabat - Avg. revenue
- MAD 85,700 +16% vs. last year
- Occupancy
- 38%
- Nightly rate
- MAD 940
- Active listings
- 2,030
Where it places among the 53 ranked markets in Morocco
- Revenue 13th of 53
- Occupancy 9th of 53
- Market size 5th of 53
- Year-round 11th of 53
- Growth 10th of 43
- How it earns
- Rabat is Morocco's fifth-largest Airbnb market, with 2,030 active listings to price against. Moderate rates keep revenue per listing at MAD 85,700, 20% below the Morocco average. A typical listing takes in about MAD 9,250 a month; the top quarter clear MAD 15,800 or more. Revenue per listing rose 16% over the year, helped by nightly rates 32% higher, even as the number of listings grew 68%.
- When it earns
- Rabat has two seasons, July–August and December–January. July is the strongest month at about MAD 15,400 per listing, and March the quietest at about MAD 7,330.
- What sells
- Two-bedroom homes lead the market (37% of entire homes), and apartments and condos make up 85% of supply.
Revenue per listing by month
MAD 15,400 MAD 7,330- Median listing
- MAD 9,250/mo
- Top 25% of listings
- MAD 15,800+/mo
- Booked ahead
- 24 days
- Average stay
- 6 nights
- Most common home size
- 2 bedrooms
- Superhosts
- 43%
Areas in the full report: Agdal · Old Medina · Hay Riad
Full Rabat Airbnb report5. Mechouar Kasbah
Known for: High earnings · Year-round demand
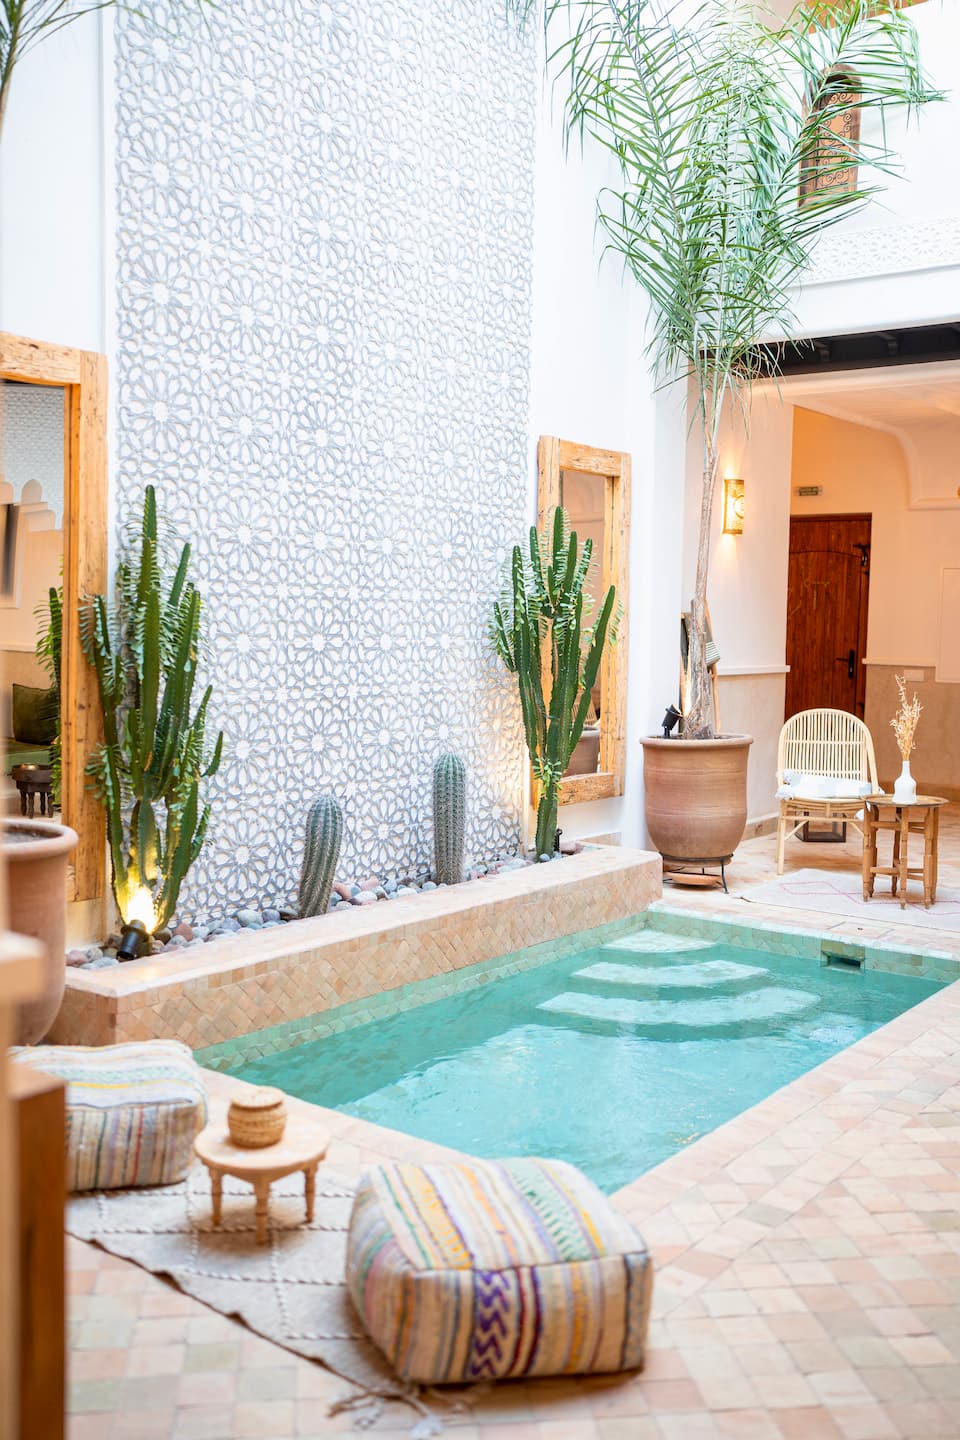

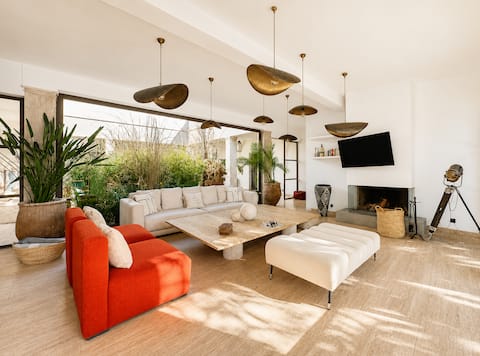
Top-earning Airbnb listings in Mechouar Kasbah - Avg. revenue
- MAD 224,000 +8% vs. last year
- Occupancy
- 37%
- Nightly rate
- MAD 2,310
- Active listings
- 284
Where it places among the 53 ranked markets in Morocco
- Revenue 3rd of 53
- Occupancy 11th of 53
- Market size 26th of 53
- Year-round 4th of 53
- Growth 19th of 43
- How it earns
- Mechouar Kasbah earns on price: guests pay about MAD 2,310 a night, about twice the Morocco average. Listings averaged MAD 224,000 in revenue over the year, the third-highest of the 53 ranked markets. In a typical month the median listing brings in about MAD 17,300, and the best quarter clear MAD 34,700. Revenue per listing rose 8% over the year, helped by nightly rates 19% higher. With 284 listings it is a small market, so its averages can move more from year to year.
- When it earns
- Revenue in Mechouar Kasbah peaks twice, over March–May and again over July–August; April leads at about MAD 35,100 per listing, while January brings in about MAD 20,400. Bookings arrive well in advance, about 60 days before check-in, so much of a season's calendar fills early; stays average 4 nights.
- What sells
- Big homes set the market: 55% of entire homes have three or more bedrooms, against about 18% in the typical market in Morocco, and houses make up 26% of supply.
- Who books
- Nearly all guests come from abroad, led by visitors from France, the United Kingdom and the United States.
- Who it suits
- Best for buyers who can furnish and price for a premium stay and want a large home for groups and families.
Revenue per listing by month
MAD 35,100 MAD 20,400- Median listing
- MAD 17,300/mo
- Top 25% of listings
- MAD 34,700+/mo
- Booked ahead
- 60 days
- Average stay
- 4 nights
- Guests from abroad
- 97%
- Most common home size
- 2 bedrooms
6. Aourir
Known for: High occupancy · Large market
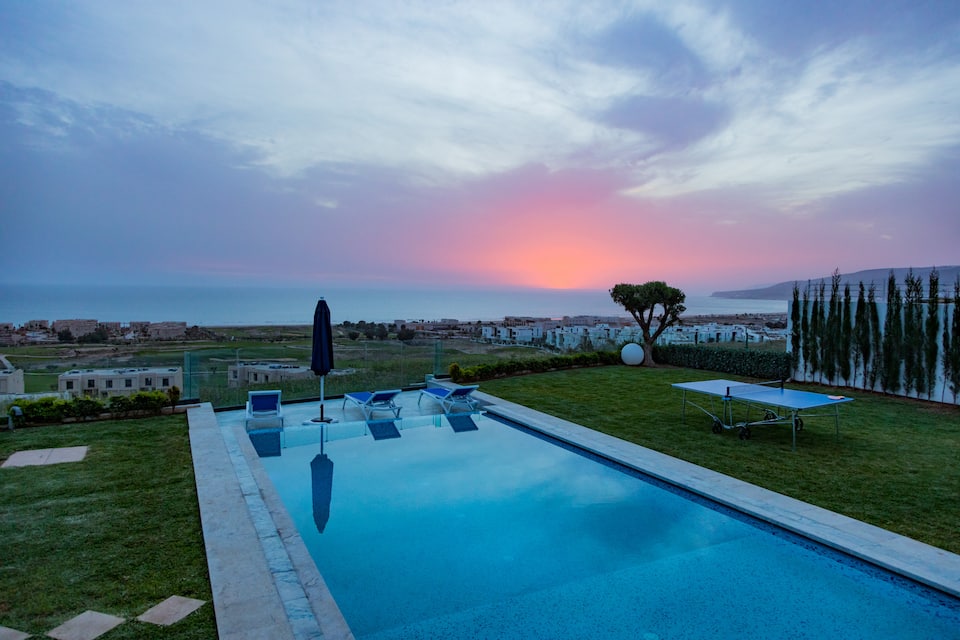


Top-earning Airbnb listings in Aourir - Avg. revenue
- MAD 94,300 +13% vs. last year
- Occupancy
- 38%
- Nightly rate
- MAD 940
- Active listings
- 671
Where it places among the 53 ranked markets in Morocco
- Revenue 8th of 53
- Occupancy 7th of 53
- Market size 10th of 53
- Year-round 25th of 53
- Growth 13th of 43
- How it earns
- Aourir listings charge about MAD 940 a night, 17% below the Morocco average, and are booked on 38% of nights. Average revenue per listing came to MAD 94,300, the eighth-highest of the 53 ranked markets. Month to month, the median listing earns about MAD 8,830 and a top-quarter listing MAD 17,000 or more. Revenue per listing rose 13% over the year, helped by nightly rates 15% higher.
- When it earns
- In Aourir, the months from July to August earn above the yearly average, led by August at about MAD 22,500 per listing; November is the low point at about MAD 8,790. Guests book early, about 40 days ahead against roughly 28 for the typical market in Morocco, and stay about 7 nights.
- What sells
- The most common entire home has 2 bedrooms (44% of entire homes), and apartments and condos make up 65% of supply.
- Who it suits
- A good fit for buyers who can carry costs through a quiet November.
Revenue per listing by month
MAD 22,500 MAD 8,790- Median listing
- MAD 8,830/mo
- Top 25% of listings
- MAD 17,000+/mo
- Booked ahead
- 40 days
- Average stay
- 7 nights
- Most common home size
- 2 bedrooms
- Superhosts
- 49%
Areas in the full report: Aourir Beach · Tamraght · Agadir
Full Aourir Airbnb report7. Agadir
Known for: Large market · High occupancy
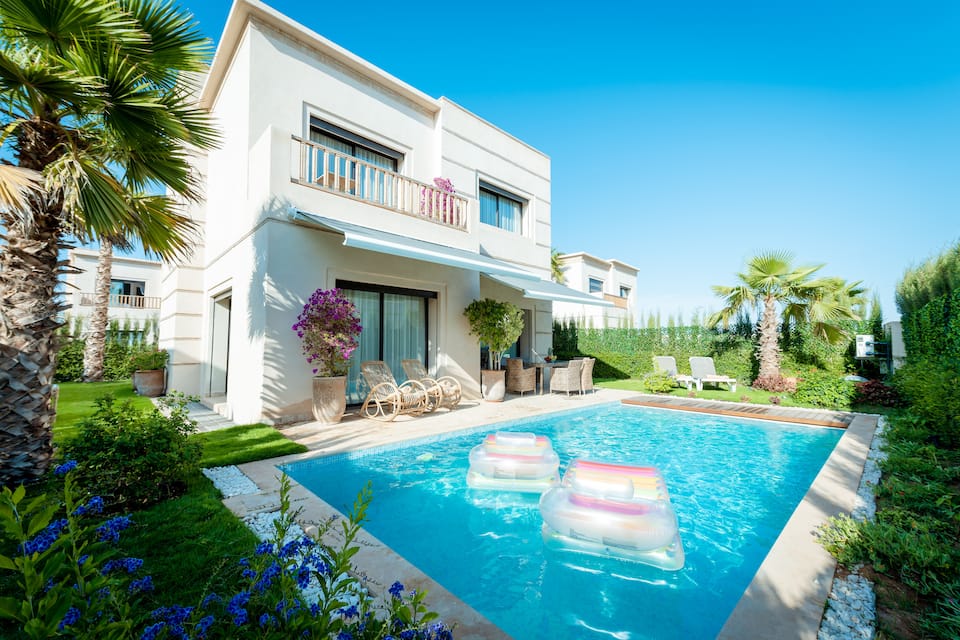
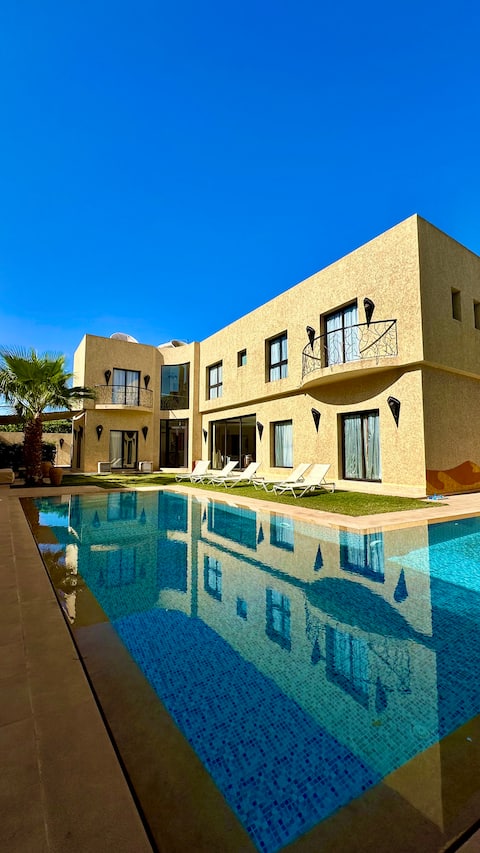
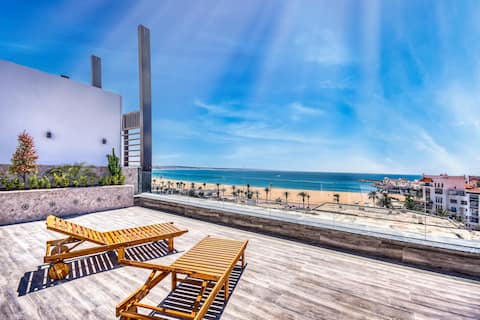
Top-earning Airbnb listings in Agadir - Avg. revenue
- MAD 86,400 +6% vs. last year
- Occupancy
- 39%
- Nightly rate
- MAD 830
- Active listings
- 2,760
Where it places among the 53 ranked markets in Morocco
- Revenue 12th of 53
- Occupancy 6th of 53
- Market size 4th of 53
- Year-round 16th of 53
- Growth 23rd of 43
- How it earns
- Agadir earns on volume. Rates run below the Morocco average at about MAD 830 a night, but listings book 39% of nights. Moderate rates keep revenue per listing at MAD 86,400, 20% below the Morocco average. A typical listing takes in about MAD 8,240 a month; the top quarter clear MAD 15,200 or more. Revenue per listing rose 6% over the year, helped by nightly rates 11% higher, even as the number of listings grew 79%.
- When it earns
- Agadir's season covers July and August, peaking in August at about MAD 19,600 per listing; November, the quietest month, brings in about MAD 8,890.
- What sells
- Two-bedroom homes lead the market (62% of entire homes), and apartments and condos make up 87% of supply.
- Who books
- Most guests come from abroad (92%), led by visitors from France, the United Kingdom and Germany.
Revenue per listing by month
MAD 19,600 MAD 8,890- Median listing
- MAD 8,240/mo
- Top 25% of listings
- MAD 15,200+/mo
- Booked ahead
- 28 days
- Average stay
- 6 nights
- Most common home size
- 2 bedrooms
- Superhosts
- 45%
Areas in the full report: Agadir Beach · Agadir Medina · Taghazout
Full Agadir Airbnb report8. Tassoultante
Known for: High earnings · Large market
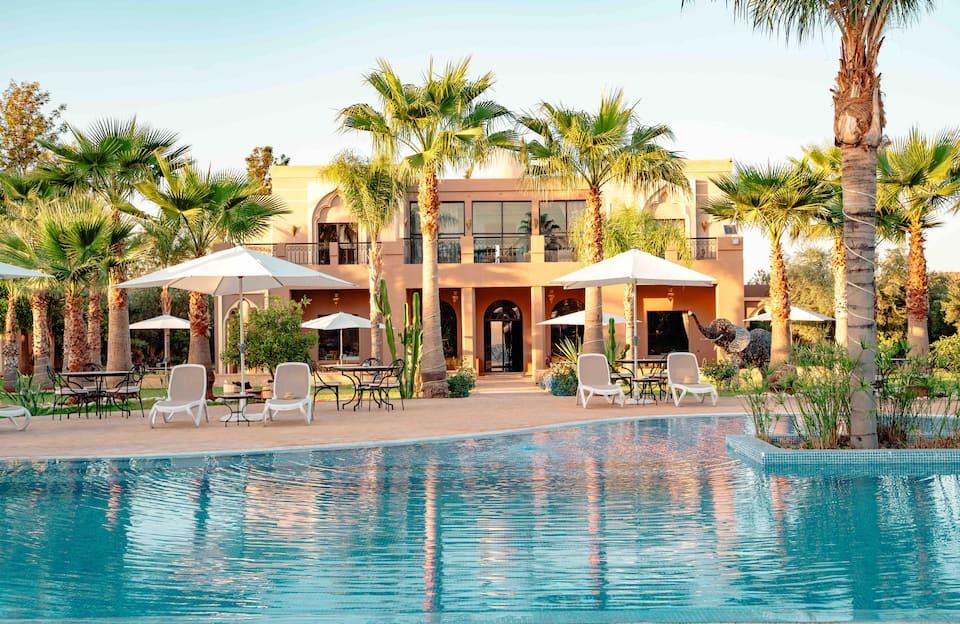


Top-earning Airbnb listings in Tassoultante - Avg. revenue
- MAD 306,000 +9% vs. last year
- Occupancy
- 35%
- Nightly rate
- MAD 2,965
- Active listings
- 377
Where it places among the 53 ranked markets in Morocco
- Revenue 2nd of 53
- Occupancy 15th of 53
- Market size 16th of 53
- Year-round 24th of 53
- Growth 17th of 43
- How it earns
- Nightly rates set Tassoultante apart: about MAD 2,965, about 2.6 times the Morocco average. Listings averaged MAD 306,000 in revenue over the year, the second-highest of the 53 ranked markets. The gap between listings is wide: a typical one takes in about MAD 18,700 a month, while the top quarter clear MAD 55,100 and the top 10% MAD 100,000, so pricing and presentation count for more here than in most of Morocco. Revenue per listing rose 9% over the year, helped by nightly rates 9% higher.
- When it earns
- Revenue in Tassoultante concentrates from April to August: August earns about MAD 57,200 per listing, about 2.5 times as much as November. Bookings arrive well in advance, about 47 days before check-in, so much of a season's calendar fills early; stays average 5 nights.
- What sells
- Big homes set the market: 57% of entire homes have three or more bedrooms, against about 18% in the typical market in Morocco, and houses make up 58% of supply.
- Who books
- Most guests come from abroad (94%), led by visitors from France, the United Kingdom and the United States.
- Who it suits
- It suits buyers who can furnish and price for a premium stay and want a large home for groups and families.
Revenue per listing by month
MAD 57,200 MAD 22,700- Median listing
- MAD 18,700/mo
- Top 25% of listings
- MAD 55,100+/mo
- Booked ahead
- 47 days
- Average stay
- 5 nights
- Most common home size
- 2 bedrooms
- Superhosts
- 44%
Areas in the full report: Agafay Desert · Hivernage · Palmeraie
Full Tassoultante Airbnb report9. Al Ouidane
Known for: High earnings · High occupancy
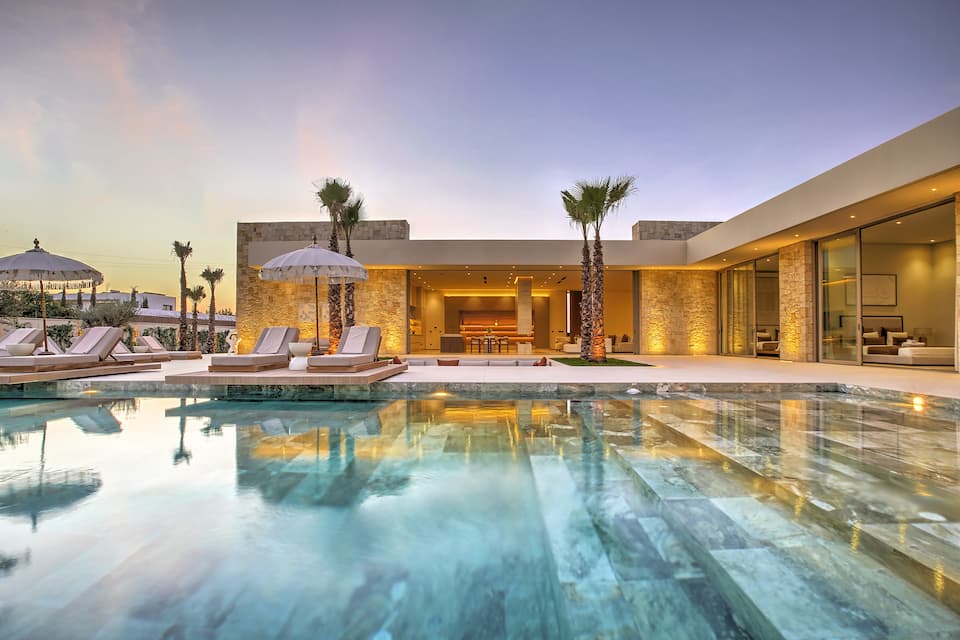
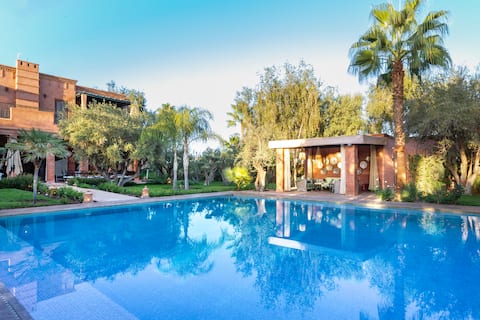

Top-earning Airbnb listings in Al Ouidane - Avg. revenue
- MAD 538,000 +5% vs. last year
- Occupancy
- 37%
- Nightly rate
- MAD 5,095
- Active listings
- 234
Where it places among the 53 ranked markets in Morocco
- Revenue 1st of 53
- Occupancy 10th of 53
- Market size 32nd of 53
- Year-round 16th of 53
- Growth 25th of 43
- How it earns
- Al Ouidane earns on price: guests pay about MAD 5,095 a night, about 4.5 times the Morocco average. Average revenue per listing came to MAD 538,000, the highest of the 53 ranked markets. In a typical month the median listing brings in about MAD 48,900, and the best quarter clear MAD 85,600. Its 234 listings make it one of the smaller ranked markets, so its figures are less settled than those of larger ones.
- When it earns
- In Al Ouidane, the months from April to August earn above the yearly average, led by August at about MAD 91,400 per listing; January is the low point at about MAD 41,500. Guests book early, about 67 days ahead against roughly 28 for the typical market in Morocco, and stay about 5 nights.
- What sells
- Big homes set the market: 94% of entire homes have three or more bedrooms, against about 18% in the typical market in Morocco, and houses make up 90% of supply.
- Guest expectations
- Guests rate listings highly, 4.86 stars on average against 4.75 for the typical market in Morocco, so reviews set a high bar.
- Who it suits
- Best for buyers who can furnish and price for a premium stay and want a large home for groups and families.
Revenue per listing by month
MAD 91,400 MAD 41,500- Median listing
- MAD 48,900/mo
- Top 25% of listings
- MAD 85,600+/mo
- Booked ahead
- 67 days
- Average stay
- 5 nights
- Most common home size
- 5+ bedrooms
- Superhosts
- 43%
10. Tangier
Known for: Large market
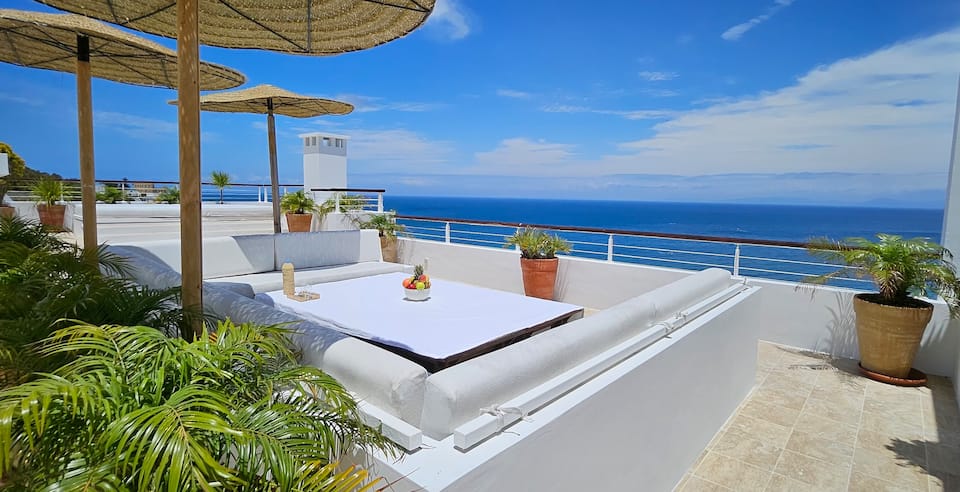

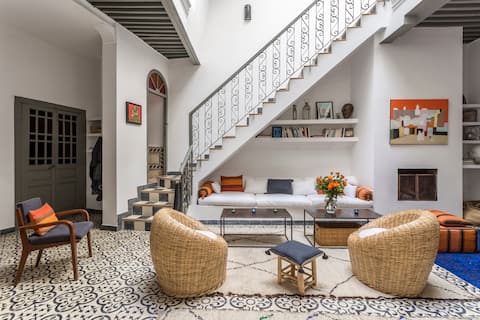
Top-earning Airbnb listings in Tangier - Avg. revenue
- MAD 87,400 +4% vs. last year
- Occupancy
- 36%
- Nightly rate
- MAD 975
- Active listings
- 3,950
Where it places among the 53 ranked markets in Morocco
- Revenue 10th of 53
- Occupancy 13th of 53
- Market size 2nd of 53
- Year-round 33rd of 53
- Growth 27th of 43
- How it earns
- Tangier is Morocco's second-largest Airbnb market, with 3,950 active listings to price against. Average revenue per listing came to MAD 87,400, the tenth-highest of the 53 ranked markets. Month to month, the median listing earns about MAD 8,980 and a top-quarter listing MAD 16,100 or more.
- When it earns
- Tangier's season runs from June to September, peaking in August at about MAD 22,500 per listing; February, the quietest month, brings in about MAD 6,970.
- What sells
- The most common entire home has 2 bedrooms (56% of entire homes), and apartments and condos make up 88% of supply.
- Who it suits
- A good fit for buyers who are prepared for thin bookings around February.
Revenue per listing by month
MAD 22,500 MAD 6,970- Median listing
- MAD 8,980/mo
- Top 25% of listings
- MAD 16,100+/mo
- Booked ahead
- 26 days
- Average stay
- 6 nights
- Most common home size
- 2 bedrooms
- Superhosts
- 42%
Areas in the full report: Medina · Corniche · Cap Spartel
Full Tangier Airbnb report
Full ranking
How All 53 Ranked Markets in Morocco Compare
The overall ranking with the five measures behind it. "Slow month" is a market's weakest month of revenue as a share of its best, so a higher figure means steadier income. Select a column heading to re-sort.
| Marrakesh Large market, year-round demand | MAD 164,193 | 40% | MAD 1,535 | 66% | +1% | 11,901 | |
| Taghazout High occupancy, high earnings | MAD 139,899 | 45% | MAD 1,056 | 48% | +16% | 674 | |
| Essaouira High occupancy, high earnings | MAD 124,322 | 39% | MAD 1,098 | 50% | +10% | 1,872 | |
| 4 | Rabat Large market, high occupancy | MAD 85,738 | 38% | MAD 940 | 48% | +16% | 2,030 |
| 5 | Mechouar Kasbah High earnings, year-round demand | MAD 223,749 | 37% | MAD 2,312 | 58% | +8% | 284 |
| 6 | Aourir High occupancy, large market | MAD 94,290 | 38% | MAD 939 | 39% | +13% | 671 |
| 7 | Agadir Large market, high occupancy | MAD 86,358 | 39% | MAD 832 | 45% | +6% | 2,763 |
| 8 | Tassoultante High earnings, large market | MAD 305,582 | 35% | MAD 2,963 | 40% | +9% | 377 |
| 9 | Al Ouidane High earnings, high occupancy | MAD 538,447 | 37% | MAD 5,094 | 45% | +5% | 234 |
| 10 | Tangier Large market | MAD 87,404 | 36% | MAD 974 | 31% | +4% | 3,951 |
| 11 | Tamraght High occupancy, large market | MAD 69,450 | 42% | MAD 635 | 42% | – | 436 |
| 12 | Casablanca Large market, year-round demand | MAD 63,008 | 35% | MAD 754 | 54% | – | 3,446 |
| 13 | Arrondissement de Sidi Belyout مقاطعة سيدي بليوط Year-round demand, large market | MAD 74,577 | 34% | MAD 823 | 58% | −2% | 358 |
| 14 | Fez Year-round demand, large market | MAD 66,867 | 31% | MAD 753 | 61% | +19% | 715 |
| 15 | Cabo Negro High occupancy | MAD 87,987 | 41% | MAD 1,127 | 12% | – | 235 |
| 16 | Salé Growing revenue | MAD 60,019 | 35% | MAD 751 | 45% | +23% | 308 |
| 17 | Tamri Growing revenue | MAD 87,025 | 33% | MAD 937 | 32% | +18% | 170 |
| 18 | Mohammedia Growing revenue, large market | MAD 53,198 | 35% | MAD 739 | 34% | +14% | 366 |
| 19 | Sidi Kaouki High earnings | MAD 118,483 | 32% | MAD 1,298 | 38% | 0% | 187 |
| 20 | Tamaris | MAD 70,995 | 36% | MAD 1,078 | 28% | – | 129 |
| 21 | Arrondissement d'Anfa مقاطعة أنفا | MAD 67,052 | 32% | MAD 836 | 47% | −4% | 275 |
| 22 | M'diq Large market | MAD 62,481 | 35% | MAD 1,041 | 16% | 0% | 446 |
| 23 | Martil Large market, high occupancy | MAD 45,738 | 38% | MAD 687 | 20% | +1% | 838 |
| 24 | Temara | MAD 59,510 | 34% | MAD 893 | 32% | – | 297 |
| 25 | Fes Large market | MAD 47,635 | 32% | MAD 694 | 45% | – | 600 |
| 26 | Mirleft Growing revenue | MAD 66,682 | 32% | MAD 760 | 42% | +10% | 211 |
| 27 | Imsouane Year-round demand, large market | MAD 53,596 | 32% | MAD 651 | 61% | −1% | 327 |
| 28 | Asilah Growing revenue | MAD 66,988 | 31% | MAD 892 | 25% | +20% | 238 |
| 29 | Arrondissement de Hay Hassani مقاطعة الحي الحسني Year-round demand | MAD 62,869 | 33% | MAD 786 | 50% | −7% | 156 |
| 30 | Kenitra Large market | MAD 42,027 | 33% | MAD 627 | 41% | – | 416 |
| 31 | Taroudant | MAD 84,572 | 29% | MAD 1,191 | 41% | +1% | 132 |
| 32 | Bouznika Large market | MAD 61,490 | 31% | MAD 1,025 | 26% | – | 327 |
| 33 | Tétouan Large market | MAD 50,458 | 33% | MAD 674 | 30% | 0% | 328 |
| 34 | Dar Bouazza Growing revenue | MAD 71,365 | 29% | MAD 1,333 | 27% | +9% | 129 |
| 35 | Anza | MAD 47,201 | 36% | MAD 571 | 31% | – | 108 |
| 36 | Skhirat | MAD 67,802 | 30% | MAD 1,238 | 21% | +6% | 132 |
| 37 | Allyene عليين | MAD 75,419 | 32% | MAD 1,553 | 12% | −9% | 118 |
| 38 | Nador | MAD 45,211 | 34% | MAD 663 | 25% | +8% | 210 |
| 39 | Fnideq Growing revenue | MAD 52,078 | 33% | MAD 1,057 | 11% | +11% | 189 |
| 40 | El Mansouria Growing revenue | MAD 40,889 | 32% | MAD 817 | 26% | +22% | 247 |
| 41 | Meknes Growing revenue | MAD 37,659 | 29% | MAD 590 | 47% | +21% | 265 |
| 42 | Cherrat ⵛⵔⴰⵟ الشراط | MAD 79,371 | 28% | MAD 1,426 | 22% | +5% | 102 |
| 43 | Ifrane Growing revenue, year-round demand | MAD 45,127 | 26% | MAD 861 | 52% | +23% | 115 |
| 44 | Chefchaouen Large market | MAD 44,489 | 26% | MAD 696 | 47% | −6% | 335 |
| 45 | Saïdia Large market | MAD 36,363 | 34% | MAD 867 | 18% | −6% | 406 |
| 46 | Al Hoceima Growing revenue | MAD 33,438 | 33% | MAD 704 | 15% | +21% | 294 |
| 47 | El Jadida Growing revenue | MAD 37,659 | 30% | MAD 591 | 33% | +18% | 199 |
| 48 | Ouarzazate Year-round demand | MAD 45,664 | 29% | MAD 652 | 55% | −9% | 101 |
| 49 | Nouaceur | MAD 44,526 | 29% | MAD 652 | 39% | +6% | 123 |
| 50 | Assilah | MAD 41,175 | 34% | MAD 777 | 5% | – | 127 |
| 51 | Oued Laou | MAD 35,002 | 34% | MAD 695 | 17% | +6% | 108 |
| 52 | Oujda | MAD 38,455 | 29% | MAD 606 | 32% | −7% | 173 |
| 53 | Sidi Rahal Chatai | MAD 33,697 | 30% | MAD 952 | 20% | −13% | 192 |
By measure
Morocco Airbnb Markets Ranked by Revenue, Nightly Rate and Occupancy
The overall ranking balances five measures. These lists take one at a time, for buyers who care most about income, pricing power, bookings, a steady calendar, momentum or market size.
Highest-earning Airbnb markets in Morocco
Average annual revenue per active listing over the past 12 months. Markets with at least 200 listings.
| # | Market | Revenue |
|---|---|---|
| Al Ouidane #9 overall | MAD 538,000 | |
| Tassoultante #8 overall | MAD 306,000 | |
| Mechouar Kasbah #5 overall | MAD 224,000 | |
| 4 | Marrakesh #1 overall | MAD 164,000 |
| 5 | Taghazout #2 overall | MAD 140,000 |
| 6 | Essaouira #3 overall | MAD 124,000 |
| 7 | Aourir #6 overall | MAD 94,300 |
| 8 | Cabo Negro #15 overall | MAD 88,000 |
| 9 | Tangier #10 overall | MAD 87,400 |
| 10 | Agadir #7 overall | MAD 86,400 |
| 11 | Rabat #4 overall | MAD 85,700 |
| 12 | Arrondissement de Sidi Belyout مقاطعة سيدي بليوط #13 overall | MAD 74,600 |
| 13 | Tamraght #11 overall | MAD 69,400 |
| 14 | Arrondissement d'Anfa مقاطعة أنفا #21 overall | MAD 67,100 |
| 15 | Asilah #28 overall | MAD 67,000 |
| 16 | Fez #14 overall | MAD 66,900 |
| 17 | Mirleft #26 overall | MAD 66,700 |
| 18 | Casablanca #12 overall | MAD 63,000 |
| 19 | M'diq #22 overall | MAD 62,500 |
| 20 | Bouznika #32 overall | MAD 61,500 |
| 21 | Salé #16 overall | MAD 60,000 |
| 22 | Temara #24 overall | MAD 59,500 |
| 23 | Imsouane #27 overall | MAD 53,600 |
| 24 | Mohammedia #18 overall | MAD 53,200 |
| 25 | Tétouan #33 overall | MAD 50,500 |
Most expensive Airbnb markets in Morocco by nightly rate
Average rate per booked night. A high rate earns most where occupancy holds up too. Markets with at least 200 listings.
| # | Market | Nightly |
|---|---|---|
| Al Ouidane #9 overall | MAD 5,095 | |
| Tassoultante #8 overall | MAD 2,965 | |
| Mechouar Kasbah #5 overall | MAD 2,310 | |
| 4 | Marrakesh #1 overall | MAD 1,535 |
| 5 | Cabo Negro #15 overall | MAD 1,125 |
| 6 | Essaouira #3 overall | MAD 1,100 |
| 7 | Taghazout #2 overall | MAD 1,055 |
| 8 | M'diq #22 overall | MAD 1,040 |
| 9 | Bouznika #32 overall | MAD 1,025 |
| 10 | Tangier #10 overall | MAD 975 |
| 11 | Rabat #4 overall | MAD 940 |
| 12 | Aourir #6 overall | MAD 940 |
| 13 | Temara #24 overall | MAD 895 |
| 14 | Asilah #28 overall | MAD 890 |
| 15 | Saïdia #45 overall | MAD 865 |
| 16 | Arrondissement d'Anfa مقاطعة أنفا #21 overall | MAD 835 |
| 17 | Agadir #7 overall | MAD 830 |
| 18 | Arrondissement de Sidi Belyout مقاطعة سيدي بليوط #13 overall | MAD 825 |
| 19 | El Mansouria #40 overall | MAD 815 |
| 20 | Mirleft #26 overall | MAD 760 |
| 21 | Casablanca #12 overall | MAD 755 |
| 22 | Fez #14 overall | MAD 755 |
| 23 | Salé #16 overall | MAD 750 |
| 24 | Mohammedia #18 overall | MAD 740 |
| 25 | Al Hoceima #46 overall | MAD 705 |
Highest-occupancy Airbnb markets in Morocco
Share of available nights booked over the past 12 months. Markets with at least 200 listings.
| # | Market | Occupancy |
|---|---|---|
| Taghazout #2 overall | 45% | |
| Tamraght #11 overall | 42% | |
| Cabo Negro #15 overall | 41% | |
| 4 | Marrakesh #1 overall | 40% |
| 5 | Essaouira #3 overall | 39% |
| 6 | Agadir #7 overall | 39% |
| 7 | Aourir #6 overall | 38% |
| 8 | Martil #23 overall | 38% |
| 9 | Rabat #4 overall | 38% |
| 10 | Al Ouidane #9 overall | 37% |
| 11 | Mechouar Kasbah #5 overall | 37% |
| 12 | Tangier #10 overall | 36% |
| 13 | Tassoultante #8 overall | 35% |
| 14 | M'diq #22 overall | 35% |
| 15 | Casablanca #12 overall | 35% |
| 16 | Salé #16 overall | 35% |
| 17 | Mohammedia #18 overall | 35% |
| 18 | Temara #24 overall | 34% |
| 19 | Arrondissement de Sidi Belyout مقاطعة سيدي بليوط #13 overall | 34% |
| 20 | Nador #38 overall | 34% |
| 21 | Saïdia #45 overall | 34% |
| 22 | Tétouan #33 overall | 33% |
| 23 | Al Hoceima #46 overall | 33% |
| 24 | Kenitra #30 overall | 33% |
| 25 | El Mansouria #40 overall | 32% |
Most year-round Airbnb markets in Morocco
Revenue in the slowest month as a share of the best month, so a higher figure means steadier income. Markets with at least 200 listings.
| # | Market | Slow month |
|---|---|---|
| Marrakesh #1 overall | 66% | |
| Fez #14 overall | 61% | |
| Imsouane #27 overall | 61% | |
| 4 | Arrondissement de Sidi Belyout مقاطعة سيدي بليوط #13 overall | 58% |
| 5 | Mechouar Kasbah #5 overall | 58% |
| 6 | Casablanca #12 overall | 54% |
| 7 | Essaouira #3 overall | 50% |
| 8 | Rabat #4 overall | 48% |
| 9 | Taghazout #2 overall | 48% |
| 10 | Chefchaouen #44 overall | 47% |
| 11 | Arrondissement d'Anfa مقاطعة أنفا #21 overall | 47% |
| 12 | Meknes #41 overall | 47% |
| 13 | Agadir #7 overall | 45% |
| 14 | Fes #25 overall | 45% |
| 15 | Salé #16 overall | 45% |
| 16 | Al Ouidane #9 overall | 45% |
| 17 | Tamraght #11 overall | 42% |
| 18 | Mirleft #26 overall | 42% |
| 19 | Kenitra #30 overall | 41% |
| 20 | Tassoultante #8 overall | 40% |
| 21 | Aourir #6 overall | 39% |
| 22 | Mohammedia #18 overall | 34% |
| 23 | Temara #24 overall | 32% |
| 24 | Tangier #10 overall | 31% |
| 25 | Tétouan #33 overall | 30% |
Fastest-growing Airbnb markets in Morocco
Change in revenue per listing from the year before, among markets where it rose. Markets with at least 200 listings.
| # | Market | Change |
|---|---|---|
| Salé #16 overall | +23% | |
| El Mansouria #40 overall | +22% | |
| Meknes #41 overall | +21% | |
| 4 | Al Hoceima #46 overall | +21% |
| 5 | Asilah #28 overall | +20% |
| 6 | Fez #14 overall | +19% |
| 7 | Rabat #4 overall | +16% |
| 8 | Taghazout #2 overall | +16% |
| 9 | Mohammedia #18 overall | +14% |
| 10 | Aourir #6 overall | +13% |
| 11 | Mirleft #26 overall | +10% |
| 12 | Essaouira #3 overall | +10% |
| 13 | Tassoultante #8 overall | +9% |
| 14 | Mechouar Kasbah #5 overall | +8% |
| 15 | Nador #38 overall | +8% |
| 16 | Agadir #7 overall | +6% |
| 17 | Al Ouidane #9 overall | +5% |
| 18 | Tangier #10 overall | +4% |
| 19 | Marrakesh #1 overall | +1% |
| 20 | Martil #23 overall | +1% |
Largest Airbnb markets in Morocco
Active listings. Bigger markets have more comparable rentals to price against and more buyers at resale.
| # | Market | Listings |
|---|---|---|
| Marrakesh #1 overall | 11,900 | |
| Tangier #10 overall | 3,950 | |
| Casablanca #12 overall | 3,450 | |
| 4 | Agadir #7 overall | 2,760 |
| 5 | Rabat #4 overall | 2,030 |
| 6 | Essaouira #3 overall | 1,870 |
| 7 | Martil #23 overall | 838 |
| 8 | Fez #14 overall | 715 |
| 9 | Taghazout #2 overall | 674 |
| 10 | Aourir #6 overall | 671 |
| 11 | Fes #25 overall | 600 |
| 12 | M'diq #22 overall | 446 |
| 13 | Tamraght #11 overall | 436 |
| 14 | Kenitra #30 overall | 416 |
| 15 | Saïdia #45 overall | 406 |
| 16 | Tassoultante #8 overall | 377 |
| 17 | Mohammedia #18 overall | 366 |
| 18 | Arrondissement de Sidi Belyout مقاطعة سيدي بليوط #13 overall | 358 |
| 19 | Chefchaouen #44 overall | 335 |
| 20 | Tétouan #33 overall | 328 |
| 21 | Imsouane #27 overall | 327 |
| 22 | Bouznika #32 overall | 327 |
| 23 | Salé #16 overall | 308 |
| 24 | Temara #24 overall | 297 |
| 25 | Al Hoceima #46 overall | 294 |
Regions
Best Regions for Airbnb in Morocco
Marrakech-Safi has the highest average revenue per listing of the larger regions in Morocco, at MAD 172,000. Souss-Massa (MAD 89,100) and Rabat-Salé-Kénitra (MAD 74,100) follow. Casablanca-Settat places the most markets in the national ranking: 13 of 53.
| Region | Avg. revenue | Occupancy | Top-ranked market |
|---|---|---|---|
| Marrakech-Safi | MAD 172,365 | 39% | Marrakesh #1 |
| Souss-Massa | MAD 89,107 | 39% | Taghazout #2 |
| Rabat-Salé-Kénitra | MAD 74,123 | 36% | Rabat #4 |
| Tangier-Tetouan-Al Hoceima | MAD 71,236 | 35% | Tangier #10 |
| Casablanca-Settat | MAD 60,500 | 34% | Casablanca #12 |
| Fez-Meknes | MAD 52,920 | 30% | Fez #14 |
| Oriental | MAD 38,473 | 33% | Nador #38 |
| Drâa-Tafilalet | MAD 35,012 | 21% | Ouarzazate #48 |
Seasonality
When Airbnbs in Morocco Earn the Most
August is the best month for about eight in ten ranked markets in Morocco. February is the most common slowest month, in 17 markets.
August earns about 1.9 times what November does
Average revenue per listing across the 53 ranked markets in Morocco, by month
| Month | Avg. revenue per listing | Best month for | Highest-ranked examples |
|---|---|---|---|
| January | MAD 11,400 | – | – |
| February | MAD 11,100 | – | – |
| March | MAD 12,200 | – | – |
| April | MAD 14,500 | 3 markets | Mechouar Kasbah, Fez, Ouarzazate |
| May | MAD 13,800 | – | – |
| June | MAD 14,000 | – | – |
| July | MAD 18,700 | 8 markets | Rabat, Salé, Temara |
| August | MAD 20,900 | 42 markets | Marrakesh, Taghazout, Essaouira |
| September | MAD 13,700 | – | – |
| October | MAD 14,200 | – | – |
| November | MAD 11,100 | – | – |
| December | MAD 13,000 | – | – |
Average revenue is per listing across the ranked markets, the line in the chart above. "Best month for" counts the ranked markets whose own revenue peaks in that month.
Management
Who Manages Airbnbs in Morocco?
AirROI ranks the 100 largest of the 422 companies that run 5 or more Airbnb listings in Morocco, by listings, guest rating and growth; companies run 16% of its listings.
Method
How the Ranking Works
The ranking covers the 53 markets in Morocco with at least 100 active Airbnb listings and data through October 2026. Each market is compared with the others on five measures, and markets are ordered by a weighted blend of where they place on each:
- Revenue per listing (35%): average revenue an active listing earned over the past 12 months.
- Occupancy (20%): share of available nights that were booked.
- Market size (20%): active listings. Bigger markets offer more comparable rentals to price against and more buyers when you sell.
- Year-round demand (15%): revenue in the slowest month as a share of the best month. The latest month is left out when its bookings look incomplete.
- Growth (10%): change in revenue per listing from the year before. Markets whose boundaries changed between years are scored in the middle.
Left out: 20 markets whose data predate the latest refresh and 3 towns listed a second time under another spelling. The score measures how rentals perform. It does not include purchase prices, financing, operating costs or local short-term rental rules, which vary by address and should be checked before buying. Figures are in Moroccan dirhams and match each market's own report; see the data methodology for how listings are tracked.
To check one property before buying, run its address and size through the free Airbnb calculator for a revenue, occupancy and nightly-rate range from comparable listings.
FAQ
Frequently Asked Questions About Airbnb Investing in Morocco
What is the best place to buy an Airbnb in Morocco?
Marrakesh ranks first of the 53 markets in Morocco in AirROI's ranking, with MAD 164,000 in average revenue per listing and 40% occupancy. Taghazout and Essaouira follow. The ranking weighs revenue, occupancy, market size, seasonality and growth; it leaves out purchase prices.
What are the most profitable Airbnb locations in Morocco?
By revenue per listing, among markets with at least 200 listings, Al Ouidane leads at MAD 538,000 a year, ahead of Tassoultante at MAD 306,000. Profit also depends on what a property costs to buy and run, which varies far more between markets than revenue does.
How much does an Airbnb make in Morocco?
The average active listing in Morocco earned MAD 107,000 over the 12 months to October 2026, at 36% occupancy. Across the ranked markets, the middle half averaged between MAD 45,200 and MAD 84,600 per listing. Averages include listings that operated for only part of the year, so a listing rented all year typically earns more.
What is a good Airbnb occupancy rate in Morocco?
The average listing in Morocco was booked on 36% of available nights over the past 12 months. Half of the ranked markets fall between 31% and 36%, so a market above about 36% sits in the top quarter. Occupancy is only half the picture: a market with lower occupancy can still earn more if its nightly rates are higher.
Where is Airbnb demand highest in Morocco?
Among ranked markets with at least 200 listings, Taghazout has the highest occupancy, with 45% of available nights booked, followed by Tamraght at 42%. Its listings average about MAD 1,055 a night and MAD 140,000 a year.
Where are Airbnb nightly rates highest in Morocco?
Among ranked markets with at least 200 listings, Al Ouidane has the highest average nightly rate, about MAD 5,095, followed by Tassoultante at MAD 2,965. Meknes is the least expensive, at about MAD 590. The average booked night in Morocco costs about MAD 1,140.
What is the best month for Airbnb in Morocco?
August is the highest-earning month for 42 of the 53 ranked markets, followed by July (8). February is the most common slowest month, in 17 of the 53 markets. Each market's report shows its own month-by-month revenue, occupancy and rates.
Which Airbnb markets in Morocco earn the most evenly through the year?
Among ranked markets with at least 200 listings, Marrakesh has the steadiest income: its slowest month, January, still earns about two-thirds of its best. Fez follows, at 61%. Steadier markets are easier to budget for, though they do not always earn the most per listing.
Which Airbnb markets are growing fastest in Morocco?
Among ranked markets with at least 200 listings, revenue per listing grew most in Salé, up 23% on the year before, and in El Mansouria, up 22%. A single strong year can reflect events or new supply, so it is worth checking a market's monthly trend before relying on it.
Is Airbnb still profitable in Morocco in 2026?
Revenue per listing grew in 31 of the 43 ranked markets with a comparable year of data; in the typical market it rose 6%. Whether a given property profits depends on its purchase price, financing and running costs.
What are the best smaller Airbnb markets in Morocco?
Among ranked markets with fewer than 250 active listings, Al Ouidane (#9 overall, MAD 538,000 per listing), Cabo Negro (#15, MAD 88,000) and Tamri (#17, MAD 87,000) place highest. Smaller markets have fewer comparable rentals to price against, so their averages can move more from year to year.
How many Airbnb listings are there in Morocco?
AirROI tracked 42,600 active Airbnb listings in Morocco over the 12 months to October 2026, across 139 markets. The largest ranked market is Marrakesh, with 11,900 listings, followed by Tangier with 3,950.
Which region is best for Airbnb in Morocco?
By average revenue per listing, Marrakech-Safi leads at MAD 172,000, followed by Souss-Massa at MAD 89,100. Casablanca-Settat places the most markets in the national ranking: 13 of 53. Within any region, the market you choose matters as much as the region itself.
Directory
Airbnb Data by State and Region in Morocco
Every state and region in Morocco with AirROI Airbnb market data, A–Z. For markets across the continent, see the best places to buy an Airbnb in Africa.
B
- Béni Mellal-Khénifra 4 markets
C
- Casablanca-Settat 27 markets
- Chefchaouen 1 market
D
- Dakhla-Oued Ed-Dahab 1 market
- Drâa-Tafilalet 14 markets
F
- Fez-Meknes 7 markets
G
- Guelmim-Oued Noun 2 markets
M
- Marrakech-Safi 23 markets
- Marrakesh-Safi 2 markets
O
- Oriental 5 markets
R
- Rabat-Salé-Kénitra 13 markets
S
- Souss-Massa 17 markets
T
- Tanger-Tétouan-Al Hoceima 1 market
- Tangier-Tetouan-Al Hoceima 22 markets