Bouknadel Airbnb Market Analysis 2026: Short Term Rental Data & Vacation Rental Statistics in Rabat-Salé-Kénitra, Morocco
Is Airbnb profitable in Bouknadel in 2026? Explore comprehensive Airbnb analytics for Bouknadel, Rabat-Salé-Kénitra, Morocco to uncover income potential. This 2026 STR market report for Bouknadel, based on AirROI data from February 2025 to January 2026, reveals key trends in the niche market of 40 active listings.
Whether you're considering an Airbnb investment in Bouknadel, optimizing your existing vacation rental, or exploring rental arbitrage opportunities, understanding the Bouknadel Airbnb data is crucial. Leveraging the low regulation environment is key to maximizing your short term rental income potential. Let's dive into the specifics.
Key Bouknadel Airbnb Performance Metrics Overview
Monthly Airbnb Revenue Variations & Income Potential in Bouknadel (2026)
Understanding the monthly revenue variations for Airbnb listings in Bouknadel is key to maximizing your short term rental income potential. Seasonality significantly impacts earnings. Our analysis, based on data from the past 12 months, shows that the peak revenue month for STRs in Bouknadel is typically August, while November often presents the lowest earnings, highlighting opportunities for strategic pricing adjustments during shoulder and low seasons. Explore the typical Airbnb income in Bouknadel across different performance tiers:
- Best-in-class properties (Top 10%) achieve $2,269+ monthly, often utilizing dynamic pricing and superior guest experiences.
- Strong performing properties (Top 25%) earn $1,467 or more, indicating effective management and desirable locations/amenities.
- Typical properties (Median) generate around $898 per month, representing the average market performance.
- Entry-level properties (Bottom 25%) see earnings around $442, often with potential for optimization.
Average Monthly Airbnb Earnings Trend in Bouknadel
Bouknadel Airbnb Occupancy Rate Trends (2026)
Maximize your bookings by understanding the Bouknadel STR occupancy trends. Seasonal demand shifts significantly influence how often properties are booked. Typically, Julysees the highest demand (peak season occupancy), while November experiences the lowest (low season). Effective strategies, like adjusting minimum stays or offering promotions, can boost occupancy during slower periods. Here's how different property tiers perform in Bouknadel:
- Best-in-class properties (Top 10%) achieve 70%+ occupancy, indicating high desirability and potentially optimized availability.
- Strong performing properties (Top 25%) maintain 48% or higher occupancy, suggesting good market fit and guest satisfaction.
- Typical properties (Median) have an occupancy rate around 30%.
- Entry-level properties (Bottom 25%) average 14% occupancy, potentially facing higher vacancy.
Average Monthly Occupancy Rate Trend in Bouknadel
Average Daily Rate (ADR) Airbnb Trends in Bouknadel (2026)
Effective short term rental pricing strategy in Bouknadel involves understanding monthly ADR fluctuations. The Average Daily Rate (ADR) for Airbnb in Bouknadel typically peaks in July and dips lowest during March. Leveraging Airbnb dynamic pricing tools or strategies based on this seasonality can significantly boost revenue. Here's a look at the typical nightly rates achieved:
- Best-in-class properties (Top 10%) command rates of $215+ per night, often due to premium features or locations.
- Strong performing properties (Top 25%) achieve nightly rates of $164 or more.
- Typical properties (Median) charge around $120 per night.
- Entry-level properties (Bottom 25%) earn around $86 per night.
Average Daily Rate (ADR) Trend by Month in Bouknadel
Get Live Bouknadel Market Intelligence 👇

Explore Real-time Analytics
Airbnb Seasonality Analysis & Trends in Bouknadel (2026)
Peak Season (August, July, September)
- Revenue averages $2,105 per month
- Occupancy rates average 49.6%
- Daily rates average $149
Shoulder Season
- Revenue averages $884 per month
- Occupancy maintains around 28.5%
- Daily rates hold near $126
Low Season (January, February, November)
- Revenue drops to average $517 per month
- Occupancy decreases to average 24.0%
- Daily rates adjust to average $123
Seasonality Insights for Bouknadel
- The Airbnb seasonality in Bouknadel shows highly seasonal trends requiring careful strategy. While the sections above show seasonal averages, it's also insightful to look at the extremes:
- During the high season, the absolute peak month showcases Bouknadel's highest earning potential, with monthly revenues capable of climbing to $2,436, occupancy reaching a high of 53.5%, and ADRs peaking at $155.
- Conversely, the slowest single month of the year, typically falling within the low season, marks the market's lowest point. In this month, revenue might dip to $407, occupancy could drop to 19.3%, and ADRs may adjust down to $115.
- Understanding both the seasonal averages and these monthly peaks and troughs in revenue, occupancy, and ADR is crucial for maximizing your Airbnb profit potential in Bouknadel.
Seasonal Strategies for Maximizing Profit
- Peak Season: Maximize revenue through premium pricing and potentially longer minimum stays. Ensure high availability.
- Low Season: Offer competitive pricing, special promotions (e.g., extended stay discounts), and flexible cancellation policies. Target off-season travelers like remote workers or budget-conscious guests.
- Shoulder Seasons: Implement dynamic pricing that balances peak and low rates. Target weekend travelers or specific events. Offer slightly more flexible terms than peak season.
- Regularly analyze your own performance against these Bouknadel seasonality benchmarks and adjust your pricing and availability strategy accordingly.
Best Areas for Airbnb Investment in Bouknadel (2026)
Exploring the top neighborhoods for short-term rentals in Bouknadel? This section highlights key areas, outlining why they are attractive for hosts and guests, along with notable local attractions. Consider these locations based on your target guest profile and investment strategy.
| Neighborhood / Area | Why Host Here? (Target Guests & Appeal) | Key Attractions & Landmarks |
|---|---|---|
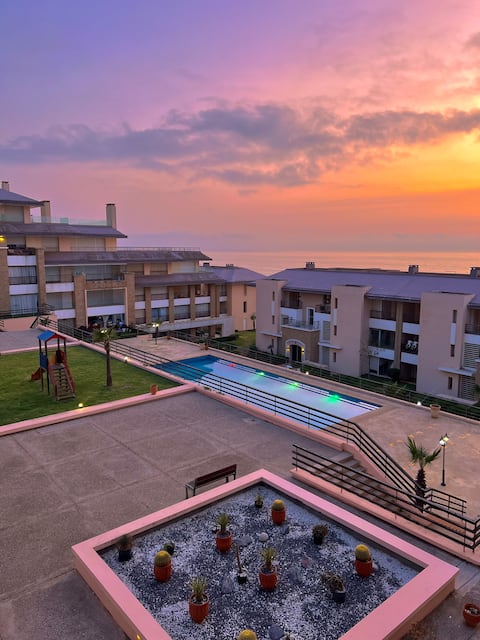
| Bouknadel Beach | A beautiful coastal area known for its sandy beaches and relaxing atmosphere. Perfect for tourists looking for a beach getaway close to Rabat. | Bouknadel Beach, National Zoo of Rabat, Royal Golf Dar Es Salam, Islands of Salé, Hassan Tower, Kasbah of the Oudayas |
| Desert of Bouknadel | A unique experience for nature lovers and adventure seekers. Offers stunning landscapes and outdoor activities like hiking and biking. | Rif Mountains, Sand dunes, Outdoor hiking trails, Nature reserves, Birdwatching areas, Scenic viewpoints |
| Moulay Bousselham | Nearby village known for its stunning lagoon and picturesque beach, making it a holiday favorite for families and locals alike. | Moulay Bousselham Lagoon, Beaches, Fishing spots, Fishermen's port, Local markets, Historical sites |
| Salé Medina | Historical old town with a rich cultural heritage. Attracts tourists interested in history, architecture, and local culture. | Medina of Salé, Kasbah of Salé, Cultural festivals, Traditional souks, Historic mosques, Riverfront promenade |
| Skhirat | Another coastal municipality known for luxurious properties and beach resorts, appealing to affluent travelers. | Skhirat Beach, Royal Skhirat Beach resort, Water sports, Local restaurants, Coastal hiking, Beach cafes |
| Rabat City Center | The capital city offers a variety of attractions, business opportunities, and cultural experiences, suitable for both tourists and business travelers. | Parc de la Ligue Arabe, Mausoleum of Mohammed V, Royal Palace, Modern art museums, Historical monuments, Shopping areas |
| Bouznika | A popular coastal town that is a short drive from major cities, ideal for weekend getaways and summer vacations. | Bouznika Beaches, Beach resorts, Golf courses, Local seafood restaurants, Casablanca accessibility, Historical sites |
| Temara | A growing suburban area near Rabat with access to beautiful beaches and affordable housing, attracting both locals and visitors. | Temara Beach, Casablanca proximity, Local parks, Shopping malls, Cultural sites, Community events |
Understanding Airbnb License Requirements & STR Laws in Bouknadel (2026)
While Bouknadel, Rabat-Salé-Kénitra, Morocco currently shows low STR regulations, specific Airbnb license requirements might still exist or change. Always verify the latest short term rental regulations and Airbnb license requirements directly with local government authorities for Bouknadel to ensure full compliance before hosting.
(Source: AirROI data, 2026, finding no licensed listings among those analyzed)
Top Performing Airbnb Properties in Bouknadel (2026)
Benchmark your potential! Explore examples of top-performing Airbnb properties in Bouknadelbased on Trailing Twelve Month (TTM) revenue. Analyze their characteristics, revenue, occupancy rate, and ADR to understand what drives success in this market.

Plage des Nations Villa, Rabat
Entire Place • 4 bedrooms
Coastal Luxury at Plage des Nations – Rabat/Salé
Entire Place • 2 bedrooms
Exclusive seaside escape with pools
Entire Place • 2 bedrooms
Villa – Nations Beach
Entire Place • 3 bedrooms
Beachfront penthouse
Entire Place • 4 bedrooms
Prestigia house beach of nations
Entire Place • 2 bedrooms
Note: Performance varies based on location, size, amenities, seasonality, and management quality. Data reflects the past 12 months.
Top Performing Airbnb Hosts in Bouknadel (2026)
Learn from the best! This table showcases top-performing Airbnb hosts in Bouknadel based on the number of properties managed and estimated total revenue over the past year. Analyze their scale and performance metrics.
| Host Name | Properties | Grossing Revenue | Stay Reviews | Avg Rating |
|---|---|---|---|---|
| Mehdi | 1 | $30,209 | 16 | 4.69/5.0 |
| Mehdi By Be Here | 1 | $21,558 | 10 | 4.70/5.0 |
| Soufiane | 1 | $17,148 | 9 | 4.89/5.0 |
| Ayoub | 3 | $17,047 | 113 | 4.81/5.0 |
| Saad | 1 | $16,842 | 39 | 4.72/5.0 |
| Chestertons | 1 | $14,371 | 5 | 5.00/5.0 |
| Youness | 1 | $12,694 | 18 | 5.00/5.0 |
| Sarimo | 2 | $12,673 | 5 | 5.00/5.0 |
| Mohammed | 1 | $11,883 | 34 | 4.71/5.0 |
| Ahmed | 1 | $11,675 | 8 | 5.00/5.0 |
Analyzing the strategies of top hosts, such as their property selection, pricing, and guest communication, can offer valuable lessons for optimizing your own Airbnb operations in Bouknadel.
Dive Deeper: Advanced Bouknadel STR Market Data (2026)
Ready to unlock more insights? AirROI provides access to advanced metrics and comprehensive Airbnb data for Bouknadel. Explore detailed analytics beyond this report to refine your investment strategy, optimize pricing, and maximize your vacation rental profits.
Explore Advanced MetricsBouknadel Short-Term Rental Market Composition (2026): Property & Room Types
Room Type Distribution
Property Type Distribution
Market Composition Insights for Bouknadel
- The Bouknadel Airbnb market composition is heavily skewed towards Entire Home/Apt listings, which make up 100% of the 40 active rentals. This indicates strong guest preference for privacy and space.
- Looking at the property type distribution in Bouknadel, Apartment/Condo properties are the most common (87.5%), reflecting the local real estate landscape.
Bouknadel Airbnb Room Capacity Analysis (2026): Bedroom Distribution
Distribution of Listings by Number of Bedrooms
Room Capacity Insights for Bouknadel
- The dominant room capacity in Bouknadel is 2 bedrooms listings, making up 65% of the market. This suggests a strong demand for properties suitable for couples or solo travelers.
- Together, 2 bedrooms and 3 bedrooms properties represent 90.0% of the active Airbnb listings in Bouknadel, indicating a high concentration in these sizes.
- A significant 32.5% of listings offer 3+ bedrooms, catering to larger groups and families seeking more space in Bouknadel.
Bouknadel Vacation Rental Guest Capacity Trends (2026)
Distribution of Listings by Guest Capacity
Guest Capacity Insights for Bouknadel
- The most common guest capacity trend in Bouknadel vacation rentals is listings accommodating 6 guests (47.5%). This suggests the primary traveler segment is likely larger groups.
- Properties designed for 6 guests and 5 guests dominate the Bouknadel STR market, accounting for 72.5% of listings.
- 62.5% of properties accommodate 6+ guests, serving the market segment for larger families or group travel in Bouknadel.
- On average, properties in Bouknadel are equipped to host 5.8 guests.
Bouknadel Airbnb Booking Patterns (2026): Available vs. Booked Days
Available Days Distribution
Booked Days Distribution
Booking Pattern Insights for Bouknadel
- The most common availability pattern in Bouknadel falls within the 271-366 days range, representing 75% of listings. This suggests many properties have significant open periods on their calendars.
- Approximately 95.0% of listings show high availability (181+ days open annually), indicating potential for increased bookings or specific owner usage patterns.
- For booked days, the 31-90 days range is most frequent in Bouknadel (40%), reflecting common guest stay durations or potential owner blocking patterns.
- A notable 5.0% of properties secure long booking periods (181+ days booked per year), highlighting successful long-term rental strategies or significant owner usage.
Bouknadel Airbnb Minimum Stay Requirements Analysis
Distribution of Listings by Minimum Night Requirement
1 Night
10 listings
25% of total
2 Nights
5 listings
12.5% of total
3 Nights
7 listings
17.5% of total
4-6 Nights
4 listings
10% of total
7-29 Nights
1 listings
2.5% of total
30+ Nights
13 listings
32.5% of total
Key Insights
- The most prevalent minimum stay requirement in Bouknadel is 30+ Nights, adopted by 32.5% of listings. This highlights the market's preference for longer commitments.
- A significant segment (32.5%) caters to monthly stays (30+ nights) in Bouknadel, pointing to opportunities in the extended-stay market.
Recommendations
- Align with the market by considering a 30+ Nights minimum stay, as 32.5% of Bouknadel hosts use this setting.
- If feasible, allowing 1-night stays, especially midweek or during low season, could capture last-minute bookings, as only 25% currently do.
- Explore offering discounts for stays of 30+ nights to attract the 32.5% of the market seeking extended stays.
- Adjust minimum nights based on seasonality – potentially shorter during low season and longer during peak demand periods in Bouknadel.
Bouknadel Airbnb Cancellation Policy Trends Analysis (2026)
Limited
3 listings
7.5% of total
Flexible
17 listings
42.5% of total
Moderate
9 listings
22.5% of total
Firm
10 listings
25% of total
Strict
1 listings
2.5% of total
Cancellation Policy Insights for Bouknadel
- The prevailing Airbnb cancellation policy trend in Bouknadel is Flexible, used by 42.5% of listings.
- There's a relatively balanced mix between guest-friendly (65.0%) and stricter (27.5%) policies, offering choices for different guest needs.
- Strict cancellation policies are quite rare (2.5%), potentially making listings with this policy less competitive unless justified by high demand or property type.
Recommendations for Hosts
- Consider adopting a Flexible policy to align with the 42.5% market standard in Bouknadel.
- Using a Strict policy might deter some guests, as only 2.5% of listings use it. Evaluate if potential revenue protection outweighs possible lower booking rates.
- Regularly review your cancellation policy against competitors and market demand shifts in Bouknadel.
Bouknadel STR Booking Lead Time Analysis (2026)
Average Booking Lead Time by Month
Booking Lead Time Insights for Bouknadel
- The overall average booking lead time for vacation rentals in Bouknadel is 30 days.
- Guests book furthest in advance for stays during August (average 44 days), likely coinciding with peak travel demand or local events.
- The shortest booking windows occur for stays in November (average 12 days), indicating more last-minute travel plans during this time.
- Seasonally, Summer (34 days avg.) sees the longest lead times, while Winter (21 days avg.) has the shortest, reflecting typical travel planning cycles.
Recommendations for Hosts
- Use the overall average lead time (30 days) as a baseline for your pricing and availability strategy in Bouknadel.
- For August stays, consider implementing length-of-stay discounts or slightly higher rates for bookings made less than 44 days out to capitalize on advance planning.
- During November, focus on last-minute booking availability and promotions, as guests book with very short notice (12 days avg.).
- Target marketing efforts for the Summer season well in advance (at least 34 days) to capture early planners.
- Monitor your own booking lead times against these Bouknadel averages to identify opportunities for dynamic pricing adjustments.
Popular & Essential Airbnb Amenities in Bouknadel (2026)
Amenity Prevalence
Amenity Insights for Bouknadel
- Essential amenities in Bouknadel that guests expect include: Free parking on premises, TV, Washer. Lacking these (any) could significantly impact bookings.
- Popular amenities like Wifi, Kitchen, Pool are common but not universal. Offering these can provide a competitive edge.
- A pool is a highly desired but not standard amenity, making it a key feature for attracting guests seeking leisure in Bouknadel.
- Warning: Wifi is not universally provided but is considered essential globally. Ensure reliable Wifi is offered.
Recommendations for Hosts
- Ensure your listing includes all essential amenities for Bouknadel: Free parking on premises, TV, Washer.
- Prioritize adding missing essentials: TV, Washer.
- Consider adding popular differentiators like Wifi or Kitchen to increase appeal.
- Highlight unique or less common amenities you offer (e.g., hot tub, dedicated workspace, EV charger) in your listing description and photos.
- Regularly check competitor amenities in Bouknadel to stay competitive.
Bouknadel Airbnb Guest Demographics & Profile Analysis (2026)
Guest Profile Summary for Bouknadel
- The typical guest profile for Airbnb in Bouknadel consists of predominantly international visitors (90%), with top international origins including Morocco, typically belonging to the Post-2000s (Gen Z/Alpha) group (50%), primarily speaking French or English.
- Domestic travelers account for 9.6% of guests.
- Key international markets include France (59%) and Morocco (9.6%).
- Top languages spoken are French (30.2%) followed by English (27.6%).
- A significant demographic segment is the Post-2000s (Gen Z/Alpha) group, representing 50% of guests.
Recommendations for Hosts
- Focus marketing internationally, particularly towards travelers from Morocco.
- Offer listing details and communication support in French.
- Tailor amenities and listing descriptions to appeal to the dominant Post-2000s (Gen Z/Alpha) demographic (e.g., highlight fast WiFi, smart home features, local guides).
- Highlight unique local experiences or amenities relevant to the primary guest profile.
- Consider seasonal promotions aligned with peak travel times for key origin markets.
Nearby Short-Term Rental Market Comparison
How does the Bouknadel Airbnb market stack up against its neighbors? Compare key performance metrics like average monthly revenue, ADR, and occupancy rates in surrounding areas to understand the broader regional STR landscape.
| Market | Active Properties | Monthly Revenue | Daily Rate | Avg. Occupancy |
|---|---|---|---|---|
| Shoul السهول | 10 | $1,584 | $159.25 | 41% |
| Sahel Chamali الساحل الشمالي | 34 | $1,209 | $152.65 | 31% |
| Bouskoura | 46 | $1,132 | $130.77 | 41% |
| Al Bahraoyine | 25 | $1,129 | $221.49 | 33% |
| Talambote | 12 | $892 | $140.90 | 26% |
| Oulad Azzouz ⵡⵍⴰⴷ ⵄⵣⵣⵓⵣ أولاد عزوز | 13 | $812 | $161.42 | 31% |
| Harhoura | 132 | $789 | $114.80 | 34% |
| Ameur عامر | 62 | $785 | $129.87 | 34% |
| Tangier | 2,828 | $764 | $101.23 | 36% |
| Sidi Taibi | 19 | $741 | $155.32 | 29% |