Gisborne Airbnb Market Analysis 2025: Short Term Rental Data & Vacation Rental Statistics in Gisborne, New Zealand
Is Airbnb profitable in Gisborne in 2025? Explore comprehensive Airbnb analytics for Gisborne, Gisborne, New Zealand to uncover income potential. This 2025 STR market report for Gisborne, based on AirROI data from September 2024 to August 2025, reveals key trends in the market of 252 active listings.
Whether you're considering an Airbnb investment in Gisborne, optimizing your existing vacation rental, or exploring rental arbitrage opportunities, understanding the Gisborne Airbnb data is crucial. Leveraging the low regulation environment is key to maximizing your short term rental income potential. Let's dive into the specifics.
Key Gisborne Airbnb Performance Metrics Overview
Monthly Airbnb Revenue Variations & Income Potential in Gisborne (2025)
Understanding the monthly revenue variations for Airbnb listings in Gisborne is key to maximizing your short term rental income potential. Seasonality significantly impacts earnings. Our analysis, based on data from the past 12 months, shows that the peak revenue month for STRs in Gisborne is typically December, while August often presents the lowest earnings, highlighting opportunities for strategic pricing adjustments during shoulder and low seasons. Explore the typical Airbnb income in Gisborne across different performance tiers:
- Best-in-class properties (Top 10%) achieve $4,006+ monthly, often utilizing dynamic pricing and superior guest experiences.
- Strong performing properties (Top 25%) earn $2,364 or more, indicating effective management and desirable locations/amenities.
- Typical properties (Median) generate around $1,446 per month, representing the average market performance.
- Entry-level properties (Bottom 25%) see earnings around $736, often with potential for optimization.
Average Monthly Airbnb Earnings Trend in Gisborne
Gisborne Airbnb Occupancy Rate Trends (2025)
Maximize your bookings by understanding the Gisborne STR occupancy trends. Seasonal demand shifts significantly influence how often properties are booked. Typically, Decembersees the highest demand (peak season occupancy), while August experiences the lowest (low season). Effective strategies, like adjusting minimum stays or offering promotions, can boost occupancy during slower periods. Here's how different property tiers perform in Gisborne:
- Best-in-class properties (Top 10%) achieve 73%+ occupancy, indicating high desirability and potentially optimized availability.
- Strong performing properties (Top 25%) maintain 57% or higher occupancy, suggesting good market fit and guest satisfaction.
- Typical properties (Median) have an occupancy rate around 37%.
- Entry-level properties (Bottom 25%) average 20% occupancy, potentially facing higher vacancy.
Average Monthly Occupancy Rate Trend in Gisborne
Average Daily Rate (ADR) Airbnb Trends in Gisborne (2025)
Effective short term rental pricing strategy in Gisborne involves understanding monthly ADR fluctuations. The Average Daily Rate (ADR) for Airbnb in Gisborne typically peaks in December and dips lowest during April. Leveraging Airbnb dynamic pricing tools or strategies based on this seasonality can significantly boost revenue. Here's a look at the typical nightly rates achieved:
- Best-in-class properties (Top 10%) command rates of $418+ per night, often due to premium features or locations.
- Strong performing properties (Top 25%) achieve nightly rates of $229 or more.
- Typical properties (Median) charge around $132 per night.
- Entry-level properties (Bottom 25%) earn around $87 per night.
Average Daily Rate (ADR) Trend by Month in Gisborne
Get Live Gisborne Market Intelligence 👇

Explore Real-time Analytics
Airbnb Seasonality Analysis & Trends in Gisborne (2025)
Peak Season (December, January, March)
- Revenue averages $2,837 per month
- Occupancy rates average 47.4%
- Daily rates average $205
Shoulder Season
- Revenue averages $1,861 per month
- Occupancy maintains around 39.6%
- Daily rates hold near $196
Low Season (June, July, August)
- Revenue drops to average $1,261 per month
- Occupancy decreases to average 30.1%
- Daily rates adjust to average $195
Seasonality Insights for Gisborne
- The Airbnb seasonality in Gisborne shows highly seasonal trends requiring careful strategy. While the sections above show seasonal averages, it's also insightful to look at the extremes:
- During the high season, the absolute peak month showcases Gisborne's highest earning potential, with monthly revenues capable of climbing to $3,423, occupancy reaching a high of 50.3%, and ADRs peaking at $212.
- Conversely, the slowest single month of the year, typically falling within the low season, marks the market's lowest point. In this month, revenue might dip to $1,147, occupancy could drop to 28.8%, and ADRs may adjust down to $189.
- Understanding both the seasonal averages and these monthly peaks and troughs in revenue, occupancy, and ADR is crucial for maximizing your Airbnb profit potential in Gisborne.
Seasonal Strategies for Maximizing Profit
- Peak Season: Maximize revenue through premium pricing and potentially longer minimum stays. Ensure high availability.
- Low Season: Offer competitive pricing, special promotions (e.g., extended stay discounts), and flexible cancellation policies. Target off-season travelers like remote workers or budget-conscious guests.
- Shoulder Seasons: Implement dynamic pricing that balances peak and low rates. Target weekend travelers or specific events. Offer slightly more flexible terms than peak season.
- Regularly analyze your own performance against these Gisborne seasonality benchmarks and adjust your pricing and availability strategy accordingly.
Best Areas for Airbnb Investment in Gisborne (2025)
Exploring the top neighborhoods for short-term rentals in Gisborne? This section highlights key areas, outlining why they are attractive for hosts and guests, along with notable local attractions. Consider these locations based on your target guest profile and investment strategy.
| Neighborhood / Area | Why Host Here? (Target Guests & Appeal) | Key Attractions & Landmarks |
|---|---|---|
| Wainui Beach | Popular surf beach with stunning ocean views and close proximity to local cafes, making it ideal for beachgoers and surfers. | Wainui Beach, Tairawhiti Museum, Kaiti Hill, Eastland Motor Lodge, Gisborne Wine Centre |
| Gisborne City Centre | The heart of Gisborne featuring shops, restaurants, and cultural attractions. It attracts a mix of business travelers and tourists. | Gisborne Botanical Gardens, Tairawhiti Arts Centre, Readings Cinema, Gisborne Historic Railway, Gisborne Farmers Market |
| Midway Beach | A quieter beach option with family-friendly amenities, perfect for families looking to relax by the sea. | Midway Beach, Gisborne Airport, Riverside Park, Gisborne Golf Club, Hikuwai National Park |
| Tolaga Bay | A scenic bay known for its long wharf and fishing opportunities, attracting visitors who enjoy outdoor activities. | Tolaga Bay Wharf, Tolaga Bay Beach, Camping at East Cape, Cooks Cove Walkway, Historic Paua Shell Factory |
| Kaiti | A suburban location close to the city with beautiful waterfront views, ideal for those seeking tranquility while being near amenities. | Kaiti Beach, Waimata River, Gisborne Cycle Trail, Kaiti Hill, Boating on the river |
| Tamarau Beach | A hidden gem that offers a serene beach experience with fewer crowds, appealing to those looking to escape the hustle. | Tamarau Beach, Shakespeare Bay, Local fishing spots, Gisborne's scenic coastline, Nature walks |
| Makorori Beach | Known for its beautiful scenery and great surfing conditions, it attracts surf enthusiasts and nature lovers alike. | Makorori Beach, Surfing spots, Scenic walks, Gisborne Point, Nearby camping areas |
| Awapuni | Residential area close to the city offering a family-friendly environment while being a short drive to attractions and amenities. | Awapuni Park, Kaiti Hill, Civic Centre, Gisborne Hospital, Sports venues |
Understanding Airbnb License Requirements & STR Laws in Gisborne (2025)
While Gisborne, Gisborne, New Zealand currently shows low STR regulations, specific Airbnb license requirements might still exist or change. Always verify the latest short term rental regulations and Airbnb license requirements directly with local government authorities for Gisborne to ensure full compliance before hosting.
(Source: AirROI data, 2025, finding no licensed listings among those analyzed)
Top Performing Airbnb Properties in Gisborne (2025)
Benchmark your potential! Explore examples of top-performing Airbnb properties in Gisbornebased on Trailing Twelve Month (TTM) revenue. Analyze their characteristics, revenue, occupancy rate, and ADR to understand what drives success in this market.
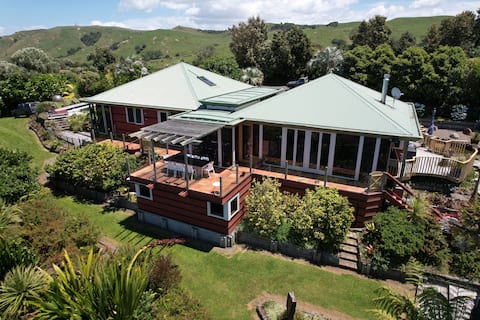
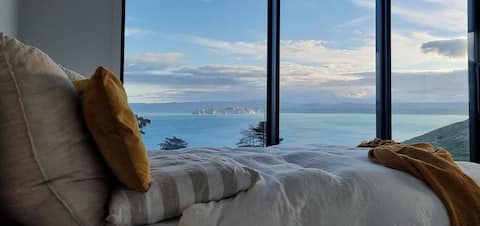
Tiromoana - Seaview
Entire Place • 3 bedrooms

Stanford Retreat
Entire Place • 8 bedrooms
Coastal Serenity
Entire Place ��• 4 bedrooms
Wainui Beach Home R&V Welcome
Entire Place • 3 bedrooms
3 Bedroom Rural Retreat 4 minutes to Rhythm
Entire Place • 3 bedrooms

Beachfront Wainui Large Home. No Pets!
Entire Place • 3 bedrooms
Note: Performance varies based on location, size, amenities, seasonality, and management quality. Data reflects the past 12 months.
Top Performing Airbnb Hosts in Gisborne (2025)
Learn from the best! This table showcases top-performing Airbnb hosts in Gisborne based on the number of properties managed and estimated total revenue over the past year. Analyze their scale and performance metrics.
| Host Name | Properties | Grossing Revenue | Stay Reviews | Avg Rating |
|---|---|---|---|---|
| Absolute Gisborne | 16 | $273,580 | 567 | 4.88/5.0 |
| Accommodation In Gisborne | 12 | $226,647 | 1116 | 4.81/5.0 |
| Ray White Gisborne | 10 | $194,535 | 193 | 4.84/5.0 |
| Ingrid | 2 | $162,986 | 29 | 4.96/5.0 |
| Diana | 1 | $120,446 | 28 | 4.86/5.0 |
| Karen | 4 | $113,372 | 265 | 4.93/5.0 |
| Olivia | 1 | $111,518 | 2 | Not Rated |
| Lleuarne | 4 | $96,373 | 44 | 4.75/5.0 |
| Jaki | 3 | $88,425 | 18 | 4.92/5.0 |
| Christine | 2 | $74,034 | 149 | 4.85/5.0 |
Analyzing the strategies of top hosts, such as their property selection, pricing, and guest communication, can offer valuable lessons for optimizing your own Airbnb operations in Gisborne.
Dive Deeper: Advanced Gisborne STR Market Data (2025)
Ready to unlock more insights? AirROI provides access to advanced metrics and comprehensive Airbnb data for Gisborne. Explore detailed analytics beyond this report to refine your investment strategy, optimize pricing, and maximize your vacation rental profits.
Explore Advanced MetricsGisborne Short-Term Rental Market Composition (2025): Property & Room Types
Room Type Distribution
Property Type Distribution
Market Composition Insights for Gisborne
- The Gisborne Airbnb market composition is heavily skewed towards Entire Home/Apt listings, which make up 89.3% of the 252 active rentals. This indicates strong guest preference for privacy and space.
- Looking at the property type distribution in Gisborne, House properties are the most common (59.9%), reflecting the local real estate landscape.
- Houses represent a significant 59.9% portion, catering likely to families or larger groups.
- The presence of 17.1% Hotel/Boutique listings indicates integration with traditional hospitality.
- Smaller segments like outdoor/unique, unique stays (combined 3.6%) offer potential for unique stay experiences.
Gisborne Airbnb Room Capacity Analysis (2025): Bedroom Distribution
Distribution of Listings by Number of Bedrooms
Room Capacity Insights for Gisborne
- The dominant room capacity in Gisborne is 1 bedroom listings, making up 28.2% of the market. This suggests a strong demand for properties suitable for couples or solo travelers.
- Together, 1 bedroom and 3 bedrooms properties represent 56.4% of the active Airbnb listings in Gisborne, indicating a high concentration in these sizes.
- A significant 42.9% of listings offer 3+ bedrooms, catering to larger groups and families seeking more space in Gisborne.
Gisborne Vacation Rental Guest Capacity Trends (2025)
Distribution of Listings by Guest Capacity
Guest Capacity Insights for Gisborne
- The most common guest capacity trend in Gisborne vacation rentals is listings accommodating 2 guests (25.4%). This suggests the primary traveler segment is likely couples or solo travelers.
- Properties designed for 2 guests and 6 guests dominate the Gisborne STR market, accounting for 47.6% of listings.
- 41.7% of properties accommodate 6+ guests, serving the market segment for larger families or group travel in Gisborne.
- On average, properties in Gisborne are equipped to host 4.4 guests.
Gisborne Airbnb Booking Patterns (2025): Available vs. Booked Days
Available Days Distribution
Booked Days Distribution
Booking Pattern Insights for Gisborne
- The most common availability pattern in Gisborne falls within the 271-366 days range, representing 52% of listings. This suggests many properties have significant open periods on their calendars.
- Approximately 86.1% of listings show high availability (181+ days open annually), indicating potential for increased bookings or specific owner usage patterns.
- For booked days, the 91-180 days range is most frequent in Gisborne (35.3%), reflecting common guest stay durations or potential owner blocking patterns.
- A notable 15.1% of properties secure long booking periods (181+ days booked per year), highlighting successful long-term rental strategies or significant owner usage.
Gisborne Airbnb Minimum Stay Requirements Analysis
Distribution of Listings by Minimum Night Requirement
1 Night
84 listings
33.5% of total
2 Nights
79 listings
31.5% of total
3 Nights
18 listings
7.2% of total
4-6 Nights
14 listings
5.6% of total
7-29 Nights
2 listings
0.8% of total
30+ Nights
54 listings
21.5% of total
Key Insights
- The most prevalent minimum stay requirement in Gisborne is 1 Night, adopted by 33.5% of listings. This highlights the market's preference for shorter, flexible bookings.
- A strong majority (65.0%) of the Gisborne Airbnb data shows acceptance of very short stays (1-2 nights), indicating a dynamic, high-turnover market.
- A significant segment (21.5%) caters to monthly stays (30+ nights) in Gisborne, pointing to opportunities in the extended-stay market.
Recommendations
- Align with the market by considering a 1 Night minimum stay, as 33.5% of Gisborne hosts use this setting.
- Explore offering discounts for stays of 30+ nights to attract the 21.5% of the market seeking extended stays.
- Adjust minimum nights based on seasonality – potentially shorter during low season and longer during peak demand periods in Gisborne.
Gisborne Airbnb Cancellation Policy Trends Analysis (2025)
Flexible
67 listings
26.8% of total
Moderate
87 listings
34.8% of total
Firm
50 listings
20% of total
Strict
46 listings
18.4% of total
Cancellation Policy Insights for Gisborne
- The prevailing Airbnb cancellation policy trend in Gisborne is Moderate, used by 34.8% of listings.
- There's a relatively balanced mix between guest-friendly (61.6%) and stricter (38.4%) policies, offering choices for different guest needs.
Recommendations for Hosts
- Consider adopting a Moderate policy to align with the 34.8% market standard in Gisborne.
- Regularly review your cancellation policy against competitors and market demand shifts in Gisborne.
Gisborne STR Booking Lead Time Analysis (2025)
Average Booking Lead Time by Month
Booking Lead Time Insights for Gisborne
- The overall average booking lead time for vacation rentals in Gisborne is 47 days.
- Guests book furthest in advance for stays during December (average 79 days), likely coinciding with peak travel demand or local events.
- The shortest booking windows occur for stays in August (average 26 days), indicating more last-minute travel plans during this time.
- Seasonally, Winter (62 days avg.) sees the longest lead times, while Summer (27 days avg.) has the shortest, reflecting typical travel planning cycles.
Recommendations for Hosts
- Use the overall average lead time (47 days) as a baseline for your pricing and availability strategy in Gisborne.
- For December stays, consider implementing length-of-stay discounts or slightly higher rates for bookings made less than 79 days out to capitalize on advance planning.
- Target marketing efforts for the Winter season well in advance (at least 62 days) to capture early planners.
- Monitor your own booking lead times against these Gisborne averages to identify opportunities for dynamic pricing adjustments.
Popular & Essential Airbnb Amenities in Gisborne (2025)
Amenity Prevalence
Amenity Insights for Gisborne
- Essential amenities in Gisborne that guests expect include: Wifi, Smoke alarm. Lacking these (any) could significantly impact bookings.
- Popular amenities like Free parking on premises, TV, Kitchen are common but not universal. Offering these can provide a competitive edge.
Recommendations for Hosts
- Ensure your listing includes all essential amenities for Gisborne: Wifi, Smoke alarm.
- Prioritize adding missing essentials: Wifi, Smoke alarm.
- Consider adding popular differentiators like Free parking on premises or TV to increase appeal.
- Highlight unique or less common amenities you offer (e.g., hot tub, dedicated workspace, EV charger) in your listing description and photos.
- Regularly check competitor amenities in Gisborne to stay competitive.
Gisborne Airbnb Guest Demographics & Profile Analysis (2025)
Guest Profile Summary for Gisborne
- The typical guest profile for Airbnb in Gisborne consists of primarily domestic travelers (76%), often arriving from nearby Auckland, typically belonging to the Post-2000s (Gen Z/Alpha) group (50%), primarily speaking English or Spanish.
- Domestic travelers account for 76.4% of guests.
- Key international markets include New Zealand (76.4%) and Australia (7.6%).
- Top languages spoken are English (73.2%) followed by Spanish (4.9%).
- A significant demographic segment is the Post-2000s (Gen Z/Alpha) group, representing 50% of guests.
Recommendations for Hosts
- Target domestic marketing efforts towards travelers from Auckland and Wellington.
- Tailor amenities and listing descriptions to appeal to the dominant Post-2000s (Gen Z/Alpha) demographic (e.g., highlight fast WiFi, smart home features, local guides).
- Highlight unique local experiences or amenities relevant to the primary guest profile.
- Consider seasonal promotions aligned with peak travel times for key origin markets.
Nearby Short-Term Rental Market Comparison
How does the Gisborne Airbnb market stack up against its neighbors? Compare key performance metrics like average monthly revenue, ADR, and occupancy rates in surrounding areas to understand the broader regional STR landscape.
| Market | Active Properties | Monthly Revenue | Daily Rate | Avg. Occupancy |
|---|---|---|---|---|
| Māhia | 12 | $1,499 | $195.42 | 35% |
| Ōhope | 113 | $1,439 | $199.42 | 39% |
| Wairoa | 16 | $1,390 | $113.31 | 47% |
| Māhia Beach | 34 | $985 | $146.96 | 35% |
| Waiotahe | 25 | $948 | $152.05 | 31% |
| Waihau Bay | 14 | $934 | $113.87 | 38% |
| Ōpōtiki | 24 | $776 | $103.21 | 34% |