Whanganui Airbnb Market Analysis 2026: Short Term Rental Data & Vacation Rental Statistics in Manawatū-Whanganui, New Zealand
Is Airbnb profitable in Whanganui in 2026? Explore comprehensive Airbnb analytics for Whanganui, Manawatū-Whanganui, New Zealand to uncover income potential. This 2026 STR market report for Whanganui, based on AirROI data from February 2025 to January 2026, reveals key trends in the niche market of 165 active listings.
Whether you're considering an Airbnb investment in Whanganui, optimizing your existing vacation rental, or exploring rental arbitrage opportunities, understanding the Whanganui Airbnb data is crucial. Leveraging the low regulation environment is key to maximizing your short term rental income potential. Let's dive into the specifics.
Key Whanganui Airbnb Performance Metrics Overview
Monthly Airbnb Revenue Variations & Income Potential in Whanganui (2026)
Understanding the monthly revenue variations for Airbnb listings in Whanganui is key to maximizing your short term rental income potential. Seasonality significantly impacts earnings. Our analysis, based on data from the past 12 months, shows that the peak revenue month for STRs in Whanganui is typically February, while May often presents the lowest earnings, highlighting opportunities for strategic pricing adjustments during shoulder and low seasons. Explore the typical Airbnb income in Whanganui across different performance tiers:
- Best-in-class properties (Top 10%) achieve $2,875+ monthly, often utilizing dynamic pricing and superior guest experiences.
- Strong performing properties (Top 25%) earn $1,971 or more, indicating effective management and desirable locations/amenities.
- Typical properties (Median) generate around $1,150 per month, representing the average market performance.
- Entry-level properties (Bottom 25%) see earnings around $548, often with potential for optimization.
Average Monthly Airbnb Earnings Trend in Whanganui
Whanganui Airbnb Occupancy Rate Trends (2026)
Maximize your bookings by understanding the Whanganui STR occupancy trends. Seasonal demand shifts significantly influence how often properties are booked. Typically, Februarysees the highest demand (peak season occupancy), while May experiences the lowest (low season). Effective strategies, like adjusting minimum stays or offering promotions, can boost occupancy during slower periods. Here's how different property tiers perform in Whanganui:
- Best-in-class properties (Top 10%) achieve 77%+ occupancy, indicating high desirability and potentially optimized availability.
- Strong performing properties (Top 25%) maintain 60% or higher occupancy, suggesting good market fit and guest satisfaction.
- Typical properties (Median) have an occupancy rate around 39%.
- Entry-level properties (Bottom 25%) average 21% occupancy, potentially facing higher vacancy.
Average Monthly Occupancy Rate Trend in Whanganui
Average Daily Rate (ADR) Airbnb Trends in Whanganui (2026)
Effective short term rental pricing strategy in Whanganui involves understanding monthly ADR fluctuations. The Average Daily Rate (ADR) for Airbnb in Whanganui typically peaks in October and dips lowest during April. Leveraging Airbnb dynamic pricing tools or strategies based on this seasonality can significantly boost revenue. Here's a look at the typical nightly rates achieved:
- Best-in-class properties (Top 10%) command rates of $164+ per night, often due to premium features or locations.
- Strong performing properties (Top 25%) achieve nightly rates of $124 or more.
- Typical properties (Median) charge around $94 per night.
- Entry-level properties (Bottom 25%) earn around $74 per night.
Average Daily Rate (ADR) Trend by Month in Whanganui
Get Live Whanganui Market Intelligence 👇

Explore Real-time Analytics
Airbnb Seasonality Analysis & Trends in Whanganui (2026)
Peak Season (February, April, March)
- Revenue averages $1,663 per month
- Occupancy rates average 51.7%
- Daily rates average $101
Shoulder Season
- Revenue averages $1,409 per month
- Occupancy maintains around 39.3%
- Daily rates hold near $108
Low Season (May, June, November)
- Revenue drops to average $1,262 per month
- Occupancy decreases to average 36.5%
- Daily rates adjust to average $106
Seasonality Insights for Whanganui
- The Airbnb seasonality in Whanganui shows moderate seasonality with distinct peak and low periods. While the sections above show seasonal averages, it's also insightful to look at the extremes:
- During the high season, the absolute peak month showcases Whanganui's highest earning potential, with monthly revenues capable of climbing to $1,731, occupancy reaching a high of 56.7%, and ADRs peaking at $113.
- Conversely, the slowest single month of the year, typically falling within the low season, marks the market's lowest point. In this month, revenue might dip to $1,128, occupancy could drop to 30.4%, and ADRs may adjust down to $100.
- Understanding both the seasonal averages and these monthly peaks and troughs in revenue, occupancy, and ADR is crucial for maximizing your Airbnb profit potential in Whanganui.
Seasonal Strategies for Maximizing Profit
- Peak Season: Maximize revenue through premium pricing and potentially longer minimum stays. Ensure high availability.
- Low Season: Offer competitive pricing, special promotions (e.g., extended stay discounts), and flexible cancellation policies. Target off-season travelers like remote workers or budget-conscious guests.
- Shoulder Seasons: Implement dynamic pricing that balances peak and low rates. Target weekend travelers or specific events. Offer slightly more flexible terms than peak season.
- Regularly analyze your own performance against these Whanganui seasonality benchmarks and adjust your pricing and availability strategy accordingly.
Best Areas for Airbnb Investment in Whanganui (2026)
Exploring the top neighborhoods for short-term rentals in Whanganui? This section highlights key areas, outlining why they are attractive for hosts and guests, along with notable local attractions. Consider these locations based on your target guest profile and investment strategy.
| Neighborhood / Area | Why Host Here? (Target Guests & Appeal) | Key Attractions & Landmarks |
|---|---|---|
| Wanganui City | The vibrant heart of Whanganui with a rich history and beautiful architecture. The city offers a variety of cultural attractions and events, making it a great place for tourists and short-term stays. | Whanganui River, Virginia Lake, Whanganui Regional Museum, Sarjeant Gallery, Historic Sarjeant Gallery, Whanganui Opera House |
| Castlecliff Beach | Known for its stunning beach views and proximity to outdoor activities. A great place for those looking to enjoy beach life while being close to the amenities of Wanganui. | Castlecliff Beach, Wanganui Golf Club, Dawson Falls, South Beach, Wanganui East |
| Moutoa Gardens | A beautiful riverside park that attracts both locals and tourists, ideal for hosting guests looking for outdoor experiences and relaxation in a scenic environment. | Moutoa Gardens, Whanganui River Pathway, Bason Botanic Gardens, Durie Hill Elevator, Virginia Lake |
| Calder Stewart Park | A family-friendly area with parks and community activities. It's a good investment for those catering to families or larger groups visiting Whanganui. | Calder Stewart Park, Whanganui East Golf Club, Wanganui Racecourse, Dugdale's Park |
| Kaitoke | A quieter, more rural area that appeals to visitors looking for a peaceful retreat. Perfect for those interested in outdoor adventures like hiking and exploring nature. | Kaitoke Regional Park, Mount Ruapehu, Raetihi, National Park Village |
| Queens Park | A central neighborhood known for its historic charm and well-kept gardens. It attracts tourists who appreciate a cultural and relaxing environment. | Queens Park, Whanganui City Bridge, Whanganui River, Whanganui Regional Museum |
| Wanganui East | A residential area that is seeing growth in popularity for Airbnb listings due to its affordable pricing and proximity to the city center and local attractions. | Wanganui East Village, Whanganui River, Local cafes and shops, Whanganui River Boardwalk |
| Whanganui Rural | The outskirts of Whanganui offer beautiful landscapes and rural experiences, ideal for those seeking a country getaway and adventure tourism. | Rural walks and trails, Local vineyards, Horse riding tours, Nature reserves |
Understanding Airbnb License Requirements & STR Laws in Whanganui (2026)
While Whanganui, Manawatū-Whanganui, New Zealand currently shows low STR regulations, specific Airbnb license requirements might still exist or change. Always verify the latest short term rental regulations and Airbnb license requirements directly with local government authorities for Whanganui to ensure full compliance before hosting.
(Source: AirROI data, 2026, finding no licensed listings among those analyzed)
Top Performing Airbnb Properties in Whanganui (2026)
Benchmark your potential! Explore examples of top-performing Airbnb properties in Whanganuibased on Trailing Twelve Month (TTM) revenue. Analyze their characteristics, revenue, occupancy rate, and ADR to understand what drives success in this market.
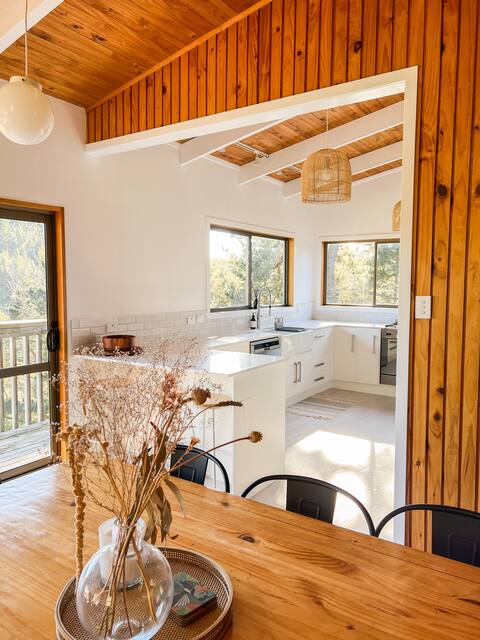
The Treehouse - a home with stunning rural views
Entire Place • 6 bedrooms

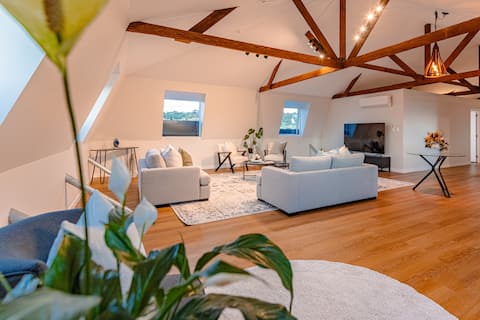
Large Spacious House 5 Bedrooms
Entire Place • 5 bedrooms
Award-winning Penthouse: Your unforgettable stay
Entire Place • 4 bedrooms
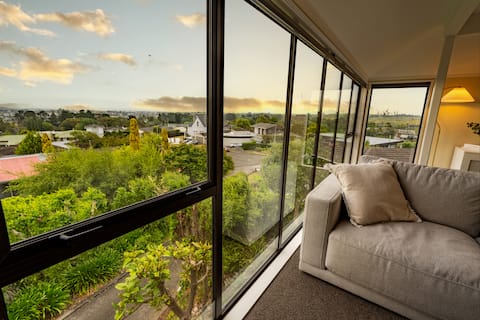
River City Views With Spa Pool, BBQ & Sky TV
Entire Place • 3 bedrooms

View Point on Tower. Stunning views of Whanganui
Entire Place • 4 bedrooms
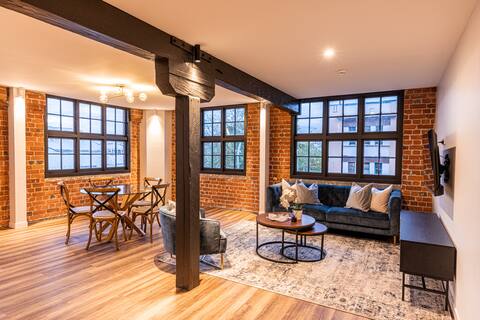
City View apartment: History meets modern elegance
Entire Place • 2 bedrooms
Note: Performance varies based on location, size, amenities, seasonality, and management quality. Data reflects the past 12 months.
Top Performing Airbnb Hosts in Whanganui (2026)
Learn from the best! This table showcases top-performing Airbnb hosts in Whanganui based on the number of properties managed and estimated total revenue over the past year. Analyze their scale and performance metrics.
| Host Name | Properties | Grossing Revenue | Stay Reviews | Avg Rating |
|---|---|---|---|---|
| Tess | 23 | $447,803 | 1326 | 4.86/5.0 |
| Anna | 1 | $84,001 | 107 | 4.93/5.0 |
| Brian | 3 | $79,111 | 583 | 4.97/5.0 |
| David | 2 | $57,603 | 72 | 4.91/5.0 |
| Rochelle | 1 | $46,690 | 146 | 4.90/5.0 |
| Debbie | 1 | $41,111 | 104 | 4.94/5.0 |
| Jiadai | 2 | $38,977 | 91 | 4.64/5.0 |
| Alice & Calvyn | 3 | $31,011 | 42 | 4.86/5.0 |
| Pam | 1 | $28,361 | 38 | 4.95/5.0 |
| Michael | 1 | $27,982 | 14 | 4.93/5.0 |
Analyzing the strategies of top hosts, such as their property selection, pricing, and guest communication, can offer valuable lessons for optimizing your own Airbnb operations in Whanganui.
Dive Deeper: Advanced Whanganui STR Market Data (2026)
Ready to unlock more insights? AirROI provides access to advanced metrics and comprehensive Airbnb data for Whanganui. Explore detailed analytics beyond this report to refine your investment strategy, optimize pricing, and maximize your vacation rental profits.
Explore Advanced MetricsWhanganui Short-Term Rental Market Composition (2026): Property & Room Types
Room Type Distribution
Property Type Distribution
Market Composition Insights for Whanganui
- The Whanganui Airbnb market composition is heavily skewed towards Entire Home/Apt listings, which make up 78.8% of the 165 active rentals. This indicates strong guest preference for privacy and space.
- Looking at the property type distribution in Whanganui, House properties are the most common (56.4%), reflecting the local real estate landscape.
- Houses represent a significant 56.4% portion, catering likely to families or larger groups.
- The presence of 22.4% Hotel/Boutique listings indicates integration with traditional hospitality.
- Smaller segments like outdoor/unique, unique stays (combined 3.0%) offer potential for unique stay experiences.
Whanganui Airbnb Room Capacity Analysis (2026): Bedroom Distribution
Distribution of Listings by Number of Bedrooms
Room Capacity Insights for Whanganui
- The dominant room capacity in Whanganui is 2 bedrooms listings, making up 27.9% of the market. This suggests a strong demand for properties suitable for couples or solo travelers.
- Together, 2 bedrooms and 1 bedroom properties represent 49.7% of the active Airbnb listings in Whanganui, indicating a high concentration in these sizes.
- A significant 27.9% of listings offer 3+ bedrooms, catering to larger groups and families seeking more space in Whanganui.
Whanganui Vacation Rental Guest Capacity Trends (2026)
Distribution of Listings by Guest Capacity
Guest Capacity Insights for Whanganui
- The most common guest capacity trend in Whanganui vacation rentals is listings accommodating 4 guests (22.4%). This suggests the primary traveler segment is likely small families or groups.
- Properties designed for 4 guests and 2 guests dominate the Whanganui STR market, accounting for 44.2% of listings.
- 25.4% of properties accommodate 6+ guests, serving the market segment for larger families or group travel in Whanganui.
- On average, properties in Whanganui are equipped to host 3.6 guests.
Whanganui Airbnb Booking Patterns (2026): Available vs. Booked Days
Available Days Distribution
Booked Days Distribution
Booking Pattern Insights for Whanganui
- The most common availability pattern in Whanganui falls within the 271-366 days range, representing 43% of listings. This suggests many properties have significant open periods on their calendars.
- Approximately 80.6% of listings show high availability (181+ days open annually), indicating potential for increased bookings or specific owner usage patterns.
- For booked days, the 91-180 days range is most frequent in Whanganui (38.2%), reflecting common guest stay durations or potential owner blocking patterns.
- A notable 21.8% of properties secure long booking periods (181+ days booked per year), highlighting successful long-term rental strategies or significant owner usage.
Whanganui Airbnb Minimum Stay Requirements Analysis
Distribution of Listings by Minimum Night Requirement
1 Night
99 listings
60% of total
2 Nights
38 listings
23% of total
4-6 Nights
1 listings
0.6% of total
30+ Nights
27 listings
16.4% of total
Key Insights
- The most prevalent minimum stay requirement in Whanganui is 1 Night, adopted by 60% of listings. This highlights the market's preference for shorter, flexible bookings.
- A strong majority (83.0%) of the Whanganui Airbnb data shows acceptance of very short stays (1-2 nights), indicating a dynamic, high-turnover market.
- A significant segment (16.4%) caters to monthly stays (30+ nights) in Whanganui, pointing to opportunities in the extended-stay market.
Recommendations
- Align with the market by considering a 1 Night minimum stay, as 60% of Whanganui hosts use this setting.
- Explore offering discounts for stays of 30+ nights to attract the 16.4% of the market seeking extended stays.
- Adjust minimum nights based on seasonality – potentially shorter during low season and longer during peak demand periods in Whanganui.
Whanganui Airbnb Cancellation Policy Trends Analysis (2026)
Flexible
70 listings
42.4% of total
Moderate
70 listings
42.4% of total
Firm
25 listings
15.2% of total
Cancellation Policy Insights for Whanganui
- The prevailing Airbnb cancellation policy trend in Whanganui is Flexible, used by 42.4% of listings.
- The market strongly favors guest-friendly terms, with 84.8% of listings offering Flexible or Moderate policies. This suggests guests in Whanganui may expect booking flexibility.
Recommendations for Hosts
- Consider adopting a Flexible policy to align with the 42.4% market standard in Whanganui.
- Regularly review your cancellation policy against competitors and market demand shifts in Whanganui.
Whanganui STR Booking Lead Time Analysis (2026)
Average Booking Lead Time by Month
Booking Lead Time Insights for Whanganui
- The overall average booking lead time for vacation rentals in Whanganui is 46 days.
- Guests book furthest in advance for stays during December (average 71 days), likely coinciding with peak travel demand or local events.
- The shortest booking windows occur for stays in June (average 26 days), indicating more last-minute travel plans during this time.
- Seasonally, Winter (61 days avg.) sees the longest lead times, while Summer (30 days avg.) has the shortest, reflecting typical travel planning cycles.
Recommendations for Hosts
- Use the overall average lead time (46 days) as a baseline for your pricing and availability strategy in Whanganui.
- For December stays, consider implementing length-of-stay discounts or slightly higher rates for bookings made less than 71 days out to capitalize on advance planning.
- Target marketing efforts for the Winter season well in advance (at least 61 days) to capture early planners.
- Monitor your own booking lead times against these Whanganui averages to identify opportunities for dynamic pricing adjustments.
Popular & Essential Airbnb Amenities in Whanganui (2026)
Amenity Prevalence
Amenity Insights for Whanganui
- Essential amenities in Whanganui that guests expect include: Wifi. Lacking these (this) could significantly impact bookings.
- Popular amenities like Smoke alarm, Hot water, Free parking on premises are common but not universal. Offering these can provide a competitive edge.
Recommendations for Hosts
- Ensure your listing includes all essential amenities for Whanganui: Wifi.
- Prioritize adding missing essentials: Wifi.
- Consider adding popular differentiators like Smoke alarm or Hot water to increase appeal.
- Highlight unique or less common amenities you offer (e.g., hot tub, dedicated workspace, EV charger) in your listing description and photos.
- Regularly check competitor amenities in Whanganui to stay competitive.
Whanganui Airbnb Guest Demographics & Profile Analysis (2026)
Guest Profile Summary for Whanganui
- The typical guest profile for Airbnb in Whanganui consists of primarily domestic travelers (76%), often arriving from nearby Wellington, typically belonging to the Post-2000s (Gen Z/Alpha) group (50%), primarily speaking English or German.
- Domestic travelers account for 75.6% of guests.
- Key international markets include New Zealand (75.6%) and Australia (7.6%).
- Top languages spoken are English (71.8%) followed by German (6.8%).
- A significant demographic segment is the Post-2000s (Gen Z/Alpha) group, representing 50% of guests.
Recommendations for Hosts
- Target domestic marketing efforts towards travelers from Wellington and Auckland.
- Tailor amenities and listing descriptions to appeal to the dominant Post-2000s (Gen Z/Alpha) demographic (e.g., highlight fast WiFi, smart home features, local guides).
- Highlight unique local experiences or amenities relevant to the primary guest profile.
- Consider seasonal promotions aligned with peak travel times for key origin markets.
Nearby Short-Term Rental Market Comparison
How does the Whanganui Airbnb market stack up against its neighbors? Compare key performance metrics like average monthly revenue, ADR, and occupancy rates in surrounding areas to understand the broader regional STR landscape.
| Market | Active Properties | Monthly Revenue | Daily Rate | Avg. Occupancy |
|---|---|---|---|---|
| Tikitere | 15 | $2,599 | $238.84 | 48% |
| Hamurana | 28 | $2,555 | $170.74 | 50% |
| Lake Tarawera | 35 | $2,411 | $302.59 | 38% |
| Te Kūiti | 17 | $2,391 | $126.21 | 59% |
| Ngongotahā | 79 | $2,152 | $194.15 | 44% |
| Okere Falls | 32 | $2,118 | $246.61 | 37% |
| Rotorua | 689 | $2,021 | $160.41 | 47% |
| Mourea | 14 | $1,943 | $212.24 | 40% |
| Taupō | 1,004 | $1,942 | $212.13 | 40% |
| Rotoiti | 10 | $1,813 | $232.31 | 32% |