Feilding Airbnb Market Analysis 2026: Short Term Rental Data & Vacation Rental Statistics in Manawatū-Whanganui, New Zealand
Is Airbnb profitable in Feilding in 2026? Explore comprehensive Airbnb analytics for Feilding, Manawatū-Whanganui, New Zealand to uncover income potential. This 2026 STR market report for Feilding, based on AirROI data from February 2025 to January 2026, reveals key trends in the niche market of 37 active listings.
Whether you're considering an Airbnb investment in Feilding, optimizing your existing vacation rental, or exploring rental arbitrage opportunities, understanding the Feilding Airbnb data is crucial. Leveraging the low regulation environment is key to maximizing your short term rental income potential. Let's dive into the specifics.
Key Feilding Airbnb Performance Metrics Overview
Monthly Airbnb Revenue Variations & Income Potential in Feilding (2026)
Understanding the monthly revenue variations for Airbnb listings in Feilding is key to maximizing your short term rental income potential. Seasonality significantly impacts earnings. Our analysis, based on data from the past 12 months, shows that the peak revenue month for STRs in Feilding is typically December, while July often presents the lowest earnings, highlighting opportunities for strategic pricing adjustments during shoulder and low seasons. Explore the typical Airbnb income in Feilding across different performance tiers:
- Best-in-class properties (Top 10%) achieve $2,589+ monthly, often utilizing dynamic pricing and superior guest experiences.
- Strong performing properties (Top 25%) earn $1,667 or more, indicating effective management and desirable locations/amenities.
- Typical properties (Median) generate around $817 per month, representing the average market performance.
- Entry-level properties (Bottom 25%) see earnings around $449, often with potential for optimization.
Average Monthly Airbnb Earnings Trend in Feilding
Feilding Airbnb Occupancy Rate Trends (2026)
Maximize your bookings by understanding the Feilding STR occupancy trends. Seasonal demand shifts significantly influence how often properties are booked. Typically, Decembersees the highest demand (peak season occupancy), while July experiences the lowest (low season). Effective strategies, like adjusting minimum stays or offering promotions, can boost occupancy during slower periods. Here's how different property tiers perform in Feilding:
- Best-in-class properties (Top 10%) achieve 72%+ occupancy, indicating high desirability and potentially optimized availability.
- Strong performing properties (Top 25%) maintain 53% or higher occupancy, suggesting good market fit and guest satisfaction.
- Typical properties (Median) have an occupancy rate around 35%.
- Entry-level properties (Bottom 25%) average 16% occupancy, potentially facing higher vacancy.
Average Monthly Occupancy Rate Trend in Feilding
Average Daily Rate (ADR) Airbnb Trends in Feilding (2026)
Effective short term rental pricing strategy in Feilding involves understanding monthly ADR fluctuations. The Average Daily Rate (ADR) for Airbnb in Feilding typically peaks in September and dips lowest during March. Leveraging Airbnb dynamic pricing tools or strategies based on this seasonality can significantly boost revenue. Here's a look at the typical nightly rates achieved:
- Best-in-class properties (Top 10%) command rates of $141+ per night, often due to premium features or locations.
- Strong performing properties (Top 25%) achieve nightly rates of $115 or more.
- Typical properties (Median) charge around $88 per night.
- Entry-level properties (Bottom 25%) earn around $53 per night.
Average Daily Rate (ADR) Trend by Month in Feilding
Get Live Feilding Market Intelligence 👇

Explore Real-time Analytics
Airbnb Seasonality Analysis & Trends in Feilding (2026)
Peak Season (December, May, March)
- Revenue averages $1,360 per month
- Occupancy rates average 42.9%
- Daily rates average $90
Shoulder Season
- Revenue averages $1,211 per month
- Occupancy maintains around 38.5%
- Daily rates hold near $92
Low Season (February, July, August)
- Revenue drops to average $999 per month
- Occupancy decreases to average 32.3%
- Daily rates adjust to average $92
Seasonality Insights for Feilding
- The Airbnb seasonality in Feilding shows moderate seasonality with distinct peak and low periods. While the sections above show seasonal averages, it's also insightful to look at the extremes:
- During the high season, the absolute peak month showcases Feilding's highest earning potential, with monthly revenues capable of climbing to $1,429, occupancy reaching a high of 47.0%, and ADRs peaking at $95.
- Conversely, the slowest single month of the year, typically falling within the low season, marks the market's lowest point. In this month, revenue might dip to $916, occupancy could drop to 24.8%, and ADRs may adjust down to $87.
- Understanding both the seasonal averages and these monthly peaks and troughs in revenue, occupancy, and ADR is crucial for maximizing your Airbnb profit potential in Feilding.
Seasonal Strategies for Maximizing Profit
- Peak Season: Maximize revenue through premium pricing and potentially longer minimum stays. Ensure high availability.
- Low Season: Offer competitive pricing, special promotions (e.g., extended stay discounts), and flexible cancellation policies. Target off-season travelers like remote workers or budget-conscious guests.
- Shoulder Seasons: Implement dynamic pricing that balances peak and low rates. Target weekend travelers or specific events. Offer slightly more flexible terms than peak season.
- Regularly analyze your own performance against these Feilding seasonality benchmarks and adjust your pricing and availability strategy accordingly.
Best Areas for Airbnb Investment in Feilding (2026)
Exploring the top neighborhoods for short-term rentals in Feilding? This section highlights key areas, outlining why they are attractive for hosts and guests, along with notable local attractions. Consider these locations based on your target guest profile and investment strategy.
| Neighborhood / Area | Why Host Here? (Target Guests & Appeal) | Key Attractions & Landmarks |
|---|---|---|
| Feilding Town Centre | Feilding's main hub with restaurants, shops, and community events. A great location for visitors wanting to experience the local culture and amenities. | Feilding Farmers' Market, Manawatu District Library, Feilding Art Centre, Victoria Park, Jubilee Park |
| Halcombe | A quaint rural village close to Feilding, appealing for those seeking a peaceful getaway. Offers a country charm with beautiful farmland views. | Halcombe Community Centre, Te Araroa Trail, local farms and orchards |
| Kimbolton | Known for its beautiful scenery and outdoor activities, Kimbolton attracts those interested in nature and adventure sports. | Kimbolton Domain, Mangatainoka River, local tramping tracks |
| Palmerston North | Nearby major city with a variety of attractions, making it a convenient stay for those visiting Feilding and the greater Manawatū region. | Te Manawa Museum, The Square, Palmerston North Regional Art Gallery, Victoria Esplanade |
| Ashhurst | Charming suburb of Palmerston North with access to outdoor adventures and a friendly community, ideal for families and nature lovers. | Ashhurst Domain, Manawatu Gorge, local cafes |
| Oroua Valley | A picturesque valley known for its vineyards and relaxed rural lifestyle, great for wine enthusiasts and those looking for tranquility. | local wineries, walking trails, stunning landscape views |
| Rangiwahia | A small settlement popular with nature lovers and hikers, providing access to the Ruahine Range and vibrant birdlife. | Ruahine Forest Park, walking tracks, scenic lookout points |
| Makai | A beautiful coastal area not far from Feilding, appealing for those who enjoy the beach and sea activities. | beach access, scenic walks, water sports |
Understanding Airbnb License Requirements & STR Laws in Feilding (2026)
While Feilding, Manawatū-Whanganui, New Zealand currently shows low STR regulations, specific Airbnb license requirements might still exist or change. Always verify the latest short term rental regulations and Airbnb license requirements directly with local government authorities for Feilding to ensure full compliance before hosting.
(Source: AirROI data, 2026, finding no licensed listings among those analyzed)
Top Performing Airbnb Properties in Feilding (2026)
Benchmark your potential! Explore examples of top-performing Airbnb properties in Feildingbased on Trailing Twelve Month (TTM) revenue. Analyze their characteristics, revenue, occupancy rate, and ADR to understand what drives success in this market.

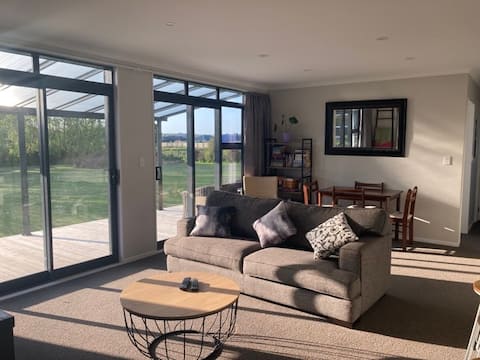
Private Central character
Entire Place • 3 bedrooms
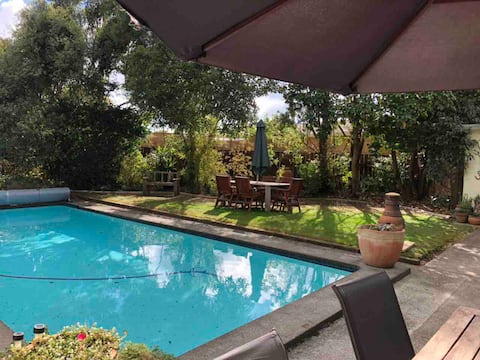
Sunny & Modern On A Peaceful Section
Entire Place • 3 bedrooms

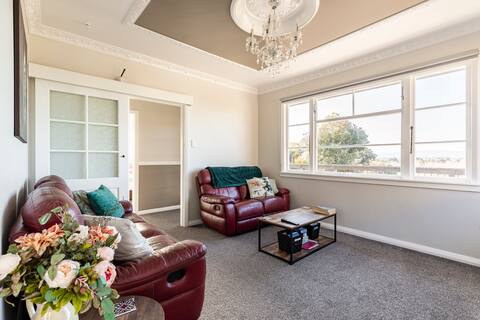
Romney Lane Homestead
Entire Place • 4 bedrooms
“Be our Guest” Air BnB
Entire Place • 3 bedrooms

Luxury house on the hill
Entire Place • 4 bedrooms
Bellview Cottage Feilding
Entire Place • 2 bedrooms
Note: Performance varies based on location, size, amenities, seasonality, and management quality. Data reflects the past 12 months.
Top Performing Airbnb Hosts in Feilding (2026)
Learn from the best! This table showcases top-performing Airbnb hosts in Feilding based on the number of properties managed and estimated total revenue over the past year. Analyze their scale and performance metrics.
| Host Name | Properties | Grossing Revenue | Stay Reviews | Avg Rating |
|---|---|---|---|---|
| Julie | 1 | $50,535 | 19 | 5.00/5.0 |
| Naomi | 2 | $39,798 | 758 | 4.97/5.0 |
| Katherine | 1 | $34,536 | 216 | 4.98/5.0 |
| Dwayne | 3 | $27,856 | 47 | 4.81/5.0 |
| Ian | 1 | $25,609 | 2 | Not Rated |
| Cecile | 1 | $25,374 | 235 | 4.95/5.0 |
| Stephen | 1 | $23,243 | 138 | 4.98/5.0 |
| Amber | 1 | $20,106 | 133 | 4.97/5.0 |
| Shayla | 1 | $18,808 | 11 | 5.00/5.0 |
| Alana | 1 | $18,633 | 120 | 4.98/5.0 |
Analyzing the strategies of top hosts, such as their property selection, pricing, and guest communication, can offer valuable lessons for optimizing your own Airbnb operations in Feilding.
Dive Deeper: Advanced Feilding STR Market Data (2026)
Ready to unlock more insights? AirROI provides access to advanced metrics and comprehensive Airbnb data for Feilding. Explore detailed analytics beyond this report to refine your investment strategy, optimize pricing, and maximize your vacation rental profits.
Explore Advanced MetricsFeilding Short-Term Rental Market Composition (2026): Property & Room Types
Room Type Distribution
Property Type Distribution
Market Composition Insights for Feilding
- The Feilding Airbnb market composition is heavily skewed towards Entire Home/Apt listings, which make up 64.9% of the 37 active rentals. This indicates strong guest preference for privacy and space.
- However, a notable 35.1% share for Private Rooms suggests opportunities for budget-conscious travelers or hosts renting out spare rooms.
- Looking at the property type distribution in Feilding, House properties are the most common (56.8%), reflecting the local real estate landscape.
- Houses represent a significant 56.8% portion, catering likely to families or larger groups.
- The presence of 21.6% Hotel/Boutique listings indicates integration with traditional hospitality.
Feilding Airbnb Room Capacity Analysis (2026): Bedroom Distribution
Distribution of Listings by Number of Bedrooms
Room Capacity Insights for Feilding
- The dominant room capacity in Feilding is 2 bedrooms listings, making up 29.7% of the market. This suggests a strong demand for properties suitable for couples or solo travelers.
- Together, 2 bedrooms and 1 bedroom properties represent 56.7% of the active Airbnb listings in Feilding, indicating a high concentration in these sizes.
- A significant 21.6% of listings offer 3+ bedrooms, catering to larger groups and families seeking more space in Feilding.
Feilding Vacation Rental Guest Capacity Trends (2026)
Distribution of Listings by Guest Capacity
Guest Capacity Insights for Feilding
- The most common guest capacity trend in Feilding vacation rentals is listings accommodating 2 guests (21.6%). This suggests the primary traveler segment is likely couples or solo travelers.
- Properties designed for 2 guests and 4 guests dominate the Feilding STR market, accounting for 40.5% of listings.
- 21.6% of properties accommodate 6+ guests, serving the market segment for larger families or group travel in Feilding.
- On average, properties in Feilding are equipped to host 2.8 guests.
Feilding Airbnb Booking Patterns (2026): Available vs. Booked Days
Available Days Distribution
Booked Days Distribution
Booking Pattern Insights for Feilding
- The most common availability pattern in Feilding falls within the 271-366 days range, representing 43.2% of listings. This suggests many properties have significant open periods on their calendars.
- Approximately 83.7% of listings show high availability (181+ days open annually), indicating potential for increased bookings or specific owner usage patterns.
- For booked days, the 91-180 days range is most frequent in Feilding (37.8%), reflecting common guest stay durations or potential owner blocking patterns.
- A notable 18.9% of properties secure long booking periods (181+ days booked per year), highlighting successful long-term rental strategies or significant owner usage.
Feilding Airbnb Minimum Stay Requirements Analysis
Distribution of Listings by Minimum Night Requirement
1 Night
23 listings
62.2% of total
2 Nights
5 listings
13.5% of total
3 Nights
1 listings
2.7% of total
30+ Nights
8 listings
21.6% of total
Key Insights
- The most prevalent minimum stay requirement in Feilding is 1 Night, adopted by 62.2% of listings. This highlights the market's preference for shorter, flexible bookings.
- A strong majority (75.7%) of the Feilding Airbnb data shows acceptance of very short stays (1-2 nights), indicating a dynamic, high-turnover market.
- A significant segment (21.6%) caters to monthly stays (30+ nights) in Feilding, pointing to opportunities in the extended-stay market.
Recommendations
- Align with the market by considering a 1 Night minimum stay, as 62.2% of Feilding hosts use this setting.
- Explore offering discounts for stays of 30+ nights to attract the 21.6% of the market seeking extended stays.
- Adjust minimum nights based on seasonality – potentially shorter during low season and longer during peak demand periods in Feilding.
Feilding Airbnb Cancellation Policy Trends Analysis (2026)
Limited
1 listings
2.7% of total
Flexible
17 listings
45.9% of total
Moderate
12 listings
32.4% of total
Firm
4 listings
10.8% of total
Strict
3 listings
8.1% of total
Cancellation Policy Insights for Feilding
- The prevailing Airbnb cancellation policy trend in Feilding is Flexible, used by 45.9% of listings.
- The market strongly favors guest-friendly terms, with 78.3% of listings offering Flexible or Moderate policies. This suggests guests in Feilding may expect booking flexibility.
- Strict cancellation policies are quite rare (8.1%), potentially making listings with this policy less competitive unless justified by high demand or property type.
Recommendations for Hosts
- Consider adopting a Flexible policy to align with the 45.9% market standard in Feilding.
- Using a Strict policy might deter some guests, as only 8.1% of listings use it. Evaluate if potential revenue protection outweighs possible lower booking rates.
- Regularly review your cancellation policy against competitors and market demand shifts in Feilding.
Feilding STR Booking Lead Time Analysis (2026)
Average Booking Lead Time by Month
Booking Lead Time Insights for Feilding
- The overall average booking lead time for vacation rentals in Feilding is 44 days.
- Guests book furthest in advance for stays during February (average 74 days), likely coinciding with peak travel demand or local events.
- The shortest booking windows occur for stays in July (average 19 days), indicating more last-minute travel plans during this time.
- Seasonally, Winter (61 days avg.) sees the longest lead times, while Summer (26 days avg.) has the shortest, reflecting typical travel planning cycles.
Recommendations for Hosts
- Use the overall average lead time (44 days) as a baseline for your pricing and availability strategy in Feilding.
- For February stays, consider implementing length-of-stay discounts or slightly higher rates for bookings made less than 74 days out to capitalize on advance planning.
- Target marketing efforts for the Winter season well in advance (at least 61 days) to capture early planners.
- Monitor your own booking lead times against these Feilding averages to identify opportunities for dynamic pricing adjustments.
Popular & Essential Airbnb Amenities in Feilding (2026)
Amenity Prevalence
Amenity Insights for Feilding
- Essential amenities in Feilding that guests expect include: Smoke alarm, TV. Lacking these (any) could significantly impact bookings.
- Popular amenities like Free parking on premises, Heating, Wifi are common but not universal. Offering these can provide a competitive edge.
- Warning: Wifi is not universally provided but is considered essential globally. Ensure reliable Wifi is offered.
Recommendations for Hosts
- Ensure your listing includes all essential amenities for Feilding: Smoke alarm, TV.
- Consider adding popular differentiators like Free parking on premises or Heating to increase appeal.
- Highlight unique or less common amenities you offer (e.g., hot tub, dedicated workspace, EV charger) in your listing description and photos.
- Regularly check competitor amenities in Feilding to stay competitive.
Feilding Airbnb Guest Demographics & Profile Analysis (2026)
Guest Profile Summary for Feilding
- The typical guest profile for Airbnb in Feilding consists of primarily domestic travelers (84%), often arriving from nearby Auckland, typically belonging to the Post-2000s (Gen Z/Alpha) group (50%), primarily speaking English or French.
- Domestic travelers account for 84.4% of guests.
- Key international markets include New Zealand (84.4%) and Australia (5.4%).
- Top languages spoken are English (84.9%) followed by French (3.4%).
- A significant demographic segment is the Post-2000s (Gen Z/Alpha) group, representing 50% of guests.
Recommendations for Hosts
- Target domestic marketing efforts towards travelers from Auckland and Wellington.
- Tailor amenities and listing descriptions to appeal to the dominant Post-2000s (Gen Z/Alpha) demographic (e.g., highlight fast WiFi, smart home features, local guides).
- Highlight unique local experiences or amenities relevant to the primary guest profile.
- Consider seasonal promotions aligned with peak travel times for key origin markets.
Nearby Short-Term Rental Market Comparison
How does the Feilding Airbnb market stack up against its neighbors? Compare key performance metrics like average monthly revenue, ADR, and occupancy rates in surrounding areas to understand the broader regional STR landscape.
| Market | Active Properties | Monthly Revenue | Daily Rate | Avg. Occupancy |
|---|---|---|---|---|
| Havelock North | 226 | $1,709 | $217.59 | 38% |
| Martinborough Community | 240 | $1,665 | $196.23 | 35% |
| Ōtaki | 20 | $1,644 | $136.02 | 35% |
| Picton | 111 | $1,609 | $165.16 | 43% |
| Waimārama | 50 | $1,577 | $365.34 | 24% |
| Ōtaki Beach | 31 | $1,486 | $160.18 | 38% |
| Paraparaumu | 139 | $1,473 | $154.10 | 40% |
| Egmont Village | 14 | $1,456 | $159.50 | 42% |
| Haumoana | 39 | $1,392 | $193.10 | 32% |
| Hastings | 173 | $1,386 | $176.50 | 37% |