Invercargill City Airbnb Market Analysis 2026: Short Term Rental Data & Vacation Rental Statistics in Southland, New Zealand
Is Airbnb profitable in Invercargill City in 2026? Explore comprehensive Airbnb analytics for Invercargill City, Southland, New Zealand to uncover income potential. This 2026 STR market report for Invercargill City, based on AirROI data from February 2025 to January 2026, reveals key trends in the niche market of 139 active listings.
Whether you're considering an Airbnb investment in Invercargill City, optimizing your existing vacation rental, or exploring rental arbitrage opportunities, understanding the Invercargill City Airbnb data is crucial. Leveraging the low regulation environment is key to maximizing your short term rental income potential. Let's dive into the specifics.
Key Invercargill City Airbnb Performance Metrics Overview
Monthly Airbnb Revenue Variations & Income Potential in Invercargill City (2026)
Understanding the monthly revenue variations for Airbnb listings in Invercargill City is key to maximizing your short term rental income potential. Seasonality significantly impacts earnings. Our analysis, based on data from the past 12 months, shows that the peak revenue month for STRs in Invercargill City is typically March, while September often presents the lowest earnings, highlighting opportunities for strategic pricing adjustments during shoulder and low seasons. Explore the typical Airbnb income in Invercargill City across different performance tiers:
- Best-in-class properties (Top 10%) achieve $2,885+ monthly, often utilizing dynamic pricing and superior guest experiences.
- Strong performing properties (Top 25%) earn $2,040 or more, indicating effective management and desirable locations/amenities.
- Typical properties (Median) generate around $1,268 per month, representing the average market performance.
- Entry-level properties (Bottom 25%) see earnings around $592, often with potential for optimization.
Average Monthly Airbnb Earnings Trend in Invercargill City
Invercargill City Airbnb Occupancy Rate Trends (2026)
Maximize your bookings by understanding the Invercargill City STR occupancy trends. Seasonal demand shifts significantly influence how often properties are booked. Typically, Marchsees the highest demand (peak season occupancy), while May experiences the lowest (low season). Effective strategies, like adjusting minimum stays or offering promotions, can boost occupancy during slower periods. Here's how different property tiers perform in Invercargill City:
- Best-in-class properties (Top 10%) achieve 82%+ occupancy, indicating high desirability and potentially optimized availability.
- Strong performing properties (Top 25%) maintain 66% or higher occupancy, suggesting good market fit and guest satisfaction.
- Typical properties (Median) have an occupancy rate around 44%.
- Entry-level properties (Bottom 25%) average 23% occupancy, potentially facing higher vacancy.
Average Monthly Occupancy Rate Trend in Invercargill City
Average Daily Rate (ADR) Airbnb Trends in Invercargill City (2026)
Effective short term rental pricing strategy in Invercargill City involves understanding monthly ADR fluctuations. The Average Daily Rate (ADR) for Airbnb in Invercargill City typically peaks in December and dips lowest during April. Leveraging Airbnb dynamic pricing tools or strategies based on this seasonality can significantly boost revenue. Here's a look at the typical nightly rates achieved:
- Best-in-class properties (Top 10%) command rates of $178+ per night, often due to premium features or locations.
- Strong performing properties (Top 25%) achieve nightly rates of $122 or more.
- Typical properties (Median) charge around $91 per night.
- Entry-level properties (Bottom 25%) earn around $69 per night.
Average Daily Rate (ADR) Trend by Month in Invercargill City
Get Live Invercargill City Market Intelligence 👇

Explore Real-time Analytics
Airbnb Seasonality Analysis & Trends in Invercargill City (2026)
Peak Season (March, December, June)
- Revenue averages $1,760 per month
- Occupancy rates average 50.6%
- Daily rates average $111
Shoulder Season
- Revenue averages $1,477 per month
- Occupancy maintains around 45.2%
- Daily rates hold near $111
Low Season (May, August, September)
- Revenue drops to average $1,299 per month
- Occupancy decreases to average 37.9%
- Daily rates adjust to average $111
Seasonality Insights for Invercargill City
- The Airbnb seasonality in Invercargill City shows moderate seasonality with distinct peak and low periods. While the sections above show seasonal averages, it's also insightful to look at the extremes:
- During the high season, the absolute peak month showcases Invercargill City's highest earning potential, with monthly revenues capable of climbing to $1,893, occupancy reaching a high of 59.1%, and ADRs peaking at $113.
- Conversely, the slowest single month of the year, typically falling within the low season, marks the market's lowest point. In this month, revenue might dip to $1,273, occupancy could drop to 37.3%, and ADRs may adjust down to $106.
- Understanding both the seasonal averages and these monthly peaks and troughs in revenue, occupancy, and ADR is crucial for maximizing your Airbnb profit potential in Invercargill City.
Seasonal Strategies for Maximizing Profit
- Peak Season: Maximize revenue through premium pricing and potentially longer minimum stays. Ensure high availability.
- Low Season: Offer competitive pricing, special promotions (e.g., extended stay discounts), and flexible cancellation policies. Target off-season travelers like remote workers or budget-conscious guests.
- Shoulder Seasons: Implement dynamic pricing that balances peak and low rates. Target weekend travelers or specific events. Offer slightly more flexible terms than peak season.
- Regularly analyze your own performance against these Invercargill City seasonality benchmarks and adjust your pricing and availability strategy accordingly.
Best Areas for Airbnb Investment in Invercargill City (2026)
Exploring the top neighborhoods for short-term rentals in Invercargill City? This section highlights key areas, outlining why they are attractive for hosts and guests, along with notable local attractions. Consider these locations based on your target guest profile and investment strategy.
| Neighborhood / Area | Why Host Here? (Target Guests & Appeal) | Key Attractions & Landmarks |
|---|---|---|
| Central Invercargill | The heart of Invercargill, offering easy access to shopping, dining, and local attractions. Ideal for guests who want to explore the city on foot and enjoy urban amenities. | Invercargill City Libraries, Southland Art Gallery, Queens Park, Wallacetown Domain, transport links and major services |
| Queens Park | A beautiful heritage park located in the heart of the city, popular among families and travelers looking for outdoor activities and scenic beauty. Close to key attractions and green spaces. | Queens Park, Invercargill Golf Club, E. Hayes and Sons - The World's Fastest Indian, Southland Museum and Art Gallery, Children's playground |
| Omaui | A coastal village known for its stunning beach and peaceful surroundings, perfect for guests looking for relaxation and outdoor adventures near the Otatara wetlands. | Omaui Beach, Otatara Wetlands, walking trails, fishing spots, local wildlife |
| Bluff | Famous for its seafood and stunning coastal views, Bluff attracts tourists looking to enjoy fresh oysters and experience the local maritime culture and history. | Bluff Lookout, Bluff Maritime Museum, Foveaux Strait, Stirling Point, oyster farms |
| Riverton | A charming coastal town with a rich history and vibrant arts community, ideal for guests interested in relaxing by the beach and exploring local art and culture. | Riverton Beach, Riverton Heritage Walk, local art galleries, jetties and fishing spots, scenic views |
| Gore | Known for its agricultural surroundings and as a gateway to Southland attractions, Gore offers rural charm and is popular for those looking to explore the countryside and outdoor activities. | Gore's local arts community, Hokonui Moonshine Museum, Gore Gardens, fishing and hunting, rural landscapes |
| Invercargill Airport Area | A convenient location for travelers arriving in and out of the region, making it practical for short-term stays with easy access to transportation. | Invercargill Airport, local parks, transport hubs, restaurants and cafes nearby, proximity to the city |
| The Southern Scenic Route | A stunning route that showcases the best of the Southland landscape, popular for travelers looking to explore the beautiful scenery and natural attractions of the region. | Curio Bay, The Catlins, Papatowai Beach, Nugget Point, variations of scenic walks and hikes |
Understanding Airbnb License Requirements & STR Laws in Invercargill City (2026)
While Invercargill City, Southland, New Zealand currently shows low STR regulations, specific Airbnb license requirements might still exist or change. Always verify the latest short term rental regulations and Airbnb license requirements directly with local government authorities for Invercargill City to ensure full compliance before hosting.
(Source: AirROI data, 2026, finding no licensed listings among those analyzed)
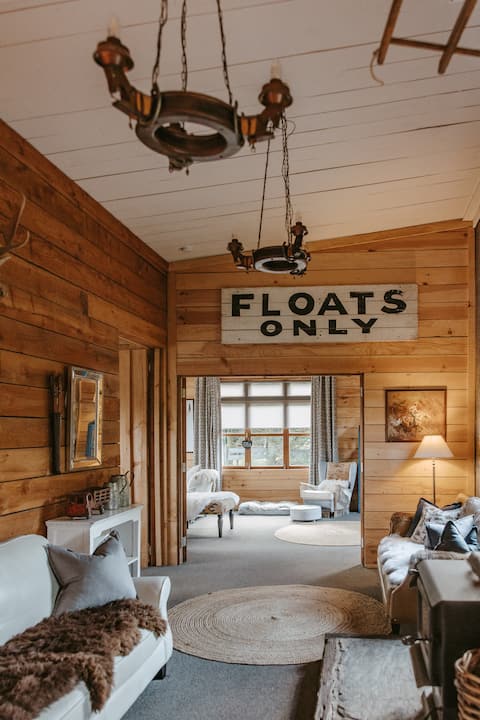
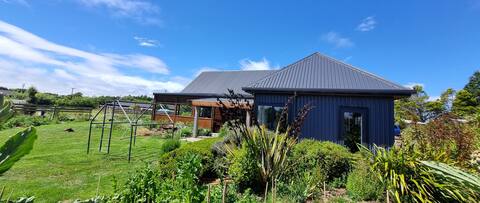
Top Performing Airbnb Properties in Invercargill City (2026)
Benchmark your potential! Explore examples of top-performing Airbnb properties in Invercargill Citybased on Trailing Twelve Month (TTM) revenue. Analyze their characteristics, revenue, occupancy rate, and ADR to understand what drives success in this market.

Modern 4 Bedroom Home with Space and Convenience
Entire Place • 4 bedrooms

Brand new on Arthur
Entire Place • 3 bedrooms
Sweet Southern Hideaway - Invercargill-Otatara
Entire Place • 3 bedrooms

Space and comfort on Anglem Street.
Entire Place • 4 bedrooms
Modern Otatara Retreat
Entire Place • 4 bedrooms

Rural living but close to town!
Entire Place • 4 bedrooms
Note: Performance varies based on location, size, amenities, seasonality, and management quality. Data reflects the past 12 months.
Top Performing Airbnb Hosts in Invercargill City (2026)
Learn from the best! This table showcases top-performing Airbnb hosts in Invercargill City based on the number of properties managed and estimated total revenue over the past year. Analyze their scale and performance metrics.
| Host Name | Properties | Grossing Revenue | Stay Reviews | Avg Rating |
|---|---|---|---|---|
| Jade & Carla | 6 | $116,447 | 176 | 4.83/5.0 |
| Johanna | 4 | $88,117 | 879 | 4.93/5.0 |
| Carol | 2 | $67,938 | 15 | 4.75/5.0 |
| Ben | 1 | $54,629 | 80 | 4.90/5.0 |
| The Lodges | 2 | $54,243 | 87 | 4.80/5.0 |
| Emily Jane | 1 | $53,395 | 100 | 4.94/5.0 |
| Jenny | 2 | $52,432 | 646 | 4.97/5.0 |
| Kristin | 1 | $50,676 | 63 | 4.98/5.0 |
| Mark | 6 | $49,232 | 1010 | 4.90/5.0 |
| Stephen | 2 | $47,955 | 800 | 4.89/5.0 |
Analyzing the strategies of top hosts, such as their property selection, pricing, and guest communication, can offer valuable lessons for optimizing your own Airbnb operations in Invercargill City.
Dive Deeper: Advanced Invercargill City STR Market Data (2026)
Ready to unlock more insights? AirROI provides access to advanced metrics and comprehensive Airbnb data for Invercargill City. Explore detailed analytics beyond this report to refine your investment strategy, optimize pricing, and maximize your vacation rental profits.
Explore Advanced MetricsInvercargill City Short-Term Rental Market Composition (2026): Property & Room Types
Room Type Distribution
Property Type Distribution
Market Composition Insights for Invercargill City
- The Invercargill City Airbnb market composition is heavily skewed towards Entire Home/Apt listings, which make up 71.9% of the 139 active rentals. This indicates strong guest preference for privacy and space.
- Looking at the property type distribution in Invercargill City, House properties are the most common (63.3%), reflecting the local real estate landscape.
- Houses represent a significant 63.3% portion, catering likely to families or larger groups.
- The presence of 15.1% Hotel/Boutique listings indicates integration with traditional hospitality.
- Smaller segments like outdoor/unique, unique stays (combined 3.6%) offer potential for unique stay experiences.
Invercargill City Airbnb Room Capacity Analysis (2026): Bedroom Distribution
Distribution of Listings by Number of Bedrooms
Room Capacity Insights for Invercargill City
- The dominant room capacity in Invercargill City is 2 bedrooms listings, making up 25.2% of the market. This suggests a strong demand for properties suitable for couples or solo travelers.
- Together, 2 bedrooms and 1 bedroom properties represent 48.9% of the active Airbnb listings in Invercargill City, indicating a high concentration in these sizes.
- A significant 27.3% of listings offer 3+ bedrooms, catering to larger groups and families seeking more space in Invercargill City.
Invercargill City Vacation Rental Guest Capacity Trends (2026)
Distribution of Listings by Guest Capacity
Guest Capacity Insights for Invercargill City
- The most common guest capacity trend in Invercargill City vacation rentals is listings accommodating 2 guests (20.1%). This suggests the primary traveler segment is likely couples or solo travelers.
- Properties designed for 2 guests and 4 guests dominate the Invercargill City STR market, accounting for 38.8% of listings.
- 27.4% of properties accommodate 6+ guests, serving the market segment for larger families or group travel in Invercargill City.
- On average, properties in Invercargill City are equipped to host 3.4 guests.
Invercargill City Airbnb Booking Patterns (2026): Available vs. Booked Days
Available Days Distribution
Booked Days Distribution
Booking Pattern Insights for Invercargill City
- The most common availability pattern in Invercargill City falls within the 271-366 days range, representing 36.7% of listings. This suggests many properties have significant open periods on their calendars.
- Approximately 72.7% of listings show high availability (181+ days open annually), indicating potential for increased bookings or specific owner usage patterns.
- For booked days, the 91-180 days range is most frequent in Invercargill City (36.7%), reflecting common guest stay durations or potential owner blocking patterns.
- A notable 28.1% of properties secure long booking periods (181+ days booked per year), highlighting successful long-term rental strategies or significant owner usage.
Invercargill City Airbnb Minimum Stay Requirements Analysis
Distribution of Listings by Minimum Night Requirement
1 Night
79 listings
56.8% of total
2 Nights
33 listings
23.7% of total
3 Nights
3 listings
2.2% of total
4-6 Nights
1 listings
0.7% of total
30+ Nights
23 listings
16.5% of total
Key Insights
- The most prevalent minimum stay requirement in Invercargill City is 1 Night, adopted by 56.8% of listings. This highlights the market's preference for shorter, flexible bookings.
- A strong majority (80.5%) of the Invercargill City Airbnb data shows acceptance of very short stays (1-2 nights), indicating a dynamic, high-turnover market.
- A significant segment (16.5%) caters to monthly stays (30+ nights) in Invercargill City, pointing to opportunities in the extended-stay market.
Recommendations
- Align with the market by considering a 1 Night minimum stay, as 56.8% of Invercargill City hosts use this setting.
- Explore offering discounts for stays of 30+ nights to attract the 16.5% of the market seeking extended stays.
- Adjust minimum nights based on seasonality – potentially shorter during low season and longer during peak demand periods in Invercargill City.
Invercargill City Airbnb Cancellation Policy Trends Analysis (2026)
Super Strict 30 Days
1 listings
0.7% of total
Flexible
68 listings
48.9% of total
Moderate
42 listings
30.2% of total
Firm
21 listings
15.1% of total
Strict
7 listings
5% of total
Cancellation Policy Insights for Invercargill City
- The prevailing Airbnb cancellation policy trend in Invercargill City is Flexible, used by 48.9% of listings.
- The market strongly favors guest-friendly terms, with 79.1% of listings offering Flexible or Moderate policies. This suggests guests in Invercargill City may expect booking flexibility.
- Strict cancellation policies are quite rare (5%), potentially making listings with this policy less competitive unless justified by high demand or property type.
Recommendations for Hosts
- Consider adopting a Flexible policy to align with the 48.9% market standard in Invercargill City.
- Using a Strict policy might deter some guests, as only 5% of listings use it. Evaluate if potential revenue protection outweighs possible lower booking rates.
- Regularly review your cancellation policy against competitors and market demand shifts in Invercargill City.
Invercargill City STR Booking Lead Time Analysis (2026)
Average Booking Lead Time by Month
Booking Lead Time Insights for Invercargill City
- The overall average booking lead time for vacation rentals in Invercargill City is 52 days.
- Guests book furthest in advance for stays during December (average 74 days), likely coinciding with peak travel demand or local events.
- The shortest booking windows occur for stays in June (average 28 days), indicating more last-minute travel plans during this time.
- Seasonally, Winter (70 days avg.) sees the longest lead times, while Summer (33 days avg.) has the shortest, reflecting typical travel planning cycles.
Recommendations for Hosts
- Use the overall average lead time (52 days) as a baseline for your pricing and availability strategy in Invercargill City.
- For December stays, consider implementing length-of-stay discounts or slightly higher rates for bookings made less than 74 days out to capitalize on advance planning.
- Target marketing efforts for the Winter season well in advance (at least 70 days) to capture early planners.
- Monitor your own booking lead times against these Invercargill City averages to identify opportunities for dynamic pricing adjustments.
Popular & Essential Airbnb Amenities in Invercargill City (2026)
Amenity Prevalence
Amenity Insights for Invercargill City
- Essential amenities in Invercargill City that guests expect include: Wifi, Smoke alarm, TV. Lacking these (any) could significantly impact bookings.
- Popular amenities like Heating, Free parking on premises, Hot water are common but not universal. Offering these can provide a competitive edge.
Recommendations for Hosts
- Ensure your listing includes all essential amenities for Invercargill City: Wifi, Smoke alarm, TV.
- Prioritize adding missing essentials: Smoke alarm, TV.
- Consider adding popular differentiators like Heating or Free parking on premises to increase appeal.
- Highlight unique or less common amenities you offer (e.g., hot tub, dedicated workspace, EV charger) in your listing description and photos.
- Regularly check competitor amenities in Invercargill City to stay competitive.
Invercargill City Airbnb Guest Demographics & Profile Analysis (2026)
Guest Profile Summary for Invercargill City
- The typical guest profile for Airbnb in Invercargill City consists of a mix of domestic (61%) and international guests, often arriving from nearby Auckland, typically belonging to the Post-2000s (Gen Z/Alpha) group (50%), primarily speaking English or Chinese.
- Domestic travelers account for 60.6% of guests.
- Key international markets include New Zealand (60.6%) and Australia (13.9%).
- Top languages spoken are English (68.2%) followed by Chinese (6.9%).
- A significant demographic segment is the Post-2000s (Gen Z/Alpha) group, representing 50% of guests.
Recommendations for Hosts
- Target domestic marketing efforts towards travelers from Auckland and Christchurch.
- Tailor amenities and listing descriptions to appeal to the dominant Post-2000s (Gen Z/Alpha) demographic (e.g., highlight fast WiFi, smart home features, local guides).
- Highlight unique local experiences or amenities relevant to the primary guest profile.
- Consider seasonal promotions aligned with peak travel times for key origin markets.
Nearby Short-Term Rental Market Comparison
How does the Invercargill City Airbnb market stack up against its neighbors? Compare key performance metrics like average monthly revenue, ADR, and occupancy rates in surrounding areas to understand the broader regional STR landscape.
| Market | Active Properties | Monthly Revenue | Daily Rate | Avg. Occupancy |
|---|---|---|---|---|
| Queenstown | 2,391 | $4,767 | $355.38 | 55% |
| Kawarau Falls | 23 | $4,070 | $508.60 | 49% |
| Closeburn | 10 | $3,606 | $291.60 | 54% |
| Jacks Point | 217 | $2,567 | $289.57 | 50% |
| Mount Creighton | 21 | $2,490 | $223.39 | 48% |
| Stewart Island / Rakiura Community | 32 | $2,368 | $215.56 | 48% |
| Fiordland Community | 379 | $2,282 | $171.32 | 54% |
| Gibbston | 15 | $2,191 | $219.77 | 46% |
| Lower Shotover | 40 | $2,076 | $267.62 | 47% |
| Kingston | 20 | $1,742 | $158.57 | 45% |