Saint Arnaud Airbnb Market Analysis 2026: Short Term Rental Data & Vacation Rental Statistics in Tasman, New Zealand
Is Airbnb profitable in Saint Arnaud in 2026? Explore comprehensive Airbnb analytics for Saint Arnaud, Tasman, New Zealand to uncover income potential. This 2026 STR market report for Saint Arnaud, based on AirROI data from February 2025 to January 2026, reveals key trends in the niche market of 21 active listings.
Whether you're considering an Airbnb investment in Saint Arnaud, optimizing your existing vacation rental, or exploring rental arbitrage opportunities, understanding the Saint Arnaud Airbnb data is crucial. Leveraging the low regulation environment is key to maximizing your short term rental income potential. Let's dive into the specifics.
Key Saint Arnaud Airbnb Performance Metrics Overview
Monthly Airbnb Revenue Variations & Income Potential in Saint Arnaud (2026)
Understanding the monthly revenue variations for Airbnb listings in Saint Arnaud is key to maximizing your short term rental income potential. Seasonality significantly impacts earnings. Our analysis, based on data from the past 12 months, shows that the peak revenue month for STRs in Saint Arnaud is typically February, while September often presents the lowest earnings, highlighting opportunities for strategic pricing adjustments during shoulder and low seasons. Explore the typical Airbnb income in Saint Arnaud across different performance tiers:
- Best-in-class properties (Top 10%) achieve $3,960+ monthly, often utilizing dynamic pricing and superior guest experiences.
- Strong performing properties (Top 25%) earn $2,610 or more, indicating effective management and desirable locations/amenities.
- Typical properties (Median) generate around $1,624 per month, representing the average market performance.
- Entry-level properties (Bottom 25%) see earnings around $1,030, often with potential for optimization.
Average Monthly Airbnb Earnings Trend in Saint Arnaud
Saint Arnaud Airbnb Occupancy Rate Trends (2026)
Maximize your bookings by understanding the Saint Arnaud STR occupancy trends. Seasonal demand shifts significantly influence how often properties are booked. Typically, Februarysees the highest demand (peak season occupancy), while September experiences the lowest (low season). Effective strategies, like adjusting minimum stays or offering promotions, can boost occupancy during slower periods. Here's how different property tiers perform in Saint Arnaud:
- Best-in-class properties (Top 10%) achieve 77%+ occupancy, indicating high desirability and potentially optimized availability.
- Strong performing properties (Top 25%) maintain 62% or higher occupancy, suggesting good market fit and guest satisfaction.
- Typical properties (Median) have an occupancy rate around 45%.
- Entry-level properties (Bottom 25%) average 29% occupancy, potentially facing higher vacancy.
Average Monthly Occupancy Rate Trend in Saint Arnaud
Average Daily Rate (ADR) Airbnb Trends in Saint Arnaud (2026)
Effective short term rental pricing strategy in Saint Arnaud involves understanding monthly ADR fluctuations. The Average Daily Rate (ADR) for Airbnb in Saint Arnaud typically peaks in December and dips lowest during April. Leveraging Airbnb dynamic pricing tools or strategies based on this seasonality can significantly boost revenue. Here's a look at the typical nightly rates achieved:
- Best-in-class properties (Top 10%) command rates of $188+ per night, often due to premium features or locations.
- Strong performing properties (Top 25%) achieve nightly rates of $164 or more.
- Typical properties (Median) charge around $143 per night.
- Entry-level properties (Bottom 25%) earn around $109 per night.
Average Daily Rate (ADR) Trend by Month in Saint Arnaud
Get Live Saint Arnaud Market Intelligence 👇

Explore Real-time Analytics
Airbnb Seasonality Analysis & Trends in Saint Arnaud (2026)
Peak Season (February, December, January)
- Revenue averages $2,996 per month
- Occupancy rates average 66.8%
- Daily rates average $144
Shoulder Season
- Revenue averages $2,147 per month
- Occupancy maintains around 45.6%
- Daily rates hold near $140
Low Season (August, September, October)
- Revenue drops to average $1,205 per month
- Occupancy decreases to average 27.1%
- Daily rates adjust to average $145
Seasonality Insights for Saint Arnaud
- The Airbnb seasonality in Saint Arnaud shows highly seasonal trends requiring careful strategy. While the sections above show seasonal averages, it's also insightful to look at the extremes:
- During the high season, the absolute peak month showcases Saint Arnaud's highest earning potential, with monthly revenues capable of climbing to $3,113, occupancy reaching a high of 74.4%, and ADRs peaking at $148.
- Conversely, the slowest single month of the year, typically falling within the low season, marks the market's lowest point. In this month, revenue might dip to $1,077, occupancy could drop to 25.6%, and ADRs may adjust down to $134.
- Understanding both the seasonal averages and these monthly peaks and troughs in revenue, occupancy, and ADR is crucial for maximizing your Airbnb profit potential in Saint Arnaud.
Seasonal Strategies for Maximizing Profit
- Peak Season: Maximize revenue through premium pricing and potentially longer minimum stays. Ensure high availability.
- Low Season: Offer competitive pricing, special promotions (e.g., extended stay discounts), and flexible cancellation policies. Target off-season travelers like remote workers or budget-conscious guests.
- Shoulder Seasons: Implement dynamic pricing that balances peak and low rates. Target weekend travelers or specific events. Offer slightly more flexible terms than peak season.
- Regularly analyze your own performance against these Saint Arnaud seasonality benchmarks and adjust your pricing and availability strategy accordingly.
Best Areas for Airbnb Investment in Saint Arnaud (2026)
Exploring the top neighborhoods for short-term rentals in Saint Arnaud? This section highlights key areas, outlining why they are attractive for hosts and guests, along with notable local attractions. Consider these locations based on your target guest profile and investment strategy.
| Neighborhood / Area | Why Host Here? (Target Guests & Appeal) | Key Attractions & Landmarks |
|---|---|---|
| Saint Arnaud Village | The picturesque village offers a serene environment near Lake Rotoiti, making it perfect for visitors looking for outdoor activities and a peaceful escape. | Lake Rotoiti, Saint Arnaud Range, Rotoiti Lodge, Golden Bay, Nelson Lakes National Park |
| Lake Rotoiti | Known for its stunning natural beauty, Lake Rotoiti attracts nature lovers and water sports enthusiasts. Ideal for kayaking, fishing, and hiking visitors. | Rotoiti Nature Recovery Project, Canoeing and kayaking, Hiking tracks, Fishing spots, Scenic picnic areas |
| Nelson Lakes National Park | A renowned national park with breathtaking landscapes, perfect for hikers and outdoor adventurers. Popular for camping and exploring the native forests. | Lake Rotoroa, Flora and Fauna walks, Hiking trails, Camping sites, Birdwatching opportunities |
| St. Arnaud Track | A well-known hiking track that offers stunning views and encounters with native wildlife, attracting hikers from various regions. | St. Arnaud Track access, Viewpoint at St. Arnaud, Birdwatching along the track, Nature walks, Photography spots |
| Mount Robert | Offers spectacular alpine scenery and is a great location for trekking enthusiasts, providing a range of outdoor recreational activities. | Mount Robert Track, Stunning panoramic views, Diverse alpine flora, Photography opportunities, Picnic areas |
| Saint Arnaud Scenic Drive | A scenic route that showcases the beautiful landscapes of the region, making it a popular choice for those looking to explore by car or bike. | Scenic viewpoints, Mini hikes along the route, Wildlife spotting, Picnic areas, Photography spots |
| Rotoiti Lodge | A cozy lodging option for those looking for a unique stay experience near the lake, with nature at the doorstep and outdoor activities nearby. | Lodging experience, Access to hiking and nature, Local cuisine, Relaxing by the lake, Easy access to local attractions |
| Golden Bay | Located a bit further but offers stunning beaches and is a popular tourist destination, known for its natural beauty and art scene. | Beaches, Art galleries, Local eateries, Outdoor activities, Scenic landscapes |
Understanding Airbnb License Requirements & STR Laws in Saint Arnaud (2026)
While Saint Arnaud, Tasman, New Zealand currently shows low STR regulations, specific Airbnb license requirements might still exist or change. Always verify the latest short term rental regulations and Airbnb license requirements directly with local government authorities for Saint Arnaud to ensure full compliance before hosting.
(Source: AirROI data, 2026, finding no licensed listings among those analyzed)
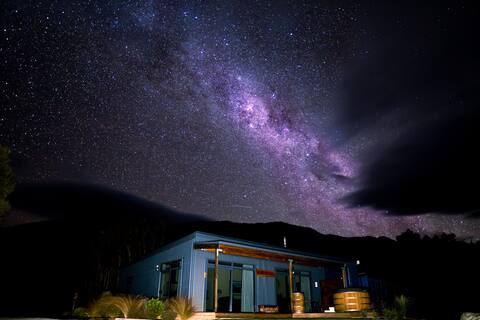
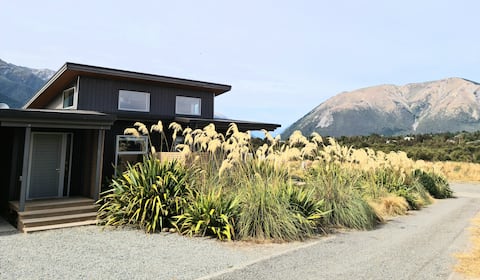
Top Performing Airbnb Properties in Saint Arnaud (2026)
Benchmark your potential! Explore examples of top-performing Airbnb properties in Saint Arnaudbased on Trailing Twelve Month (TTM) revenue. Analyze their characteristics, revenue, occupancy rate, and ADR to understand what drives success in this market.
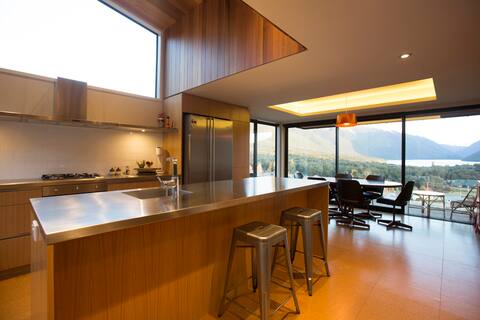
Award Winning Lake & Mountain Panorama
Entire Place • 4 bedrooms
The Woodsman's Den, St Arnaud, Nelson Lakes
Entire Place • 2 bedrooms
Beech Haven - Modern, in the heart of the village
Entire Place • 3 bedrooms

The Bach
Entire Place • 2 bedrooms

Cats and Squirrels. Farmhouse.
Entire Place • 4 bedrooms

Belmont - Sunny Cottage with a View
Entire Place • 2 bedrooms
Note: Performance varies based on location, size, amenities, seasonality, and management quality. Data reflects the past 12 months.
Top Performing Airbnb Hosts in Saint Arnaud (2026)
Learn from the best! This table showcases top-performing Airbnb hosts in Saint Arnaud based on the number of properties managed and estimated total revenue over the past year. Analyze their scale and performance metrics.
| Host Name | Properties | Grossing Revenue | Stay Reviews | Avg Rating |
|---|---|---|---|---|
| Ben And Marcia | 1 | $71,689 | 70 | 4.91/5.0 |
| Anna | 1 | $54,545 | 169 | 4.99/5.0 |
| Erin | 1 | $38,115 | 61 | 4.98/5.0 |
| Pip | 1 | $27,848 | 280 | 4.97/5.0 |
| David | 2 | $26,802 | 367 | 4.95/5.0 |
| Richard | 1 | $25,854 | 12 | 4.67/5.0 |
| Natalie | 1 | $25,061 | 194 | 4.69/5.0 |
| Gisela | 1 | $25,033 | 63 | 4.92/5.0 |
| Andrew | 1 | $20,557 | 215 | 4.96/5.0 |
| Shyamala | 1 | $15,996 | 177 | 4.89/5.0 |
Analyzing the strategies of top hosts, such as their property selection, pricing, and guest communication, can offer valuable lessons for optimizing your own Airbnb operations in Saint Arnaud.
Dive Deeper: Advanced Saint Arnaud STR Market Data (2026)
Ready to unlock more insights? AirROI provides access to advanced metrics and comprehensive Airbnb data for Saint Arnaud. Explore detailed analytics beyond this report to refine your investment strategy, optimize pricing, and maximize your vacation rental profits.
Explore Advanced MetricsSaint Arnaud Short-Term Rental Market Composition (2026): Property & Room Types
Room Type Distribution
Property Type Distribution
Market Composition Insights for Saint Arnaud
- The Saint Arnaud Airbnb market composition is heavily skewed towards Entire Home/Apt listings, which make up 90.5% of the 21 active rentals. This indicates strong guest preference for privacy and space.
- Looking at the property type distribution in Saint Arnaud, House properties are the most common (76.2%), reflecting the local real estate landscape.
- Houses represent a significant 76.2% portion, catering likely to families or larger groups.
- The presence of 19% Hotel/Boutique listings indicates integration with traditional hospitality.
- Smaller segments like others (combined 4.8%) offer potential for unique stay experiences.
Saint Arnaud Airbnb Room Capacity Analysis (2026): Bedroom Distribution
Distribution of Listings by Number of Bedrooms
Room Capacity Insights for Saint Arnaud
- The dominant room capacity in Saint Arnaud is 3 bedrooms listings, making up 52.4% of the market. This suggests a strong demand for properties suitable for families or small groups.
- Together, 3 bedrooms and 2 bedrooms properties represent 76.2% of the active Airbnb listings in Saint Arnaud, indicating a high concentration in these sizes.
- A significant 61.9% of listings offer 3+ bedrooms, catering to larger groups and families seeking more space in Saint Arnaud.
Saint Arnaud Vacation Rental Guest Capacity Trends (2026)
Distribution of Listings by Guest Capacity
Guest Capacity Insights for Saint Arnaud
- The most common guest capacity trend in Saint Arnaud vacation rentals is listings accommodating 6 guests (47.6%). This suggests the primary traveler segment is likely larger groups.
- Properties designed for 6 guests and 4 guests dominate the Saint Arnaud STR market, accounting for 66.6% of listings.
- 57.1% of properties accommodate 6+ guests, serving the market segment for larger families or group travel in Saint Arnaud.
- On average, properties in Saint Arnaud are equipped to host 5.0 guests.
Saint Arnaud Airbnb Booking Patterns (2026): Available vs. Booked Days
Available Days Distribution
Booked Days Distribution
Booking Pattern Insights for Saint Arnaud
- The most common availability pattern in Saint Arnaud falls within the 181-270 days range, representing 52.4% of listings. This suggests many properties have significant open periods on their calendars.
- Approximately 71.4% of listings show high availability (181+ days open annually), indicating potential for increased bookings or specific owner usage patterns.
- For booked days, the 91-180 days range is most frequent in Saint Arnaud (52.4%), reflecting common guest stay durations or potential owner blocking patterns.
- A notable 28.6% of properties secure long booking periods (181+ days booked per year), highlighting successful long-term rental strategies or significant owner usage.
Saint Arnaud Airbnb Minimum Stay Requirements Analysis
Distribution of Listings by Minimum Night Requirement
1 Night
5 listings
23.8% of total
2 Nights
10 listings
47.6% of total
3 Nights
1 listings
4.8% of total
30+ Nights
5 listings
23.8% of total
Key Insights
- The most prevalent minimum stay requirement in Saint Arnaud is 2 Nights, adopted by 47.6% of listings. This highlights the market's preference for shorter, flexible bookings.
- A strong majority (71.4%) of the Saint Arnaud Airbnb data shows acceptance of very short stays (1-2 nights), indicating a dynamic, high-turnover market.
- A significant segment (23.8%) caters to monthly stays (30+ nights) in Saint Arnaud, pointing to opportunities in the extended-stay market.
Recommendations
- Align with the market by considering a 2 Nights minimum stay, as 47.6% of Saint Arnaud hosts use this setting.
- If feasible, allowing 1-night stays, especially midweek or during low season, could capture last-minute bookings, as only 23.8% currently do.
- Explore offering discounts for stays of 30+ nights to attract the 23.8% of the market seeking extended stays.
- Adjust minimum nights based on seasonality – potentially shorter during low season and longer during peak demand periods in Saint Arnaud.
Saint Arnaud Airbnb Cancellation Policy Trends Analysis (2026)
Limited
1 listings
4.8% of total
Flexible
1 listings
4.8% of total
Moderate
10 listings
47.6% of total
Firm
8 listings
38.1% of total
Strict
1 listings
4.8% of total
Cancellation Policy Insights for Saint Arnaud
- The prevailing Airbnb cancellation policy trend in Saint Arnaud is Moderate, used by 47.6% of listings.
- There's a relatively balanced mix between guest-friendly (52.4%) and stricter (42.9%) policies, offering choices for different guest needs.
- Strict cancellation policies are quite rare (4.8%), potentially making listings with this policy less competitive unless justified by high demand or property type.
Recommendations for Hosts
- Consider adopting a Moderate policy to align with the 47.6% market standard in Saint Arnaud.
- Using a Strict policy might deter some guests, as only 4.8% of listings use it. Evaluate if potential revenue protection outweighs possible lower booking rates.
- Regularly review your cancellation policy against competitors and market demand shifts in Saint Arnaud.
Saint Arnaud STR Booking Lead Time Analysis (2026)
Average Booking Lead Time by Month
Booking Lead Time Insights for Saint Arnaud
- The overall average booking lead time for vacation rentals in Saint Arnaud is 76 days.
- Guests book furthest in advance for stays during December (average 119 days), likely coinciding with peak travel demand or local events.
- The shortest booking windows occur for stays in May (average 41 days), indicating more last-minute travel plans during this time.
- Seasonally, Winter (101 days avg.) sees the longest lead times, while Summer (43 days avg.) has the shortest, reflecting typical travel planning cycles.
Recommendations for Hosts
- Use the overall average lead time (76 days) as a baseline for your pricing and availability strategy in Saint Arnaud.
- For December stays, consider implementing length-of-stay discounts or slightly higher rates for bookings made less than 119 days out to capitalize on advance planning.
- Target marketing efforts for the Winter season well in advance (at least 101 days) to capture early planners.
- Monitor your own booking lead times against these Saint Arnaud averages to identify opportunities for dynamic pricing adjustments.
Popular & Essential Airbnb Amenities in Saint Arnaud (2026)
Amenity Prevalence
Amenity Insights for Saint Arnaud
- Essential amenities in Saint Arnaud that guests expect include: Free parking on premises, Smoke alarm, Heating. Lacking these (any) could significantly impact bookings.
- Popular amenities like Kitchen, Refrigerator, Hot water are common but not universal. Offering these can provide a competitive edge.
Recommendations for Hosts
- Ensure your listing includes all essential amenities for Saint Arnaud: Free parking on premises, Smoke alarm, Heating.
- Prioritize adding missing essentials: Heating.
- Consider adding popular differentiators like Kitchen or Refrigerator to increase appeal.
- Highlight unique or less common amenities you offer (e.g., hot tub, dedicated workspace, EV charger) in your listing description and photos.
- Regularly check competitor amenities in Saint Arnaud to stay competitive.
Saint Arnaud Airbnb Guest Demographics & Profile Analysis (2026)
Guest Profile Summary for Saint Arnaud
- The typical guest profile for Airbnb in Saint Arnaud consists of a mix of domestic (43%) and international guests, with top international origins including United States, typically belonging to the Post-2000s (Gen Z/Alpha) group (50%), primarily speaking English or French.
- Domestic travelers account for 43.4% of guests.
- Key international markets include New Zealand (43.4%) and United States (17.5%).
- Top languages spoken are English (60%) followed by French (8.8%).
- A significant demographic segment is the Post-2000s (Gen Z/Alpha) group, representing 50% of guests.
Recommendations for Hosts
- Balance marketing efforts between domestic and international channels based on the guest mix.
- Tailor amenities and listing descriptions to appeal to the dominant Post-2000s (Gen Z/Alpha) demographic (e.g., highlight fast WiFi, smart home features, local guides).
- Highlight unique local experiences or amenities relevant to the primary guest profile.
- Consider seasonal promotions aligned with peak travel times for key origin markets.
Nearby Short-Term Rental Market Comparison
How does the Saint Arnaud Airbnb market stack up against its neighbors? Compare key performance metrics like average monthly revenue, ADR, and occupancy rates in surrounding areas to understand the broader regional STR landscape.
| Market | Active Properties | Monthly Revenue | Daily Rate | Avg. Occupancy |
|---|---|---|---|---|
| Punakaiki | 31 | $1,919 | $154.84 | 43% |
| Hanmer Springs | 274 | $1,873 | $257.36 | 30% |
| Fox River | 13 | $1,865 | $118.88 | 56% |
| Kaikōura | 282 | $1,852 | $191.41 | 40% |
| Renwick | 27 | $1,795 | $163.62 | 43% |
| Kaniere | 10 | $1,760 | $124.51 | 48% |
| Ligar Bay | 41 | $1,677 | $225.00 | 37% |
| Kaiteriteri | 88 | $1,570 | $264.89 | 34% |
| Mārahau | 44 | $1,488 | $201.81 | 42% |
| Parapara | 25 | $1,464 | $176.77 | 40% |