San Sebastián Airbnb Market Analysis 2026: Short Term Rental Data & Vacation Rental Statistics in Cusco, Peru
Is Airbnb profitable in San Sebastián in 2026? Explore comprehensive Airbnb analytics for San Sebastián, Cusco, Peru to uncover income potential. This 2026 STR market report for San Sebastián, based on AirROI data from February 2025 to January 2026, reveals key trends in the niche market of 85 active listings.
Whether you're considering an Airbnb investment in San Sebastián, optimizing your existing vacation rental, or exploring rental arbitrage opportunities, understanding the San Sebastián Airbnb data is crucial. Leveraging the low regulation environment is key to maximizing your short term rental income potential. Let's dive into the specifics.
Key San Sebastián Airbnb Performance Metrics Overview
Monthly Airbnb Revenue Variations & Income Potential in San Sebastián (2026)
Understanding the monthly revenue variations for Airbnb listings in San Sebastián is key to maximizing your short term rental income potential. Seasonality significantly impacts earnings. Our analysis, based on data from the past 12 months, shows that the peak revenue month for STRs in San Sebastián is typically July, while December often presents the lowest earnings, highlighting opportunities for strategic pricing adjustments during shoulder and low seasons. Explore the typical Airbnb income in San Sebastián across different performance tiers:
- Best-in-class properties (Top 10%) achieve $591+ monthly, often utilizing dynamic pricing and superior guest experiences.
- Strong performing properties (Top 25%) earn $367 or more, indicating effective management and desirable locations/amenities.
- Typical properties (Median) generate around $194 per month, representing the average market performance.
- Entry-level properties (Bottom 25%) see earnings around $80, often with potential for optimization.
Average Monthly Airbnb Earnings Trend in San Sebastián
San Sebastián Airbnb Occupancy Rate Trends (2026)
Maximize your bookings by understanding the San Sebastián STR occupancy trends. Seasonal demand shifts significantly influence how often properties are booked. Typically, Aprilsees the highest demand (peak season occupancy), while December experiences the lowest (low season). Effective strategies, like adjusting minimum stays or offering promotions, can boost occupancy during slower periods. Here's how different property tiers perform in San Sebastián:
- Best-in-class properties (Top 10%) achieve 61%+ occupancy, indicating high desirability and potentially optimized availability.
- Strong performing properties (Top 25%) maintain 40% or higher occupancy, suggesting good market fit and guest satisfaction.
- Typical properties (Median) have an occupancy rate around 23%.
- Entry-level properties (Bottom 25%) average 9% occupancy, potentially facing higher vacancy.
Average Monthly Occupancy Rate Trend in San Sebastián
Average Daily Rate (ADR) Airbnb Trends in San Sebastián (2026)
Effective short term rental pricing strategy in San Sebastián involves understanding monthly ADR fluctuations. The Average Daily Rate (ADR) for Airbnb in San Sebastián typically peaks in January and dips lowest during February. Leveraging Airbnb dynamic pricing tools or strategies based on this seasonality can significantly boost revenue. Here's a look at the typical nightly rates achieved:
- Best-in-class properties (Top 10%) command rates of $59+ per night, often due to premium features or locations.
- Strong performing properties (Top 25%) achieve nightly rates of $40 or more.
- Typical properties (Median) charge around $27 per night.
- Entry-level properties (Bottom 25%) earn around $19 per night.
Average Daily Rate (ADR) Trend by Month in San Sebastián
Get Live San Sebastián Market Intelligence 👇

Explore Real-time Analytics
Airbnb Seasonality Analysis & Trends in San Sebastián (2026)
Peak Season (July, April, August)
- Revenue averages $331 per month
- Occupancy rates average 33.3%
- Daily rates average $35
Shoulder Season
- Revenue averages $262 per month
- Occupancy maintains around 27.9%
- Daily rates hold near $36
Low Season (February, November, December)
- Revenue drops to average $217 per month
- Occupancy decreases to average 23.9%
- Daily rates adjust to average $36
Seasonality Insights for San Sebastián
- The Airbnb seasonality in San Sebastián shows moderate seasonality with distinct peak and low periods. While the sections above show seasonal averages, it's also insightful to look at the extremes:
- During the high season, the absolute peak month showcases San Sebastián's highest earning potential, with monthly revenues capable of climbing to $352, occupancy reaching a high of 35.9%, and ADRs peaking at $39.
- Conversely, the slowest single month of the year, typically falling within the low season, marks the market's lowest point. In this month, revenue might dip to $210, occupancy could drop to 20.8%, and ADRs may adjust down to $31.
- Understanding both the seasonal averages and these monthly peaks and troughs in revenue, occupancy, and ADR is crucial for maximizing your Airbnb profit potential in San Sebastián.
Seasonal Strategies for Maximizing Profit
- Peak Season: Maximize revenue through premium pricing and potentially longer minimum stays. Ensure high availability.
- Low Season: Offer competitive pricing, special promotions (e.g., extended stay discounts), and flexible cancellation policies. Target off-season travelers like remote workers or budget-conscious guests.
- Shoulder Seasons: Implement dynamic pricing that balances peak and low rates. Target weekend travelers or specific events. Offer slightly more flexible terms than peak season.
- Regularly analyze your own performance against these San Sebastián seasonality benchmarks and adjust your pricing and availability strategy accordingly.
Best Areas for Airbnb Investment in San Sebastián (2026)
Exploring the top neighborhoods for short-term rentals in San Sebastián? This section highlights key areas, outlining why they are attractive for hosts and guests, along with notable local attractions. Consider these locations based on your target guest profile and investment strategy.
| Neighborhood / Area | Why Host Here? (Target Guests & Appeal) | Key Attractions & Landmarks |
|---|---|---|
| Historic Center | The historic center of Cusco, a UNESCO World Heritage site, attracts tourists for its rich architecture and cultural significance. Visitors flock to see iconic sites such as the Plaza de Armas and Qorikancha. | Plaza de Armas, Qorikancha Temple, Cusco Cathedral, Saqsayhuamán, San Blas Neighborhood, Inca Museum |
| San Blas | Known for its bohemian vibe and artisan shops, San Blas is popular among travelers seeking unique crafts, local art, and stunning views of the city. It's a charming area full of narrow streets and lively atmosphere. | San Blas Church, Artisan Market, Mirador de San Blas, Hatunrumiyoc Street, Callecho de los Artesanos |
| Ollantaytambo | A picturesque town and gateway to Machu Picchu, Ollantaytambo offers both tourist hotspots and a relaxed atmosphere with beautiful surroundings. It serves as a base for those exploring the Sacred Valley. | Ollantaytambo Ruins, Inca Fortress, Sacred Valley, Local Markets, Walking Trails to Nearby Villages |
| Sacsayhuamán | This archaeological site located on the outskirts of Cusco features impressive Inca stonework and panoramic views of the city. It attracts history enthusiasts and offers tranquil areas to explore. | Sacsayhuamán Ruins, Inca Walls, Viewpoints of Cusco, Puca Pucara, Tambomachay |
| Pisac | Famous for its markets and Inca ruins, Pisac captures the essence of Andean culture. It attracts tourists looking for authentic experiences and unique local products. | Pisac Ruins, Pisac Market, Incan Terraces, Traditional Andean Cuisine, Craft Workshops |
| Maras | Home to the ancient salt mines and stunning views of the Sacred Valley, Maras is a lesser-known, tranquil area that offers unique cultural experiences and a close look at traditional methods. | Salinas de Maras, Moray Ruins, Andean Landscapes, Traditional Local Cuisine, Photography Opportunities |
| Chinchero | Known for its weaving traditions and views of the Andes, Chinchero is a great place to experience authentic culture and visit traditional artisan workshops. | Chinchero Market, Colonial Church, Inca Ruins, Traditional Weaving Demonstrations, Spectacular Mountain Views |
| Tipón | An archaeological site featuring impressive aqueducts and terraces, Tipón is ideal for those interested in Inca engineering and rural landscapes. It attracts visitors seeking tranquility away from the city. | Tipón Archaeological Site, Terraced Fields, Aqueducts, Traditional Andean Agriculture, Scenic Hiking Trails |
Understanding Airbnb License Requirements & STR Laws in San Sebastián (2026)
While San Sebastián, Cusco, Peru currently shows low STR regulations, specific Airbnb license requirements might still exist or change. Always verify the latest short term rental regulations and Airbnb license requirements directly with local government authorities for San Sebastián to ensure full compliance before hosting.
(Source: AirROI data, 2026, based on 1% licensed listings)
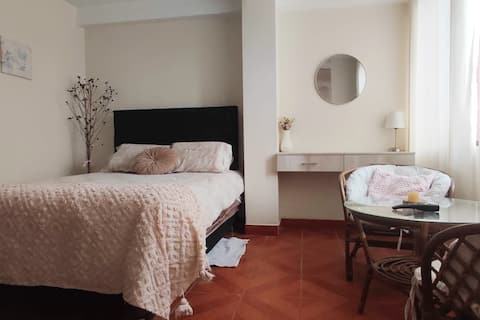
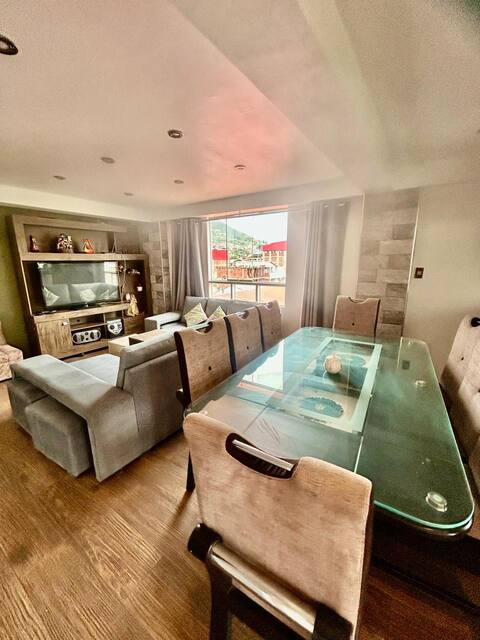
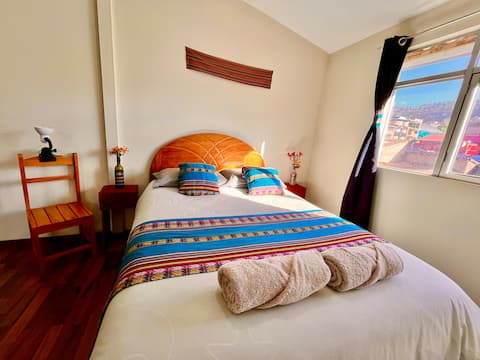
Top Performing Airbnb Properties in San Sebastián (2026)
Benchmark your potential! Explore examples of top-performing Airbnb properties in San Sebastiánbased on Trailing Twelve Month (TTM) revenue. Analyze their characteristics, revenue, occupancy rate, and ADR to understand what drives success in this market.

Inti Wasi Familiar 1.5 blocks from Av. La Cultura
Entire Place • 10 bedrooms

Valentina apart
Entire Place • 4 bedrooms
A beautiful, fully-equipped apartment
Entire Place • 2 bedrooms
Apart Valentina house
Entire Place • 4 bedrooms
Panaqa's Duplex - Full Apartment in Cusco
Entire Place • 3 bedrooms

Apartment with plants in Cusco
Entire Place • 2 bedrooms
Note: Performance varies based on location, size, amenities, seasonality, and management quality. Data reflects the past 12 months.
Top Performing Airbnb Hosts in San Sebastián (2026)
Learn from the best! This table showcases top-performing Airbnb hosts in San Sebastián based on the number of properties managed and estimated total revenue over the past year. Analyze their scale and performance metrics.
| Host Name | Properties | Grossing Revenue | Stay Reviews | Avg Rating |
|---|---|---|---|---|
| Karina | 3 | $17,733 | 51 | 4.47/5.0 |
| Flor Elvira | 3 | $11,576 | 168 | 4.89/5.0 |
| Clotilde | 1 | $10,687 | 64 | 4.91/5.0 |
| Fernando | 2 | $7,660 | 14 | 5.00/5.0 |
| Emily | 3 | $6,970 | 36 | 4.99/5.0 |
| Claudia | 1 | $6,660 | 11 | 4.45/5.0 |
| Grisel | 2 | $6,603 | 96 | 4.87/5.0 |
| Rodrigo | 1 | $5,769 | 76 | 4.91/5.0 |
| César | 1 | $4,466 | 65 | 4.77/5.0 |
| Carol | 3 | $4,424 | 45 | 4.70/5.0 |
Analyzing the strategies of top hosts, such as their property selection, pricing, and guest communication, can offer valuable lessons for optimizing your own Airbnb operations in San Sebastián.
Dive Deeper: Advanced San Sebastián STR Market Data (2026)
Ready to unlock more insights? AirROI provides access to advanced metrics and comprehensive Airbnb data for San Sebastián. Explore detailed analytics beyond this report to refine your investment strategy, optimize pricing, and maximize your vacation rental profits.
Explore Advanced MetricsSan Sebastián Short-Term Rental Market Composition (2026): Property & Room Types
Room Type Distribution
Property Type Distribution
Market Composition Insights for San Sebastián
- The San Sebastián Airbnb market composition is heavily skewed towards Entire Home/Apt listings, which make up 83.5% of the 85 active rentals. This indicates strong guest preference for privacy and space.
- Looking at the property type distribution in San Sebastián, Apartment/Condo properties are the most common (84.7%), reflecting the local real estate landscape.
- Smaller segments like hotel/boutique (combined 4.7%) offer potential for unique stay experiences.
San Sebastián Airbnb Room Capacity Analysis (2026): Bedroom Distribution
Distribution of Listings by Number of Bedrooms
Room Capacity Insights for San Sebastián
- The dominant room capacity in San Sebastián is 2 bedrooms listings, making up 36.5% of the market. This suggests a strong demand for properties suitable for couples or solo travelers.
- Together, 2 bedrooms and 3 bedrooms properties represent 65.9% of the active Airbnb listings in San Sebastián, indicating a high concentration in these sizes.
- A significant 40.0% of listings offer 3+ bedrooms, catering to larger groups and families seeking more space in San Sebastián.
San Sebastián Vacation Rental Guest Capacity Trends (2026)
Distribution of Listings by Guest Capacity
Guest Capacity Insights for San Sebastián
- The most common guest capacity trend in San Sebastián vacation rentals is listings accommodating 4 guests (23.5%). This suggests the primary traveler segment is likely small families or groups.
- Properties designed for 4 guests and 6 guests dominate the San Sebastián STR market, accounting for 40.0% of listings.
- 34.1% of properties accommodate 6+ guests, serving the market segment for larger families or group travel in San Sebastián.
- On average, properties in San Sebastián are equipped to host 4.3 guests.
San Sebastián Airbnb Booking Patterns (2026): Available vs. Booked Days
Available Days Distribution
Booked Days Distribution
Booking Pattern Insights for San Sebastián
- The most common availability pattern in San Sebastián falls within the 271-366 days range, representing 77.6% of listings. This suggests many properties have significant open periods on their calendars.
- Approximately 95.2% of listings show high availability (181+ days open annually), indicating potential for increased bookings or specific owner usage patterns.
- For booked days, the 1-30 days range is most frequent in San Sebastián (48.2%), reflecting common guest stay durations or potential owner blocking patterns.
- A notable 4.7% of properties secure long booking periods (181+ days booked per year), highlighting successful long-term rental strategies or significant owner usage.
San Sebastián Airbnb Minimum Stay Requirements Analysis
Distribution of Listings by Minimum Night Requirement
1 Night
35 listings
41.2% of total
2 Nights
25 listings
29.4% of total
3 Nights
13 listings
15.3% of total
4-6 Nights
2 listings
2.4% of total
30+ Nights
10 listings
11.8% of total
Key Insights
- The most prevalent minimum stay requirement in San Sebastián is 1 Night, adopted by 41.2% of listings. This highlights the market's preference for shorter, flexible bookings.
- A strong majority (70.6%) of the San Sebastián Airbnb data shows acceptance of very short stays (1-2 nights), indicating a dynamic, high-turnover market.
- A significant segment (11.8%) caters to monthly stays (30+ nights) in San Sebastián, pointing to opportunities in the extended-stay market.
Recommendations
- Align with the market by considering a 1 Night minimum stay, as 41.2% of San Sebastián hosts use this setting.
- Explore offering discounts for stays of 30+ nights to attract the 11.8% of the market seeking extended stays.
- Adjust minimum nights based on seasonality – potentially shorter during low season and longer during peak demand periods in San Sebastián.
San Sebastián Airbnb Cancellation Policy Trends Analysis (2026)
Limited
1 listings
1.2% of total
Flexible
53 listings
62.4% of total
Moderate
19 listings
22.4% of total
Firm
12 listings
14.1% of total
Cancellation Policy Insights for San Sebastián
- The prevailing Airbnb cancellation policy trend in San Sebastián is Flexible, used by 62.4% of listings.
- The market strongly favors guest-friendly terms, with 84.8% of listings offering Flexible or Moderate policies. This suggests guests in San Sebastián may expect booking flexibility.
Recommendations for Hosts
- Consider adopting a Flexible policy to align with the 62.4% market standard in San Sebastián.
- Given the high prevalence of Flexible policies (62.4%), offering this can enhance booking appeal, especially during shoulder seasons.
- Regularly review your cancellation policy against competitors and market demand shifts in San Sebastián.
San Sebastián STR Booking Lead Time Analysis (2026)
Average Booking Lead Time by Month
Booking Lead Time Insights for San Sebastián
- The overall average booking lead time for vacation rentals in San Sebastián is 22 days.
- Guests book furthest in advance for stays during January (average 41 days), likely coinciding with peak travel demand or local events.
- The shortest booking windows occur for stays in February (average 9 days), indicating more last-minute travel plans during this time.
- Seasonally, Summer (28 days avg.) sees the longest lead times, while Fall (17 days avg.) has the shortest, reflecting typical travel planning cycles.
Recommendations for Hosts
- Use the overall average lead time (22 days) as a baseline for your pricing and availability strategy in San Sebastián.
- For January stays, consider implementing length-of-stay discounts or slightly higher rates for bookings made less than 41 days out to capitalize on advance planning.
- During February, focus on last-minute booking availability and promotions, as guests book with very short notice (9 days avg.).
- Target marketing efforts for the Summer season well in advance (at least 28 days) to capture early planners.
- Monitor your own booking lead times against these San Sebastián averages to identify opportunities for dynamic pricing adjustments.
Popular & Essential Airbnb Amenities in San Sebastián (2026)
Amenity Prevalence
Amenity Insights for San Sebastián
- Essential amenities in San Sebastián that guests expect include: Wifi. Lacking these (this) could significantly impact bookings.
- Popular amenities like Kitchen, TV, Hot water are common but not universal. Offering these can provide a competitive edge.
Recommendations for Hosts
- Ensure your listing includes all essential amenities for San Sebastián: Wifi.
- Consider adding popular differentiators like Kitchen or TV to increase appeal.
- Highlight unique or less common amenities you offer (e.g., hot tub, dedicated workspace, EV charger) in your listing description and photos.
- Regularly check competitor amenities in San Sebastián to stay competitive.
San Sebastián Airbnb Guest Demographics & Profile Analysis (2026)
Guest Profile Summary for San Sebastián
- The typical guest profile for Airbnb in San Sebastián consists of predominantly international visitors (69%), with top international origins including United States, typically belonging to the Post-2000s (Gen Z/Alpha) group (50%), primarily speaking Spanish or English.
- Domestic travelers account for 31.1% of guests.
- Key international markets include Peru (31.1%) and United States (18.9%).
- Top languages spoken are Spanish (39.4%) followed by English (35.6%).
- A significant demographic segment is the Post-2000s (Gen Z/Alpha) group, representing 50% of guests.
Recommendations for Hosts
- Focus marketing internationally, particularly towards travelers from United States.
- Offer listing details and communication support in Spanish.
- Tailor amenities and listing descriptions to appeal to the dominant Post-2000s (Gen Z/Alpha) demographic (e.g., highlight fast WiFi, smart home features, local guides).
- Highlight unique local experiences or amenities relevant to the primary guest profile.
- Consider seasonal promotions aligned with peak travel times for key origin markets.
Nearby Short-Term Rental Market Comparison
How does the San Sebastián Airbnb market stack up against its neighbors? Compare key performance metrics like average monthly revenue, ADR, and occupancy rates in surrounding areas to understand the broader regional STR landscape.
| Market | Active Properties | Monthly Revenue | Daily Rate | Avg. Occupancy |
|---|---|---|---|---|
| Lamay | 14 | $1,098 | $95.76 | 38% |
| Huayllabamba | 50 | $1,082 | $138.65 | 30% |
| Calca | 107 | $693 | $106.76 | 33% |
| Urubamba | 232 | $539 | $86.78 | 27% |
| Maras | 18 | $476 | $66.95 | 22% |
| Taray | 14 | $475 | $64.21 | 41% |
| Distrito de Cusco | 2,111 | $424 | $41.51 | 40% |
| Wanchaq | 527 | $392 | $39.04 | 38% |
| San Salvador | 21 | $362 | $57.07 | 36% |
| Pisac | 180 | $354 | $42.42 | 33% |