Huaral Airbnb Market Analysis 2026: Short Term Rental Data & Vacation Rental Statistics in Lima, Peru
Is Airbnb profitable in Huaral in 2026? Explore comprehensive Airbnb analytics for Huaral, Lima, Peru to uncover income potential. This 2026 STR market report for Huaral, based on AirROI data from February 2025 to January 2026, reveals key trends in the niche market of 21 active listings.
Whether you're considering an Airbnb investment in Huaral, optimizing your existing vacation rental, or exploring rental arbitrage opportunities, understanding the Huaral Airbnb data is crucial. Leveraging the low regulation environment is key to maximizing your short term rental income potential. Let's dive into the specifics.
Key Huaral Airbnb Performance Metrics Overview
Monthly Airbnb Revenue Variations & Income Potential in Huaral (2026)
Understanding the monthly revenue variations for Airbnb listings in Huaral is key to maximizing your short term rental income potential. Seasonality significantly impacts earnings. Our analysis, based on data from the past 12 months, shows that the peak revenue month for STRs in Huaral is typically February, while September often presents the lowest earnings, highlighting opportunities for strategic pricing adjustments during shoulder and low seasons. Explore the typical Airbnb income in Huaral across different performance tiers:
- Best-in-class properties (Top 10%) achieve $2,268+ monthly, often utilizing dynamic pricing and superior guest experiences.
- Strong performing properties (Top 25%) earn $1,258 or more, indicating effective management and desirable locations/amenities.
- Typical properties (Median) generate around $511 per month, representing the average market performance.
- Entry-level properties (Bottom 25%) see earnings around $214, often with potential for optimization.
Average Monthly Airbnb Earnings Trend in Huaral
Huaral Airbnb Occupancy Rate Trends (2026)
Maximize your bookings by understanding the Huaral STR occupancy trends. Seasonal demand shifts significantly influence how often properties are booked. Typically, Februarysees the highest demand (peak season occupancy), while September experiences the lowest (low season). Effective strategies, like adjusting minimum stays or offering promotions, can boost occupancy during slower periods. Here's how different property tiers perform in Huaral:
- Best-in-class properties (Top 10%) achieve 44%+ occupancy, indicating high desirability and potentially optimized availability.
- Strong performing properties (Top 25%) maintain 28% or higher occupancy, suggesting good market fit and guest satisfaction.
- Typical properties (Median) have an occupancy rate around 15%.
- Entry-level properties (Bottom 25%) average 8% occupancy, potentially facing higher vacancy.
Average Monthly Occupancy Rate Trend in Huaral
Average Daily Rate (ADR) Airbnb Trends in Huaral (2026)
Effective short term rental pricing strategy in Huaral involves understanding monthly ADR fluctuations. The Average Daily Rate (ADR) for Airbnb in Huaral typically peaks in January and dips lowest during March. Leveraging Airbnb dynamic pricing tools or strategies based on this seasonality can significantly boost revenue. Here's a look at the typical nightly rates achieved:
- Best-in-class properties (Top 10%) command rates of $254+ per night, often due to premium features or locations.
- Strong performing properties (Top 25%) achieve nightly rates of $210 or more.
- Typical properties (Median) charge around $123 per night.
- Entry-level properties (Bottom 25%) earn around $42 per night.
Average Daily Rate (ADR) Trend by Month in Huaral
Get Live Huaral Market Intelligence 👇

Explore Real-time Analytics
Airbnb Seasonality Analysis & Trends in Huaral (2026)
Peak Season (February, April, December)
- Revenue averages $1,259 per month
- Occupancy rates average 28.7%
- Daily rates average $143
Shoulder Season
- Revenue averages $880 per month
- Occupancy maintains around 19.7%
- Daily rates hold near $143
Low Season (August, September, November)
- Revenue drops to average $635 per month
- Occupancy decreases to average 14.7%
- Daily rates adjust to average $144
Seasonality Insights for Huaral
- The Airbnb seasonality in Huaral shows highly seasonal trends requiring careful strategy. While the sections above show seasonal averages, it's also insightful to look at the extremes:
- During the high season, the absolute peak month showcases Huaral's highest earning potential, with monthly revenues capable of climbing to $1,406, occupancy reaching a high of 33.3%, and ADRs peaking at $160.
- Conversely, the slowest single month of the year, typically falling within the low season, marks the market's lowest point. In this month, revenue might dip to $529, occupancy could drop to 10.7%, and ADRs may adjust down to $133.
- Understanding both the seasonal averages and these monthly peaks and troughs in revenue, occupancy, and ADR is crucial for maximizing your Airbnb profit potential in Huaral.
Seasonal Strategies for Maximizing Profit
- Peak Season: Maximize revenue through premium pricing and potentially longer minimum stays. Ensure high availability.
- Low Season: Offer competitive pricing, special promotions (e.g., extended stay discounts), and flexible cancellation policies. Target off-season travelers like remote workers or budget-conscious guests.
- Shoulder Seasons: Implement dynamic pricing that balances peak and low rates. Target weekend travelers or specific events. Offer slightly more flexible terms than peak season.
- Regularly analyze your own performance against these Huaral seasonality benchmarks and adjust your pricing and availability strategy accordingly.
Best Areas for Airbnb Investment in Huaral (2026)
Exploring the top neighborhoods for short-term rentals in Huaral? This section highlights key areas, outlining why they are attractive for hosts and guests, along with notable local attractions. Consider these locations based on your target guest profile and investment strategy.
| Neighborhood / Area | Why Host Here? (Target Guests & Appeal) | Key Attractions & Landmarks |
|---|---|---|
| Centro de Huaral | Vibrant central area known for its historical sites and local culture. Attracts visitors interested in exploring Huaral's rich history and experiencing local life. | Plaza de Armas, Huaral Cathedral, Museo de Huaral, Casa de la Cultura, Paseo de los Héroes |
| Zarate | Residential area with family-friendly amenities and close proximity to parks and markets. Ideal for families looking for a peaceful stay and access to local commerce. | Parque Zarate, Local Markets, Plaza de Armas de Huaral, Restaurants |
| Los Olivos | Modern suburban neighborhood with shopping centers and recreational facilities. Popular among tourists looking for a quieter stay with easy access to amenities. | Plaza Vea Shopping, Parque Los Olivos, Restaurantes, Cafeterías |
| Chancay | Beautiful coastal town near Huaral with stunning beaches and historical sites. Attracts beachgoers and history enthusiasts looking for a unique coastal experience. | Castillo de Chancay, Playa Chancay, Parque Ecológico, Centro Histórico de Chancay |
| Caral | Famous for the ancient archaeological site of Caral, this area attracts history buffs and tourists interested in ancient cultures. A must-visit for its historical significance. | Ruinas de Caral, Museo de Sitio de Caral, Tours arqueológicos |
| Pasco Alto | Offers breathtaking views and nature experiences, appealing to those looking for adventure and outdoor activities in the foothills. | Caminatas en la naturaleza, Miradores, Ecoturismo |
| Huaral Valley | Known for its agricultural richness and picturesque landscapes. Great for tourists seeking eco-tourism experiences and fresh local produce. | Visitas a campos agrícolas, Rutas de trekking, Mercados locales |
| Cañete | Nearby area popular for its wine and scenic landscapes, attracting wine lovers and nature enthusiasts. An excellent area for experiential stays. | Vinos de Cañete, Rutas de vino, Paisajes escénicos |
Understanding Airbnb License Requirements & STR Laws in Huaral (2026)
While Huaral, Lima, Peru currently shows low STR regulations, specific Airbnb license requirements might still exist or change. Always verify the latest short term rental regulations and Airbnb license requirements directly with local government authorities for Huaral to ensure full compliance before hosting.
(Source: AirROI data, 2026, finding no licensed listings among those analyzed)
Top Performing Airbnb Properties in Huaral (2026)
Benchmark your potential! Explore examples of top-performing Airbnb properties in Huaralbased on Trailing Twelve Month (TTM) revenue. Analyze their characteristics, revenue, occupancy rate, and ADR to understand what drives success in this market.
Las Pecanas Huaral Cottage
Entire Place • 4 bedrooms
The Garden House of Huaral
Entire Place • 3 bedrooms

Casa de Campo Don José - Huaral
Entire Place • 3 bedrooms
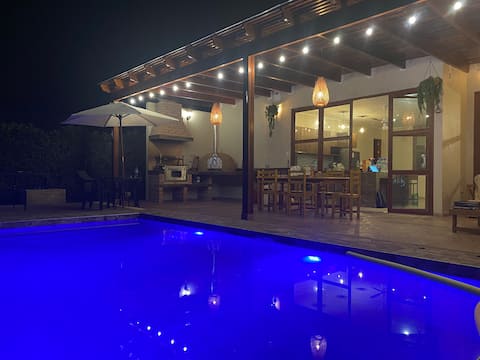
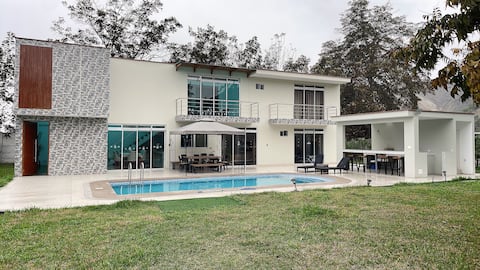
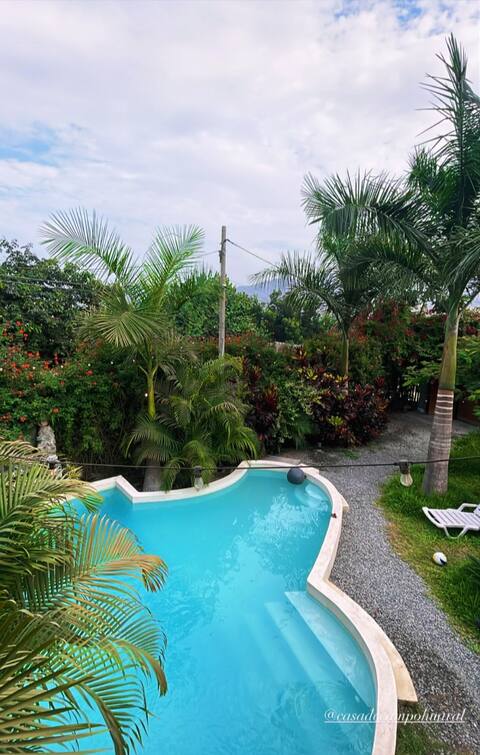
Beautiful country house with a fireplace and pool
Entire Place • 4 bedrooms

Country house with pool
Entire Place • 3 bedrooms

Beautiful country house
Entire Place • 4 bedrooms
Note: Performance varies based on location, size, amenities, seasonality, and management quality. Data reflects the past 12 months.
Top Performing Airbnb Hosts in Huaral (2026)
Learn from the best! This table showcases top-performing Airbnb hosts in Huaral based on the number of properties managed and estimated total revenue over the past year. Analyze their scale and performance metrics.
| Host Name | Properties | Grossing Revenue | Stay Reviews | Avg Rating |
|---|---|---|---|---|
| Angelica | 1 | $27,610 | 10 | 4.80/5.0 |
| Daniel Andrew | 1 | $20,318 | 14 | 4.57/5.0 |
| Blenda | 1 | $17,374 | 2 | Not Rated |
| Claudia | 1 | $13,309 | 13 | 4.77/5.0 |
| Milander | 1 | $12,048 | 15 | 4.73/5.0 |
| Deivi | 1 | $8,730 | 8 | 4.50/5.0 |
| Masaru | 2 | $8,493 | 131 | 4.89/5.0 |
| Luis Miguel | 1 | $7,844 | 1 | Not Rated |
| Maria Veronica | 2 | $5,197 | 87 | 4.67/5.0 |
| Lita | 1 | $4,476 | 9 | 4.67/5.0 |
Analyzing the strategies of top hosts, such as their property selection, pricing, and guest communication, can offer valuable lessons for optimizing your own Airbnb operations in Huaral.
Dive Deeper: Advanced Huaral STR Market Data (2026)
Ready to unlock more insights? AirROI provides access to advanced metrics and comprehensive Airbnb data for Huaral. Explore detailed analytics beyond this report to refine your investment strategy, optimize pricing, and maximize your vacation rental profits.
Explore Advanced MetricsHuaral Short-Term Rental Market Composition (2026): Property & Room Types
Room Type Distribution
Property Type Distribution
Market Composition Insights for Huaral
- The Huaral Airbnb market composition is heavily skewed towards Entire Home/Apt listings, which make up 95.2% of the 21 active rentals. This indicates strong guest preference for privacy and space.
- Looking at the property type distribution in Huaral, House properties are the most common (76.2%), reflecting the local real estate landscape.
- Houses represent a significant 76.2% portion, catering likely to families or larger groups.
Huaral Airbnb Room Capacity Analysis (2026): Bedroom Distribution
Distribution of Listings by Number of Bedrooms
Room Capacity Insights for Huaral
- The dominant room capacity in Huaral is 3 bedrooms listings, making up 42.9% of the market. This suggests a strong demand for properties suitable for families or small groups.
- Together, 3 bedrooms and 4 bedrooms properties represent 66.7% of the active Airbnb listings in Huaral, indicating a high concentration in these sizes.
- A significant 71.5% of listings offer 3+ bedrooms, catering to larger groups and families seeking more space in Huaral.
Huaral Vacation Rental Guest Capacity Trends (2026)
Distribution of Listings by Guest Capacity
Guest Capacity Insights for Huaral
- The most common guest capacity trend in Huaral vacation rentals is listings accommodating 8+ guests (61.9%). This suggests the primary traveler segment is likely larger groups.
- Properties designed for 8+ guests and 6 guests dominate the Huaral STR market, accounting for 71.4% of listings.
- 76.2% of properties accommodate 6+ guests, serving the market segment for larger families or group travel in Huaral.
- On average, properties in Huaral are equipped to host 6.6 guests.
Huaral Airbnb Booking Patterns (2026): Available vs. Booked Days
Available Days Distribution
Booked Days Distribution
Booking Pattern Insights for Huaral
- The most common availability pattern in Huaral falls within the 271-366 days range, representing 85.7% of listings. This suggests many properties have significant open periods on their calendars.
- Approximately 100.0% of listings show high availability (181+ days open annually), indicating potential for increased bookings or specific owner usage patterns.
- For booked days, the 1-30 days range is most frequent in Huaral (42.9%), reflecting common guest stay durations or potential owner blocking patterns.
Huaral Airbnb Minimum Stay Requirements Analysis
Distribution of Listings by Minimum Night Requirement
1 Night
13 listings
61.9% of total
2 Nights
4 listings
19% of total
3 Nights
1 listings
4.8% of total
30+ Nights
3 listings
14.3% of total
Key Insights
- The most prevalent minimum stay requirement in Huaral is 1 Night, adopted by 61.9% of listings. This highlights the market's preference for shorter, flexible bookings.
- A strong majority (80.9%) of the Huaral Airbnb data shows acceptance of very short stays (1-2 nights), indicating a dynamic, high-turnover market.
- A significant segment (14.3%) caters to monthly stays (30+ nights) in Huaral, pointing to opportunities in the extended-stay market.
Recommendations
- Align with the market by considering a 1 Night minimum stay, as 61.9% of Huaral hosts use this setting.
- Explore offering discounts for stays of 30+ nights to attract the 14.3% of the market seeking extended stays.
- Adjust minimum nights based on seasonality – potentially shorter during low season and longer during peak demand periods in Huaral.
Huaral Airbnb Cancellation Policy Trends Analysis (2026)
Flexible
8 listings
38.1% of total
Moderate
6 listings
28.6% of total
Firm
7 listings
33.3% of total
Cancellation Policy Insights for Huaral
- The prevailing Airbnb cancellation policy trend in Huaral is Flexible, used by 38.1% of listings.
- There's a relatively balanced mix between guest-friendly (66.7%) and stricter (33.3%) policies, offering choices for different guest needs.
Recommendations for Hosts
- Consider adopting a Flexible policy to align with the 38.1% market standard in Huaral.
- Regularly review your cancellation policy against competitors and market demand shifts in Huaral.
Huaral STR Booking Lead Time Analysis (2026)
Average Booking Lead Time by Month
Booking Lead Time Insights for Huaral
- The overall average booking lead time for vacation rentals in Huaral is 14 days.
- Guests book furthest in advance for stays during December (average 31 days), likely coinciding with peak travel demand or local events.
- The shortest booking windows occur for stays in October (average 4 days), indicating more last-minute travel plans during this time.
- Seasonally, Winter (20 days avg.) sees the longest lead times, while Fall (6 days avg.) has the shortest, reflecting typical travel planning cycles.
Recommendations for Hosts
- Use the overall average lead time (14 days) as a baseline for your pricing and availability strategy in Huaral.
- For December stays, consider implementing length-of-stay discounts or slightly higher rates for bookings made less than 31 days out to capitalize on advance planning.
- During October, focus on last-minute booking availability and promotions, as guests book with very short notice (4 days avg.).
- Target marketing efforts for the Winter season well in advance (at least 20 days) to capture early planners.
- Monitor your own booking lead times against these Huaral averages to identify opportunities for dynamic pricing adjustments.
Popular & Essential Airbnb Amenities in Huaral (2026)
Amenity Prevalence
Amenity Insights for Huaral
- Essential amenities in Huaral that guests expect include: Wifi. Lacking these (this) could significantly impact bookings.
- Popular amenities like Kitchen, TV, Pets allowed are common but not universal. Offering these can provide a competitive edge.
- A pool is a highly desired but not standard amenity, making it a key feature for attracting guests seeking leisure in Huaral.
Recommendations for Hosts
- Ensure your listing includes all essential amenities for Huaral: Wifi.
- Consider adding popular differentiators like Kitchen or TV to increase appeal.
- Highlight unique or less common amenities you offer (e.g., hot tub, dedicated workspace, EV charger) in your listing description and photos.
- Regularly check competitor amenities in Huaral to stay competitive.
Huaral Airbnb Guest Demographics & Profile Analysis (2026)
Guest Profile Summary for Huaral
- The typical guest profile for Airbnb in Huaral consists of primarily domestic travelers (88%), often arriving from nearby Lima, typically belonging to the Post-2000s (Gen Z/Alpha) group (50%), primarily speaking Spanish or English.
- Domestic travelers account for 87.5% of guests.
- Key international markets include Peru (87.5%) and United States (10%).
- Top languages spoken are Spanish (59.4%) followed by English (31.3%).
- A significant demographic segment is the Post-2000s (Gen Z/Alpha) group, representing 50% of guests.
Recommendations for Hosts
- Target domestic marketing efforts towards travelers from Lima and Lima Region.
- Tailor amenities and listing descriptions to appeal to the dominant Post-2000s (Gen Z/Alpha) demographic (e.g., highlight fast WiFi, smart home features, local guides).
- Highlight unique local experiences or amenities relevant to the primary guest profile.
- Consider seasonal promotions aligned with peak travel times for key origin markets.
Nearby Short-Term Rental Market Comparison
How does the Huaral Airbnb market stack up against its neighbors? Compare key performance metrics like average monthly revenue, ADR, and occupancy rates in surrounding areas to understand the broader regional STR landscape.
| Market | Active Properties | Monthly Revenue | Daily Rate | Avg. Occupancy |
|---|---|---|---|---|
| Ricardo Palma | 12 | $1,262 | $265.85 | 24% |
| Cieneguilla | 10 | $1,242 | $189.15 | 31% |
| Santa Cruz de Flores | 67 | $901 | $222.02 | 22% |
| Santa Eulalia | 42 | $821 | $192.27 | 20% |
| San Antonio | 115 | $723 | $204.11 | 24% |
| Mala | 132 | $695 | $201.42 | 21% |
| Quilmaná | 20 | $674 | $211.24 | 16% |
| Asia | 375 | $637 | $198.98 | 21% |
| Cerro Azul | 230 | $570 | $177.22 | 21% |
| Lima Metropolitan Area | 11,840 | $546 | $66.58 | 39% |