Lobitos Airbnb Market Analysis 2026: Short Term Rental Data & Vacation Rental Statistics in Piura, Peru
Is Airbnb profitable in Lobitos in 2026? Explore comprehensive Airbnb analytics for Lobitos, Piura, Peru to uncover income potential. This 2026 STR market report for Lobitos, based on AirROI data from February 2025 to January 2026, reveals key trends in the niche market of 25 active listings.
Whether you're considering an Airbnb investment in Lobitos, optimizing your existing vacation rental, or exploring rental arbitrage opportunities, understanding the Lobitos Airbnb data is crucial. Leveraging the low regulation environment is key to maximizing your short term rental income potential. Let's dive into the specifics.
Key Lobitos Airbnb Performance Metrics Overview
Monthly Airbnb Revenue Variations & Income Potential in Lobitos (2026)
Understanding the monthly revenue variations for Airbnb listings in Lobitos is key to maximizing your short term rental income potential. Seasonality significantly impacts earnings. Our analysis, based on data from the past 12 months, shows that the peak revenue month for STRs in Lobitos is typically June, while September often presents the lowest earnings, highlighting opportunities for strategic pricing adjustments during shoulder and low seasons. Explore the typical Airbnb income in Lobitos across different performance tiers:
- Best-in-class properties (Top 10%) achieve $579+ monthly, often utilizing dynamic pricing and superior guest experiences.
- Strong performing properties (Top 25%) earn $334 or more, indicating effective management and desirable locations/amenities.
- Typical properties (Median) generate around $203 per month, representing the average market performance.
- Entry-level properties (Bottom 25%) see earnings around $85, often with potential for optimization.
Average Monthly Airbnb Earnings Trend in Lobitos
Lobitos Airbnb Occupancy Rate Trends (2026)
Maximize your bookings by understanding the Lobitos STR occupancy trends. Seasonal demand shifts significantly influence how often properties are booked. Typically, Junesees the highest demand (peak season occupancy), while January experiences the lowest (low season). Effective strategies, like adjusting minimum stays or offering promotions, can boost occupancy during slower periods. Here's how different property tiers perform in Lobitos:
- Best-in-class properties (Top 10%) achieve 70%+ occupancy, indicating high desirability and potentially optimized availability.
- Strong performing properties (Top 25%) maintain 43% or higher occupancy, suggesting good market fit and guest satisfaction.
- Typical properties (Median) have an occupancy rate around 22%.
- Entry-level properties (Bottom 25%) average 10% occupancy, potentially facing higher vacancy.
Average Monthly Occupancy Rate Trend in Lobitos
Average Daily Rate (ADR) Airbnb Trends in Lobitos (2026)
Effective short term rental pricing strategy in Lobitos involves understanding monthly ADR fluctuations. The Average Daily Rate (ADR) for Airbnb in Lobitos typically peaks in November and dips lowest during March. Leveraging Airbnb dynamic pricing tools or strategies based on this seasonality can significantly boost revenue. Here's a look at the typical nightly rates achieved:
- Best-in-class properties (Top 10%) command rates of $108+ per night, often due to premium features or locations.
- Strong performing properties (Top 25%) achieve nightly rates of $55 or more.
- Typical properties (Median) charge around $31 per night.
- Entry-level properties (Bottom 25%) earn around $17 per night.
Average Daily Rate (ADR) Trend by Month in Lobitos
Get Live Lobitos Market Intelligence 👇

Explore Real-time Analytics
Airbnb Seasonality Analysis & Trends in Lobitos (2026)
Peak Season (June, July, February)
- Revenue averages $342 per month
- Occupancy rates average 36.2%
- Daily rates average $42
Shoulder Season
- Revenue averages $250 per month
- Occupancy maintains around 31.3%
- Daily rates hold near $44
Low Season (January, August, September)
- Revenue drops to average $182 per month
- Occupancy decreases to average 21.6%
- Daily rates adjust to average $44
Seasonality Insights for Lobitos
- The Airbnb seasonality in Lobitos shows highly seasonal trends requiring careful strategy. While the sections above show seasonal averages, it's also insightful to look at the extremes:
- During the high season, the absolute peak month showcases Lobitos's highest earning potential, with monthly revenues capable of climbing to $359, occupancy reaching a high of 42.2%, and ADRs peaking at $47.
- Conversely, the slowest single month of the year, typically falling within the low season, marks the market's lowest point. In this month, revenue might dip to $141, occupancy could drop to 17.8%, and ADRs may adjust down to $41.
- Understanding both the seasonal averages and these monthly peaks and troughs in revenue, occupancy, and ADR is crucial for maximizing your Airbnb profit potential in Lobitos.
Seasonal Strategies for Maximizing Profit
- Peak Season: Maximize revenue through premium pricing and potentially longer minimum stays. Ensure high availability.
- Low Season: Offer competitive pricing, special promotions (e.g., extended stay discounts), and flexible cancellation policies. Target off-season travelers like remote workers or budget-conscious guests.
- Shoulder Seasons: Implement dynamic pricing that balances peak and low rates. Target weekend travelers or specific events. Offer slightly more flexible terms than peak season.
- Regularly analyze your own performance against these Lobitos seasonality benchmarks and adjust your pricing and availability strategy accordingly.
Best Areas for Airbnb Investment in Lobitos (2026)
Exploring the top neighborhoods for short-term rentals in Lobitos? This section highlights key areas, outlining why they are attractive for hosts and guests, along with notable local attractions. Consider these locations based on your target guest profile and investment strategy.
| Neighborhood / Area | Why Host Here? (Target Guests & Appeal) | Key Attractions & Landmarks |
|---|---|---|
| La Playa | A beautiful beach known for its surf conditions and friendly atmosphere. It's perfect for tourists looking to enjoy sun, sand, and water sports, making it a prime location for beach-related activities. | Lobitos Beach, Surf Schools, Local Seafood Restaurants, Fishing Tours |
| Centro de Lobitos | The main town area with essential amenities, shops, and local culture. Hosts will find a steady flow of tourists looking for convenience and local experiences. | Local Markets, Historic Buildings, Cafes and Bars |
| Punta Lobitos | A less crowded area known for its stunning views and a more relaxed atmosphere. Ideal for tourists looking to escape the busier spots and enjoy nature. | Lookout Points, Nature Trails, Quiet Beaches |
| Surfers' Point | Famous among surfers for its consistent waves, attracting a niche market of surfing enthusiasts all year round. | Surf Competitions, Surf Workshops, Beach Bonfires |
| Punta Veleros | A scenic spot south of Lobitos, known for picturesque sunsets and tranquility, popular with couples and families. | Sunset Views, Photography Spots, Secluded Beaches |
| Hostel Alley | A vibrant area with hostels and budget accommodations catering to backpackers and younger travelers seeking social experiences and activities. | Community Events, Backpacker Hangouts, Local Tours |
| Cultura Lobitos | An area that focuses on local culture and heritage, attracting tourists interested in the traditional lifestyle of Lobitos and its history. | Cultural Tours, Traditional Cuisine, Artisanal Shops |
| Eco Lodge Zone | A green area with eco-friendly accommodations, appealing to environmentally conscious travelers looking to immerse themselves in nature while minimizing their carbon footprint. | Nature Reserves, Eco Tours, Sustainable Farming Experiences |
Understanding Airbnb License Requirements & STR Laws in Lobitos (2026)
While Lobitos, Piura, Peru currently shows low STR regulations, specific Airbnb license requirements might still exist or change. Always verify the latest short term rental regulations and Airbnb license requirements directly with local government authorities for Lobitos to ensure full compliance before hosting.
(Source: AirROI data, 2026, finding no licensed listings among those analyzed)
Top Performing Airbnb Properties in Lobitos (2026)
Benchmark your potential! Explore examples of top-performing Airbnb properties in Lobitosbased on Trailing Twelve Month (TTM) revenue. Analyze their characteristics, revenue, occupancy rate, and ADR to understand what drives success in this market.

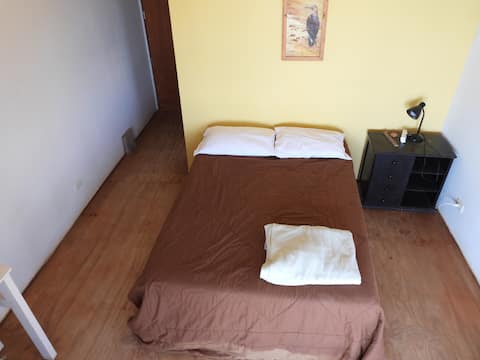
Private House in Lobitos | 3 Bedrooms
Entire Place • 3 bedrooms

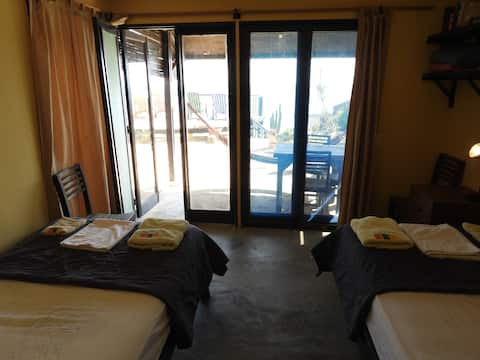
La Casa Blanca with an ocean view
Entire Place • 3 bedrooms

Room 1, La Vista Eco-House
Private Room • 1 bedroom
Room 2, La Vista Eco-house
Private Room • N/A
Room 3, La Vista Eco-House
Private Room • 1 bedroom
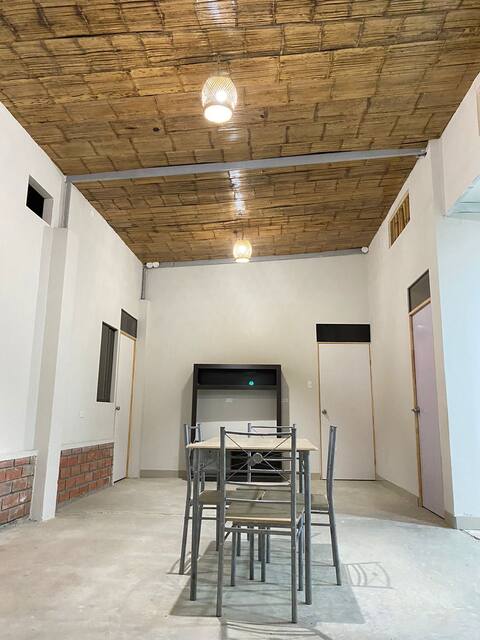
Casa privada en playa Lobitos - Piura
Private Room • 4 bedrooms
Note: Performance varies based on location, size, amenities, seasonality, and management quality. Data reflects the past 12 months.
Top Performing Airbnb Hosts in Lobitos (2026)
Learn from the best! This table showcases top-performing Airbnb hosts in Lobitos based on the number of properties managed and estimated total revenue over the past year. Analyze their scale and performance metrics.
| Host Name | Properties | Grossing Revenue | Stay Reviews | Avg Rating |
|---|---|---|---|---|
| Diego | 4 | $9,499 | 237 | 4.84/5.0 |
| Cesar | 1 | $4,444 | 9 | 4.89/5.0 |
| Silvia | 1 | $3,893 | 14 | 4.86/5.0 |
| Host #498798795 | 1 | $2,268 | 1 | Not Rated |
| Juan Carlos | 2 | $2,039 | 9 | 5.00/5.0 |
| Danilo | 1 | $1,459 | 8 | 4.88/5.0 |
| Jerry | 2 | $1,333 | 13 | 5.00/5.0 |
| Ana | 1 | $1,296 | 4 | 4.50/5.0 |
| Luis Javier | 1 | $827 | 4 | 5.00/5.0 |
| La Casona De Lobitos | 1 | $609 | 42 | 4.86/5.0 |
Analyzing the strategies of top hosts, such as their property selection, pricing, and guest communication, can offer valuable lessons for optimizing your own Airbnb operations in Lobitos.
Dive Deeper: Advanced Lobitos STR Market Data (2026)
Ready to unlock more insights? AirROI provides access to advanced metrics and comprehensive Airbnb data for Lobitos. Explore detailed analytics beyond this report to refine your investment strategy, optimize pricing, and maximize your vacation rental profits.
Explore Advanced MetricsLobitos Short-Term Rental Market Composition (2026): Property & Room Types
Room Type Distribution
Property Type Distribution
Market Composition Insights for Lobitos
- The Lobitos Airbnb market composition is heavily skewed towards Private Room listings, which make up 68% of the 25 active rentals. This indicates strong guest preference for privacy and space.
- Looking at the property type distribution in Lobitos, House properties are the most common (52%), reflecting the local real estate landscape.
- Houses represent a significant 52% portion, catering likely to families or larger groups.
- The presence of 8% Hotel/Boutique listings indicates integration with traditional hospitality.
- Smaller segments like unique stays (combined 4.0%) offer potential for unique stay experiences.
Lobitos Airbnb Room Capacity Analysis (2026): Bedroom Distribution
Distribution of Listings by Number of Bedrooms
Room Capacity Insights for Lobitos
- The dominant room capacity in Lobitos is 1 bedroom listings, making up 36% of the market. This suggests a strong demand for properties suitable for couples or solo travelers.
- Together, 1 bedroom and 3 bedrooms properties represent 64.0% of the active Airbnb listings in Lobitos, indicating a high concentration in these sizes.
- A significant 36.0% of listings offer 3+ bedrooms, catering to larger groups and families seeking more space in Lobitos.
Lobitos Vacation Rental Guest Capacity Trends (2026)
Distribution of Listings by Guest Capacity
Guest Capacity Insights for Lobitos
- The most common guest capacity trend in Lobitos vacation rentals is listings accommodating 2 guests (32%). This suggests the primary traveler segment is likely couples or solo travelers.
- Properties designed for 2 guests and 8+ guests dominate the Lobitos STR market, accounting for 40.0% of listings.
- 16.0% of properties accommodate 6+ guests, serving the market segment for larger families or group travel in Lobitos.
- On average, properties in Lobitos are equipped to host 2.4 guests.
Lobitos Airbnb Booking Patterns (2026): Available vs. Booked Days
Available Days Distribution
Booked Days Distribution
Booking Pattern Insights for Lobitos
- The most common availability pattern in Lobitos falls within the 271-366 days range, representing 84% of listings. This suggests many properties have significant open periods on their calendars.
- Approximately 100.0% of listings show high availability (181+ days open annually), indicating potential for increased bookings or specific owner usage patterns.
- For booked days, the 1-30 days range is most frequent in Lobitos (72%), reflecting common guest stay durations or potential owner blocking patterns.
Lobitos Airbnb Minimum Stay Requirements Analysis
Distribution of Listings by Minimum Night Requirement
1 Night
13 listings
52% of total
2 Nights
6 listings
24% of total
3 Nights
4 listings
16% of total
7-29 Nights
1 listings
4% of total
30+ Nights
1 listings
4% of total
Key Insights
- The most prevalent minimum stay requirement in Lobitos is 1 Night, adopted by 52% of listings. This highlights the market's preference for shorter, flexible bookings.
- A strong majority (76.0%) of the Lobitos Airbnb data shows acceptance of very short stays (1-2 nights), indicating a dynamic, high-turnover market.
Recommendations
- Align with the market by considering a 1 Night minimum stay, as 52% of Lobitos hosts use this setting.
- Adjust minimum nights based on seasonality �– potentially shorter during low season and longer during peak demand periods in Lobitos.
Lobitos Airbnb Cancellation Policy Trends Analysis (2026)
Flexible
14 listings
58.3% of total
Moderate
7 listings
29.2% of total
Firm
3 listings
12.5% of total
Cancellation Policy Insights for Lobitos
- The prevailing Airbnb cancellation policy trend in Lobitos is Flexible, used by 58.3% of listings.
- The market strongly favors guest-friendly terms, with 87.5% of listings offering Flexible or Moderate policies. This suggests guests in Lobitos may expect booking flexibility.
Recommendations for Hosts
- Consider adopting a Flexible policy to align with the 58.3% market standard in Lobitos.
- Given the high prevalence of Flexible policies (58.3%), offering this can enhance booking appeal, especially during shoulder seasons.
- Regularly review your cancellation policy against competitors and market demand shifts in Lobitos.
Lobitos STR Booking Lead Time Analysis (2026)
Average Booking Lead Time by Month
Booking Lead Time Insights for Lobitos
- The overall average booking lead time for vacation rentals in Lobitos is 14 days.
- Guests book furthest in advance for stays during June (average 38 days), likely coinciding with peak travel demand or local events.
- The shortest booking windows occur for stays in May (average 2 days), indicating more last-minute travel plans during this time.
- Seasonally, Winter (16 days avg.) sees the longest lead times, while Spring (7 days avg.) has the shortest, reflecting typical travel planning cycles.
Recommendations for Hosts
- Use the overall average lead time (14 days) as a baseline for your pricing and availability strategy in Lobitos.
- For June stays, consider implementing length-of-stay discounts or slightly higher rates for bookings made less than 38 days out to capitalize on advance planning.
- During May, focus on last-minute booking availability and promotions, as guests book with very short notice (2 days avg.).
- Target marketing efforts for the Winter season well in advance (at least 16 days) to capture early planners.
- Monitor your own booking lead times against these Lobitos averages to identify opportunities for dynamic pricing adjustments.
Popular & Essential Airbnb Amenities in Lobitos (2026)
Amenity Prevalence
Amenity Insights for Lobitos
- Essential amenities in Lobitos that guests expect include: Wifi. Lacking these (this) could significantly impact bookings.
- Popular amenities like Free parking on premises, Bed linens, Refrigerator are common but not universal. Offering these can provide a competitive edge.
Recommendations for Hosts
- Ensure your listing includes all essential amenities for Lobitos: Wifi.
- Consider adding popular differentiators like Free parking on premises or Bed linens to increase appeal.
- Highlight unique or less common amenities you offer (e.g., hot tub, dedicated workspace, EV charger) in your listing description and photos.
- Regularly check competitor amenities in Lobitos to stay competitive.
Lobitos Airbnb Guest Demographics & Profile Analysis (2026)
Guest Profile Summary for Lobitos
- The typical guest profile for Airbnb in Lobitos consists of predominantly international visitors (81%), with top international origins including Peru, typically belonging to the Post-2000s (Gen Z/Alpha) group (50%), primarily speaking English or Spanish.
- Domestic travelers account for 18.9% of guests.
- Key international markets include United States (27%) and Peru (18.9%).
- Top languages spoken are English (35.2%) followed by Spanish (29.6%).
- A significant demographic segment is the Post-2000s (Gen Z/Alpha) group, representing 50% of guests.
Recommendations for Hosts
- Focus marketing internationally, particularly towards travelers from Peru.
- Tailor amenities and listing descriptions to appeal to the dominant Post-2000s (Gen Z/Alpha) demographic (e.g., highlight fast WiFi, smart home features, local guides).
- Highlight unique local experiences or amenities relevant to the primary guest profile.
- Consider seasonal promotions aligned with peak travel times for key origin markets.
Nearby Short-Term Rental Market Comparison
How does the Lobitos Airbnb market stack up against its neighbors? Compare key performance metrics like average monthly revenue, ADR, and occupancy rates in surrounding areas to understand the broader regional STR landscape.
| Market | Active Properties | Monthly Revenue | Daily Rate | Avg. Occupancy |
|---|---|---|---|---|
| District of Canoas de Punta Sal | 196 | $1,096 | $203.77 | 23% |
| Los Órganos | 346 | $1,044 | $182.15 | 25% |
| Máncora | 400 | $1,033 | $158.34 | 27% |
| District of Zorritos | 245 | $685 | $152.69 | 21% |
| Colán | 55 | $332 | $132.47 | 14% |
| Piura | 194 | $228 | $46.60 | 27% |
| District of Tumbes | 37 | $204 | $44.17 | 27% |
| 26 de Octubre | 27 | $161 | $37.01 | 25% |
| Castilla | 58 | $146 | $31.06 | 26% |
| Pariñas | 10 | $104 | $31.11 | 17% |