Lamas Airbnb Market Analysis 2026: Short Term Rental Data & Vacation Rental Statistics in San Martín, Peru
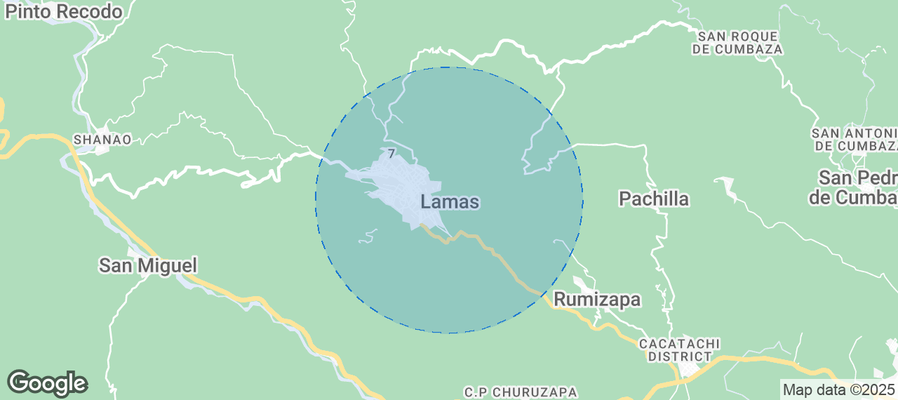
Is Airbnb profitable in Lamas in 2026? Explore comprehensive Airbnb analytics for Lamas, San Martín, Peru to uncover income potential. This 2026 STR market report for Lamas, based on AirROI data from May 2024 to April 2025, reveals key trends in the niche market of 22 active listings.
Whether you're considering an Airbnb investment in Lamas, optimizing your existing vacation rental, or exploring rental arbitrage opportunities, understanding the Lamas Airbnb data is crucial. Leveraging the low regulation environment is key to maximizing your short term rental income potential. Let's dive into the specifics.
Key Lamas Airbnb Performance Metrics Overview
Monthly Airbnb Revenue Variations & Income Potential in Lamas (2026)
Understanding the monthly revenue variations for Airbnb listings in Lamas is key to maximizing your short term rental income potential. Seasonality significantly impacts earnings. Our analysis, based on data from the past 12 months, shows that the peak revenue month for STRs in Lamas is typically November, while October often presents the lowest earnings, highlighting opportunities for strategic pricing adjustments during shoulder and low seasons. Explore the typical Airbnb income in Lamas across different performance tiers:
- Best-in-class properties (Top 10%) achieve $2,404+ monthly, often utilizing dynamic pricing and superior guest experiences.
- Strong performing properties (Top 25%) earn $533 or more, indicating effective management and desirable locations/amenities.
- Typical properties (Median) generate around $275 per month, representing the average market performance.
- Entry-level properties (Bottom 25%) see earnings around $154, often with potential for optimization.
Average Monthly Airbnb Earnings Trend in Lamas
Lamas Airbnb Occupancy Rate Trends (2026)
Maximize your bookings by understanding the Lamas STR occupancy trends. Seasonal demand shifts significantly influence how often properties are booked. Typically, Maysees the highest demand (peak season occupancy), while October experiences the lowest (low season). Effective strategies, like adjusting minimum stays or offering promotions, can boost occupancy during slower periods. Here's how different property tiers perform in Lamas:
- Best-in-class properties (Top 10%) achieve 49%+ occupancy, indicating high desirability and potentially optimized availability.
- Strong performing properties (Top 25%) maintain 29% or higher occupancy, suggesting good market fit and guest satisfaction.
- Typical properties (Median) have an occupancy rate around 17%.
- Entry-level properties (Bottom 25%) average 10% occupancy, potentially facing higher vacancy.
Average Monthly Occupancy Rate Trend in Lamas
Average Daily Rate (ADR) Airbnb Trends in Lamas (2026)
Effective short term rental pricing strategy in Lamas involves understanding monthly ADR fluctuations. The Average Daily Rate (ADR) for Airbnb in Lamas typically peaks in July and dips lowest during December. Leveraging Airbnb dynamic pricing tools or strategies based on this seasonality can significantly boost revenue. Here's a look at the typical nightly rates achieved:
- Best-in-class properties (Top 10%) command rates of $137+ per night, often due to premium features or locations.
- Strong performing properties (Top 25%) achieve nightly rates of $57 or more.
- Typical properties (Median) charge around $30 per night.
- Entry-level properties (Bottom 25%) earn around $23 per night.
Average Daily Rate (ADR) Trend by Month in Lamas
Get Live Lamas Market Intelligence 👇
Explore Real-time Analytics
Airbnb Seasonality Analysis & Trends in Lamas (2025)
Peak Season (November, May, June)
- Revenue averages $1,351 per month
- Occupancy rates average 32.7%
- Daily rates average $60
Shoulder Season
- Revenue averages $601 per month
- Occupancy maintains around 23.5%
- Daily rates hold near $55
Low Season (September, October, December)
- Revenue drops to average $119 per month
- Occupancy decreases to average 10.6%
- Daily rates adjust to average $54
Seasonality Insights for Lamas
- The Airbnb seasonality in Lamas shows highly seasonal trends requiring careful strategy. While the sections above show seasonal averages, it's also insightful to look at the extremes:
- During the high season, the absolute peak month showcases Lamas's highest earning potential, with monthly revenues capable of climbing to $1,769, occupancy reaching a high of 35.5%, and ADRs peaking at $61.
- Conversely, the slowest single month of the year, typically falling within the low season, marks the market's lowest point. In this month, revenue might dip to $45, occupancy could drop to 6.5%, and ADRs may adjust down to $41.
- Understanding both the seasonal averages and these monthly peaks and troughs in revenue, occupancy, and ADR is crucial for maximizing your Airbnb profit potential in Lamas.
Seasonal Strategies for Maximizing Profit
- Peak Season: Maximize revenue through premium pricing and potentially longer minimum stays. Ensure high availability.
- Low Season: Offer competitive pricing, special promotions (e.g., extended stay discounts), and flexible cancellation policies. Target off-season travelers like remote workers or budget-conscious guests.
- Shoulder Seasons: Implement dynamic pricing that balances peak and low rates. Target weekend travelers or specific events. Offer slightly more flexible terms than peak season.
- Regularly analyze your own performance against these Lamas seasonality benchmarks and adjust your pricing and availability strategy accordingly.
Best Areas for Airbnb Investment in Lamas (2026)
Exploring the top neighborhoods for short-term rentals in Lamas? This section highlights key areas, outlining why they are attractive for hosts and guests, along with notable local attractions. Consider these locations based on your target guest profile and investment strategy.
| Neighborhood / Area | Why Host Here? (Target Guests & Appeal) | Key Attractions & Landmarks |
|---|---|---|
| Tarapoto | Known as the gateway to the Amazon, Tarapoto is a picturesque town with stunning natural beauty and close proximity to waterfalls and diverse ecosystems. It's a favorite among eco-tourists and adventure seekers. | Ahuashiyacu Waterfall, Tarapoto Botanical Garden, Huallaga River, Papercut Waterfall, Laguna Azul |
| Lamas | Cultural hub known for its indigenous heritage and beautiful landscapes. Offers a unique opportunity for guests interested in local culture and traditions. | Lamas Castle, Lamas Indigenous Community, Quchancho Waterfall, Museo de la Memoria, Laguna del Churo |
| San Martin | Rich in flora and fauna, it offers adventurous activities and eco-tourism. Investors can attract nature lovers and those seeking relaxation in natural settings. | Lake Sauce, Pongo de Caynarachi, Shapaja, Catarata de Las Tres Culturales |
| Pucallpa | A vibrant city along the Ucayali River, popular for its river tours and proximity to Amazonian wildlife. Great for guests looking for adventure and nature. | Yarinacocha Lake, Canoeing in Ucayali River, Pucallpa's Craft Market, Amazonian Museum |
| Moyobamba | Known for its thermal springs and beautiful orchids, it's a peaceful retreat for those looking to relax in a natural setting. | Termales de San Mateo, Orchid Garden, Rio Mayo, Plaza de Armas |
| Chachapoyas | Famous for its archaeological sites and stunning landscapes, it's ideal for those interested in history and outdoor activities. | Kuelap Fortress, Gocta Waterfall, Caverns of Quiocta, Chachapoyas Museum |
| Juanjuí | A less-traveled region with a focus on ecotourism, ideal for attracting guests who want to explore rural Peru and nature. | Shiringayoc River, Area de Conservación Gran Wiñaypaq, Natural Pools of Golondrina |
| Bellavista | Strategically located, it serves as a connecting point between various tourist attractions in the San Martín region, making it suitable for travelers. | Catarata de Huacamaillo, Huallaga River, Bellavista's local markets |
Understanding Airbnb License Requirements & STR Laws in Lamas (2026)
While Lamas, San Martín, Peru currently shows low STR regulations, specific Airbnb license requirements might still exist or change. Always verify the latest short term rental regulations and Airbnb license requirements directly with local government authorities for Lamas to ensure full compliance before hosting.
(Source: AirROI data, 2026, finding no licensed listings among those analyzed)
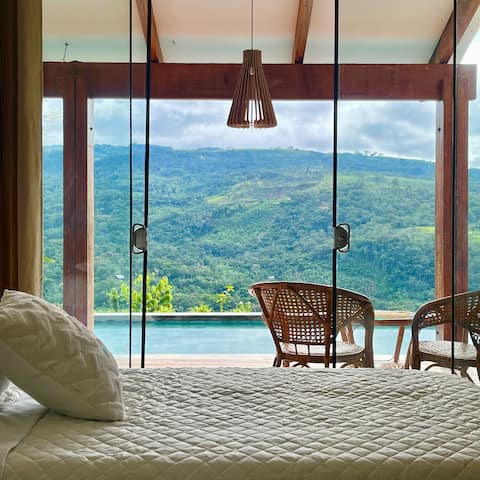
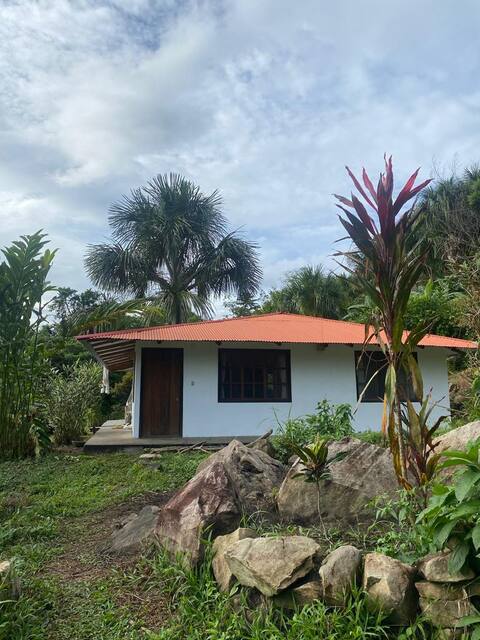
Top Performing Airbnb Properties in Lamas (2026)
Benchmark your potential! Explore examples of top-performing Airbnb properties in Lamasbased on Trailing Twelve Month (TTM) revenue. Analyze their characteristics, revenue, occupancy rate, and ADR to understand what drives success in this market.

Habitación Queen - Casa IV en Fundo Shanti
Private Room • 1 bedroom
Habitación doble - Casa IV en Fundo Shanti
Private Room • 1 bedroom

Ecolodge CasaMarina-Lamas/Luxury Apartment
Entire Place • 3 bedrooms

Casa Las Bromelias
Entire Place • 4 bedrooms
linda casa en Lamas-Tarapoto
Entire Place • 2 bedrooms

Huapo Ecolodge
Private Room • 1 bedroom
Note: Performance varies based on location, size, amenities, seasonality, and management quality. Data reflects the past 12 months.
Top Performing Airbnb Hosts in Lamas (2026)
Learn from the best! This table showcases top-performing Airbnb hosts in Lamas based on the number of properties managed and estimated total revenue over the past year. Analyze their scale and performance metrics.
| Host Name | Properties | Grossing Revenue | Stay Reviews | Avg Rating |
|---|---|---|---|---|
| Host #410489097 | 2 | $29,577 | 0 | 0.00/5.0 |
| Doris | 4 | $9,001 | 32 | 2.37/5.0 |
| Ruben | 3 | $4,137 | 61 | 3.31/5.0 |
| Mabel | 1 | $3,372 | 7 | 5.00/5.0 |
| Host #189568764 | 1 | $3,209 | 0 | 0.00/5.0 |
| Host #119783682 | 1 | $2,952 | 0 | 0.00/5.0 |
| Host #458118494 | 2 | $2,568 | 0 | 0.00/5.0 |
| Host #478454430 | 2 | $2,512 | 0 | 0.00/5.0 |
| Host #494454907 | 1 | $2,360 | 0 | 0.00/5.0 |
| Host #152275231 | 1 | $1,756 | 0 | 0.00/5.0 |
Analyzing the strategies of top hosts, such as their property selection, pricing, and guest communication, can offer valuable lessons for optimizing your own Airbnb operations in Lamas.
Dive Deeper: Advanced Lamas STR Market Data (2026)
Ready to unlock more insights? AirROI provides access to advanced metrics and comprehensive Airbnb data for Lamas. Explore detailed analytics beyond this report to refine your investment strategy, optimize pricing, and maximize your vacation rental profits.
Explore Advanced MetricsLamas Short-Term Rental Market Composition (2026): Property & Room Types
Room Type Distribution
Property Type Distribution
Market Composition Insights for Lamas
- The Lamas Airbnb market composition is heavily skewed towards Private Room listings, which make up 54.5% of the 22 active rentals. This indicates strong guest preference for privacy and space.
- Looking at the property type distribution in Lamas, House properties are the most common (40.9%), reflecting the local real estate landscape.
- Houses represent a significant 40.9% portion, catering likely to families or larger groups.
- The presence of 31.8% Hotel/Boutique listings indicates integration with traditional hospitality.
- Smaller segments like apartment/condo (combined 4.5%) offer potential for unique stay experiences.
Lamas Airbnb Room Capacity Analysis (2026): Bedroom Distribution
Distribution of Listings by Number of Bedrooms
Room Capacity Insights for Lamas
- The dominant room capacity in Lamas is 1 bedroom listings, making up 59.1% of the market. This suggests a strong demand for properties suitable for couples or solo travelers.
- Together, 1 bedroom and 2 bedrooms properties represent 72.7% of the active Airbnb listings in Lamas, indicating a high concentration in these sizes.
- With over half the market (59.1%) consisting of studios or 1-bedroom units, Lamas is particularly well-suited for individuals or couples.
- A significant 22.7% of listings offer 3+ bedrooms, catering to larger groups and families seeking more space in Lamas.
Lamas Vacation Rental Guest Capacity Trends (2026)
Distribution of Listings by Guest Capacity
Guest Capacity Insights for Lamas
- The most common guest capacity trend in Lamas vacation rentals is listings accommodating 2 guests (40.9%). This suggests the primary traveler segment is likely couples or solo travelers.
- Properties designed for 2 guests and 8+ guests dominate the Lamas STR market, accounting for 54.5% of listings.
- A significant 40.9% of listings cater specifically to 1-2 guests, highlighting strong demand from couples and solo travelers in Lamas.
- 27.2% of properties accommodate 6+ guests, serving the market segment for larger families or group travel in Lamas.
- On average, properties in Lamas are equipped to host 3.6 guests.
Lamas Airbnb Booking Patterns (2026): Available vs. Booked Days
Available Days Distribution
Booked Days Distribution
Booking Pattern Insights for Lamas
- The most common availability pattern in Lamas falls within the 271-366 days range, representing 90.9% of listings. This suggests many properties have significant open periods on their calendars.
- Approximately 100.0% of listings show high availability (181+ days open annually), indicating potential for increased bookings or specific owner usage patterns.
- For booked days, the 31-90 days range is most frequent in Lamas (63.6%), reflecting common guest stay durations or potential owner blocking patterns.
Lamas Airbnb Minimum Stay Requirements Analysis
Distribution of Listings by Minimum Night Requirement
1 Night
14 listings
70% of total
2 Nights
6 listings
30% of total
Key Insights
- The most prevalent minimum stay requirement in Lamas is 1 Night, adopted by 70% of listings. This highlights the market's preference for shorter, flexible bookings.
- A strong majority (100.0%) of the Lamas Airbnb data shows acceptance of very short stays (1-2 nights), indicating a dynamic, high-turnover market.
Recommendations
- Align with the market by considering a 1 Night minimum stay, as 70% of Lamas hosts use this setting.
- Adjust minimum nights based on seasonality – potentially shorter during low season and longer during peak demand periods in Lamas.
Lamas Airbnb Cancellation Policy Trends Analysis (2026)
Flexible
6 listings
75% of total
Moderate
2 listings
25% of total
Cancellation Policy Insights for Lamas
- The prevailing Airbnb cancellation policy trend in Lamas is Flexible, used by 75% of listings.
- The market strongly favors guest-friendly terms, with 100.0% of listings offering Flexible or Moderate policies. This suggests guests in Lamas may expect booking flexibility.
Recommendations for Hosts
- Consider adopting a Flexible policy to align with the 75% market standard in Lamas.
- Given the high prevalence of Flexible policies (75%), offering this can enhance booking appeal, especially during shoulder seasons.
- Regularly review your cancellation policy against competitors and market demand shifts in Lamas.
Lamas STR Booking Lead Time Analysis (2026)
Average Booking Lead Time by Month
Booking Lead Time Insights for Lamas
- The overall average booking lead time for vacation rentals in Lamas is 16 days.
- Guests book furthest in advance for stays during July (average 26 days), likely coinciding with peak travel demand or local events.
- The shortest booking windows occur for stays in October (average 2 days), indicating more last-minute travel plans during this time.
- Seasonally, Summer (23 days avg.) sees the longest lead times, while Winter (14 days avg.) has the shortest, reflecting typical travel planning cycles.
Recommendations for Hosts
- Use the overall average lead time (16 days) as a baseline for your pricing and availability strategy in Lamas.
- During October, focus on last-minute booking availability and promotions, as guests book with very short notice (2 days avg.).
- Target marketing efforts for the Summer season well in advance (at least 23 days) to capture early planners.
- Monitor your own booking lead times against these Lamas averages to identify opportunities for dynamic pricing adjustments.
Popular & Essential Airbnb Amenities in Lamas (2026)
Amenity Prevalence
Amenity Insights for Lamas
- Essential amenities in Lamas that guests expect include: Kitchen, Wifi, TV. Lacking these (any) could significantly impact bookings.
- Popular amenities like Hot water, Essentials, Washer are common but not universal. Offering these can provide a competitive edge.
Recommendations for Hosts
- Ensure your listing includes all essential amenities for Lamas: Kitchen, Wifi, TV.
- Prioritize adding missing essentials: Kitchen, Wifi, TV.
- Consider adding popular differentiators like Hot water or Essentials to increase appeal.
- Highlight unique or less common amenities you offer (e.g., hot tub, dedicated workspace, EV charger) in your listing description and photos.
- Regularly check competitor amenities in Lamas to stay competitive.
Lamas Airbnb Guest Demographics & Profile Analysis (2026)
Guest Profile Summary for Lamas
- The typical guest profile for Airbnb in Lamas consists of a mix of domestic (62%) and international guests, often arriving from nearby Lima, typically belonging to the Post-2000s (Gen Z/Alpha) group (50%), primarily speaking Spanish or English.
- Domestic travelers account for 61.9% of guests.
- Key international markets include Peru (61.9%) and United States (14.3%).
- Top languages spoken are Spanish (52.4%) followed by English (23.8%).
- A significant demographic segment is the Post-2000s (Gen Z/Alpha) group, representing 50% of guests.
Recommendations for Hosts
- Target domestic marketing efforts towards travelers from Lima and Richmond.
- Tailor amenities and listing descriptions to appeal to the dominant Post-2000s (Gen Z/Alpha) demographic (e.g., highlight fast WiFi, smart home features, local guides).
- Highlight unique local experiences or amenities relevant to the primary guest profile.
- Consider seasonal promotions aligned with peak travel times for key origin markets.
Nearby Short-Term Rental Market Comparison
How does the Lamas Airbnb market stack up against its neighbors? Compare key performance metrics like average monthly revenue, ADR, and occupancy rates in surrounding areas to understand the broader regional STR landscape.
| Market | Active Properties | Monthly Revenue | Daily Rate | Avg. Occupancy |
|---|---|---|---|---|
| Sauce | 18 | $700 | $114.20 | 28% |
| Cacatachi | 17 | $606 | $110.16 | 28% |
| Valera | 17 | $418 | $89.26 | 22% |
| La Banda de Shilcayo | 67 | $397 | $46.42 | 25% |
| Tarapoto | 249 | $314 | $36.83 | 30% |
| Chachapoyas | 53 | $220 | $42.47 | 24% |
| Morales | 46 | $158 | $25.76 | 25% |
| Moyobamba | 41 | $142 | $34.02 | 23% |
| San Antonio | 12 | $99 | $24.51 | 14% |