Tacna Airbnb Market Analysis 2025: Short Term Rental Data & Vacation Rental Statistics in Tacna, Peru
Is Airbnb profitable in Tacna in 2025? Explore comprehensive Airbnb analytics for Tacna, Tacna, Peru to uncover income potential. This 2025 STR market report for Tacna, based on AirROI data from June 2024 to May 2025, reveals key trends in the market of 234 active listings.
Whether you're considering an Airbnb investment in Tacna, optimizing your existing vacation rental, or exploring rental arbitrage opportunities, understanding the Tacna Airbnb data is crucial. Leveraging the low regulation environment is key to maximizing your short term rental income potential. Let's dive into the specifics.
Key Tacna Airbnb Performance Metrics Overview
Monthly Airbnb Revenue Variations & Income Potential in Tacna (2025)
Understanding the monthly revenue variations for Airbnb listings in Tacna is key to maximizing your short term rental income potential. Seasonality significantly impacts earnings. Our analysis, based on data from the past 12 months, shows that the peak revenue month for STRs in Tacna is typically February, while November often presents the lowest earnings, highlighting opportunities for strategic pricing adjustments during shoulder and low seasons. Explore the typical Airbnb income in Tacna across different performance tiers:
- Best-in-class properties (Top 10%) achieve $671+ monthly, often utilizing dynamic pricing and superior guest experiences.
- Strong performing properties (Top 25%) earn $410 or more, indicating effective management and desirable locations/amenities.
- Typical properties (Median) generate around $228 per month, representing the average market performance.
- Entry-level properties (Bottom 25%) see earnings around $112, often with potential for optimization.
Average Monthly Airbnb Earnings Trend in Tacna
Tacna Airbnb Occupancy Rate Trends (2025)
Maximize your bookings by understanding the Tacna STR occupancy trends. Seasonal demand shifts significantly influence how often properties are booked. Typically, Februarysees the highest demand (peak season occupancy), while May experiences the lowest (low season). Effective strategies, like adjusting minimum stays or offering promotions, can boost occupancy during slower periods. Here's how different property tiers perform in Tacna:
- Best-in-class properties (Top 10%) achieve 64%+ occupancy, indicating high desirability and potentially optimized availability.
- Strong performing properties (Top 25%) maintain 44% or higher occupancy, suggesting good market fit and guest satisfaction.
- Typical properties (Median) have an occupancy rate around 25%.
- Entry-level properties (Bottom 25%) average 13% occupancy, potentially facing higher vacancy.
Average Monthly Occupancy Rate Trend in Tacna
Average Daily Rate (ADR) Airbnb Trends in Tacna (2025)
Effective short term rental pricing strategy in Tacna involves understanding monthly ADR fluctuations. The Average Daily Rate (ADR) for Airbnb in Tacna typically peaks in May and dips lowest during December. Leveraging Airbnb dynamic pricing tools or strategies based on this seasonality can significantly boost revenue. Here's a look at the typical nightly rates achieved:
- Best-in-class properties (Top 10%) command rates of $51+ per night, often due to premium features or locations.
- Strong performing properties (Top 25%) achieve nightly rates of $40 or more.
- Typical properties (Median) charge around $30 per night.
- Entry-level properties (Bottom 25%) earn around $22 per night.
Average Daily Rate (ADR) Trend by Month in Tacna
Get Live Tacna Market Intelligence 👇

Explore Real-time Analytics
Airbnb Seasonality Analysis & Trends in Tacna (2025)
Peak Season (February, January, August)
- Revenue averages $394 per month
- Occupancy rates average 38.0%
- Daily rates average $35
Shoulder Season
- Revenue averages $286 per month
- Occupancy maintains around 28.7%
- Daily rates hold near $36
Low Season (June, October, November)
- Revenue drops to average $254 per month
- Occupancy decreases to average 27.5%
- Daily rates adjust to average $34
Seasonality Insights for Tacna
- The Airbnb seasonality in Tacna shows highly seasonal trends requiring careful strategy. While the sections above show seasonal averages, it's also insightful to look at the extremes:
- During the high season, the absolute peak month showcases Tacna's highest earning potential, with monthly revenues capable of climbing to $476, occupancy reaching a high of 44.3%, and ADRs peaking at $38.
- Conversely, the slowest single month of the year, typically falling within the low season, marks the market's lowest point. In this month, revenue might dip to $241, occupancy could drop to 24.6%, and ADRs may adjust down to $34.
- Understanding both the seasonal averages and these monthly peaks and troughs in revenue, occupancy, and ADR is crucial for maximizing your Airbnb profit potential in Tacna.
Seasonal Strategies for Maximizing Profit
- Peak Season: Maximize revenue through premium pricing and potentially longer minimum stays. Ensure high availability.
- Low Season: Offer competitive pricing, special promotions (e.g., extended stay discounts), and flexible cancellation policies. Target off-season travelers like remote workers or budget-conscious guests.
- Shoulder Seasons: Implement dynamic pricing that balances peak and low rates. Target weekend travelers or specific events. Offer slightly more flexible terms than peak season.
- Regularly analyze your own performance against these Tacna seasonality benchmarks and adjust your pricing and availability strategy accordingly.
Best Areas for Airbnb Investment in Tacna (2025)
Exploring the top neighborhoods for short-term rentals in Tacna? This section highlights key areas, outlining why they are attractive for hosts and guests, along with notable local attractions. Consider these locations based on your target guest profile and investment strategy.
| Neighborhood / Area | Why Host Here? (Target Guests & Appeal) | Key Attractions & Landmarks |
|---|---|---|
| Centro Histórico | The historic center of Tacna is rich in culture and history, attracting tourists interested in historical landmarks and local traditions. It's a bustling area with plenty of shops, restaurants, and attractions. | Plaza de Armas, National Museum of Tacna, Casa de la Cultura, Tacna Cathedral, Pascana Park |
| Arica | Close to the border with Chile, Arica is a popular destination for international travelers coming from Peru and enjoying its beaches and vibrant atmosphere. It offers unique blend of cultural experiences. | Las Machas Beach, San Marcos Square, El Morro, Arica's Archaeological Museum, Cerro La Cruz |
| Paso Mores | This area is popular among eco-tourists and those looking to explore natural parks and outdoor activities. It attracts visitors interested in hiking and biodiversity. | Parque Nacional Cerro Blanco, Hiking Trails, Wildlife Viewing, Cultural Workshops |
| Cerro Blanco | Known for its beautiful landscapes and opportunities for adventure sports, this area attracts visitors looking for outdoor experiences and nature activities. | Sandboarding, Paragliding, Hiking, Birdwatching |
| La Yarada | A developing area known for its tranquil environment and proximity to nature, appealing to families and those seeking a quieter stay. | Local Parks, Nature Reserves, Community Festivals |
| Calana | A small district that is gaining popularity for its peaceful atmosphere and agricultural tourism, appealing to those interested in local farming and culture. | Local Farms Tour, Village Cultural Events, Nature Tours |
| Socabaya | Close to Tacna's city center and attracting visitors for its local markets and traditional experiences, this area offers an authentic Peruvian vibe. | Local Markets, Traditional Food Spots, Festivals, Cultural Tours |
| Los Palos | An emerging area for rentals, known for its open spaces and family-friendly environment, attracting tourists looking for community experiences and relaxation. | Community Parks, Outdoor Activities, Local Events |
Understanding Airbnb License Requirements & STR Laws in Tacna (2025)
While Tacna, Tacna, Peru currently shows low STR regulations, specific Airbnb license requirements might still exist or change. Always verify the latest short term rental regulations and Airbnb license requirements directly with local government authorities for Tacna to ensure full compliance before hosting.
(Source: AirROI data, 2025, based on 8% licensed listings)
Top Performing Airbnb Properties in Tacna (2025)
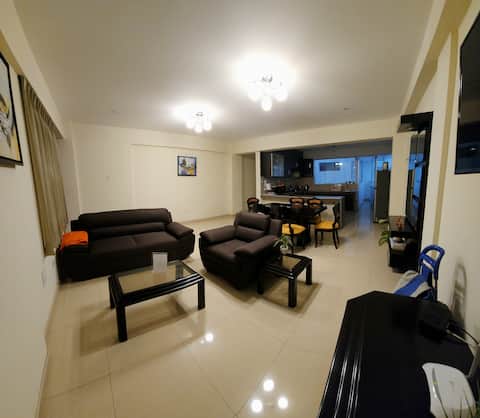
Benchmark your potential! Explore examples of top-performing Airbnb properties in Tacnabased on Trailing Twelve Month (TTM) revenue. Analyze their characteristics, revenue, occupancy rate, and ADR to understand what drives success in this market.
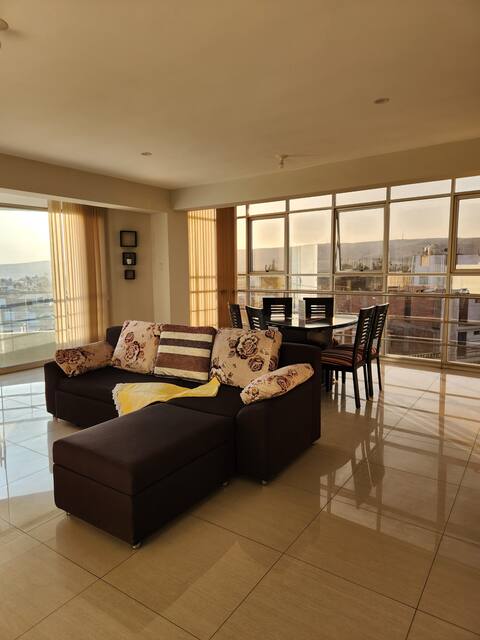
Family Department - Spacious and centrally located
Entire Place • 3 bedrooms

Centrally located apartment 3 bedrooms and Private Garage
Entire Place • 3 bedrooms
Family Department - Centrally located and spacious
Entire Place • 3 bedrooms

Departamento Céntrica Segundo Piso con garage
Entire Place • 3 bedrooms

Departamento Grande, 8 people
Entire Place • 3 bedrooms

WARM STUDIO WITH JACUZZI
Entire Place • 1 bedroom
Note: Performance varies based on location, size, amenities, seasonality, and management quality. Data reflects the past 12 months.
Top Performing Airbnb Hosts in Tacna (2025)
Learn from the best! This table showcases top-performing Airbnb hosts in Tacna based on the number of properties managed and estimated total revenue over the past year. Analyze their scale and performance metrics.
| Host Name | Properties | Grossing Revenue | Stay Reviews | Avg Rating |
|---|---|---|---|---|
| Rocio | 10 | $33,420 | 621 | 4.83/5.0 |
| Carlos | 17 | $32,246 | 706 | 4.80/5.0 |
| Hector | 5 | $22,957 | 123 | 4.94/5.0 |
| Gabriela | 2 | $19,826 | 56 | 4.96/5.0 |
| Ruth | 8 | $18,937 | 223 | 4.91/5.0 |
| Randy | 6 | $15,441 | 77 | 4.73/5.0 |
| Carlos Arnold | 2 | $15,321 | 38 | 4.95/5.0 |
| Nestor Alberto | 8 | $14,678 | 4 | 4.67/5.0 |
| Ronald | 6 | $14,489 | 60 | 4.62/5.0 |
| Eliezer | 14 | $13,409 | 66 | 4.61/5.0 |
Analyzing the strategies of top hosts, such as their property selection, pricing, and guest communication, can offer valuable lessons for optimizing your own Airbnb operations in Tacna.
Dive Deeper: Advanced Tacna STR Market Data (2025)
Ready to unlock more insights? AirROI provides access to advanced metrics and comprehensive Airbnb data for Tacna. Explore detailed analytics beyond this report to refine your investment strategy, optimize pricing, and maximize your vacation rental profits.
Explore Advanced MetricsTacna Short-Term Rental Market Composition (2025): Property & Room Types
Room Type Distribution
Property Type Distribution
Market Composition Insights for Tacna
- The Tacna Airbnb market composition is heavily skewed towards Entire Home/Apt listings, which make up 72.2% of the 234 active rentals. This indicates strong guest preference for privacy and space.
- Looking at the property type distribution in Tacna, Apartment/Condo properties are the most common (71.4%), reflecting the local real estate landscape.
- The presence of 15.8% Hotel/Boutique listings indicates integration with traditional hospitality.
Tacna Airbnb Room Capacity Analysis (2025): Bedroom Distribution
Distribution of Listings by Number of Bedrooms
Room Capacity Insights for Tacna
- The dominant room capacity in Tacna is 1 bedroom listings, making up 40.6% of the market. This suggests a strong demand for properties suitable for couples or solo travelers.
- Together, 1 bedroom and 2 bedrooms properties represent 69.2% of the active Airbnb listings in Tacna, indicating a high concentration in these sizes.
- A significant 23.9% of listings offer 3+ bedrooms, catering to larger groups and families seeking more space in Tacna.
Tacna Vacation Rental Guest Capacity Trends (2025)
Distribution of Listings by Guest Capacity
Guest Capacity Insights for Tacna
- The most common guest capacity trend in Tacna vacation rentals is listings accommodating 2 guests (22.6%). This suggests the primary traveler segment is likely couples or solo travelers.
- Properties designed for 2 guests and 4 guests dominate the Tacna STR market, accounting for 41.8% of listings.
- 25.2% of properties accommodate 6+ guests, serving the market segment for larger families or group travel in Tacna.
- On average, properties in Tacna are equipped to host 4.0 guests.
Tacna Airbnb Booking Patterns (2025): Available vs. Booked Days
Available Days Distribution
Booked Days Distribution
Booking Pattern Insights for Tacna
- The most common availability pattern in Tacna falls within the 271-366 days range, representing 79.9% of listings. This suggests many properties have significant open periods on their calendars.
- Approximately 96.6% of listings show high availability (181+ days open annually), indicating potential for increased bookings or specific owner usage patterns.
- For booked days, the 31-90 days range is most frequent in Tacna (42.3%), reflecting common guest stay durations or potential owner blocking patterns.
- A notable 4.3% of properties secure long booking periods (181+ days booked per year), highlighting successful long-term rental strategies or significant owner usage.
Tacna Airbnb Minimum Stay Requirements Analysis
Distribution of Listings by Minimum Night Requirement
1 Night
110 listings
48.5% of total
2 Nights
89 listings
39.2% of total
3 Nights
5 listings
2.2% of total
30+ Nights
23 listings
10.1% of total
Key Insights
- The most prevalent minimum stay requirement in Tacna is 1 Night, adopted by 48.5% of listings. This highlights the market's preference for shorter, flexible bookings.
- A strong majority (87.7%) of the Tacna Airbnb data shows acceptance of very short stays (1-2 nights), indicating a dynamic, high-turnover market.
- A significant segment (10.1%) caters to monthly stays (30+ nights) in Tacna, pointing to opportunities in the extended-stay market.
Recommendations
- Align with the market by considering a 1 Night minimum stay, as 48.5% of Tacna hosts use this setting.
- Explore offering discounts for stays of 30+ nights to attract the 10.1% of the market seeking extended stays.
- Adjust minimum nights based on seasonality – potentially shorter during low season and longer during peak demand periods in Tacna.
Tacna Airbnb Cancellation Policy Trends Analysis (2025)
Flexible
99 listings
51% of total
Moderate
68 listings
35.1% of total
Firm
14 listings
7.2% of total
Strict
13 listings
6.7% of total
Cancellation Policy Insights for Tacna
- The prevailing Airbnb cancellation policy trend in Tacna is Flexible, used by 51% of listings.
- The market strongly favors guest-friendly terms, with 86.1% of listings offering Flexible or Moderate policies. This suggests guests in Tacna may expect booking flexibility.
- Strict cancellation policies are quite rare (6.7%), potentially making listings with this policy less competitive unless justified by high demand or property type.
Recommendations for Hosts
- Consider adopting a Flexible policy to align with the 51% market standard in Tacna.
- Given the high prevalence of Flexible policies (51%), offering this can enhance booking appeal, especially during shoulder seasons.
- Using a Strict policy might deter some guests, as only 6.7% of listings use it. Evaluate if potential revenue protection outweighs possible lower booking rates.
- Regularly review your cancellation policy against competitors and market demand shifts in Tacna.
Tacna STR Booking Lead Time Analysis (2025)
Average Booking Lead Time by Month
Booking Lead Time Insights for Tacna
- The overall average booking lead time for vacation rentals in Tacna is 11 days.
- Guests book furthest in advance for stays during June (average 19 days), likely coinciding with peak travel demand or local events.
- The shortest booking windows occur for stays in March (average 9 days), indicating more last-minute travel plans during this time.
- Seasonally, Winter (13 days avg.) sees the longest lead times, while Spring (11 days avg.) has the shortest, reflecting typical travel planning cycles.
Recommendations for Hosts
- Use the overall average lead time (11 days) as a baseline for your pricing and availability strategy in Tacna.
- Target marketing efforts for the Winter season well in advance (at least 13 days) to capture early planners.
- Monitor your own booking lead times against these Tacna averages to identify opportunities for dynamic pricing adjustments.
Popular & Essential Airbnb Amenities in Tacna (2025)
Amenity Prevalence
Amenity Insights for Tacna
- Essential amenities in Tacna that guests expect include: Wifi, TV. Lacking these (any) could significantly impact bookings.
- Popular amenities like Hot water, Kitchen, Essentials are common but not universal. Offering these can provide a competitive edge.
Recommendations for Hosts
- Ensure your listing includes all essential amenities for Tacna: Wifi, TV.
- Prioritize adding missing essentials: Wifi, TV.
- Consider adding popular differentiators like Hot water or Kitchen to increase appeal.
- Highlight unique or less common amenities you offer (e.g., hot tub, dedicated workspace, EV charger) in your listing description and photos.
- Regularly check competitor amenities in Tacna to stay competitive.
Tacna Airbnb Guest Demographics & Profile Analysis (2025)
Guest Profile Summary for Tacna
- The typical guest profile for Airbnb in Tacna consists of a mix of domestic (47%) and international guests, with top international origins including Chile, typically belonging to the Post-2000s (Gen Z/Alpha) group (50%), primarily speaking Spanish or English.
- Domestic travelers account for 47.2% of guests.
- Key international markets include Peru (47.2%) and Chile (40.9%).
- Top languages spoken are Spanish (60.3%) followed by English (27.5%).
- A significant demographic segment is the Post-2000s (Gen Z/Alpha) group, representing 50% of guests.
Recommendations for Hosts
- Balance marketing efforts between domestic and international channels based on the guest mix.
- Tailor amenities and listing descriptions to appeal to the dominant Post-2000s (Gen Z/Alpha) demographic (e.g., highlight fast WiFi, smart home features, local guides).
- Highlight unique local experiences or amenities relevant to the primary guest profile.
- Consider seasonal promotions aligned with peak travel times for key origin markets.
Nearby Short-Term Rental Market Comparison
How does the Tacna Airbnb market stack up against its neighbors? Compare key performance metrics like average monthly revenue, ADR, and occupancy rates in surrounding areas to understand the broader regional STR landscape.
| Market | Active Properties | Monthly Revenue | Daily Rate | Avg. Occupancy |
|---|---|---|---|---|
| Mejía | 30 | $590 | $136.26 | 25% |
| Sama | 15 | $401 | $136.54 | 20% |
| Arica | 367 | $264 | $50.25 | 31% |
| Pacocha | 17 | $200 | $38.84 | 26% |
| Ilo | 46 | $186 | $53.21 | 24% |
| Coronel Gregorio Albarracín Lanchipa | 32 | $148 | $30.49 | 27% |
| Moquegua | 21 | $125 | $38.40 | 24% |
| Punta de Bombón | 12 | $98 | $65.74 | 17% |