Limanu Airbnb Market Analysis 2026: Short Term Rental Data & Vacation Rental Statistics in Constanța, Romania
Is Airbnb profitable in Limanu in 2026? Explore comprehensive Airbnb analytics for Limanu, Constanța, Romania to uncover income potential. This 2026 STR market report for Limanu, based on AirROI data from February 2025 to January 2026, reveals key trends in the niche market of 63 active listings.
Whether you're considering an Airbnb investment in Limanu, optimizing your existing vacation rental, or exploring rental arbitrage opportunities, understanding the Limanu Airbnb data is crucial. Leveraging the low regulation environment is key to maximizing your short term rental income potential. Let's dive into the specifics.
Key Limanu Airbnb Performance Metrics Overview
Monthly Airbnb Revenue Variations & Income Potential in Limanu (2026)
Understanding the monthly revenue variations for Airbnb listings in Limanu is key to maximizing your short term rental income potential. Seasonality significantly impacts earnings. Our analysis, based on data from the past 12 months, shows that the peak revenue month for STRs in Limanu is typically March, while January often presents the lowest earnings, highlighting opportunities for strategic pricing adjustments during shoulder and low seasons. Explore the typical Airbnb income in Limanu across different performance tiers:
- Best-in-class properties (Top 10%) achieve $1,690+ monthly, often utilizing dynamic pricing and superior guest experiences.
- Strong performing properties (Top 25%) earn $814 or more, indicating effective management and desirable locations/amenities.
- Typical properties (Median) generate around $447 per month, representing the average market performance.
- Entry-level properties (Bottom 25%) see earnings around $211, often with potential for optimization.
Average Monthly Airbnb Earnings Trend in Limanu
Limanu Airbnb Occupancy Rate Trends (2026)
Maximize your bookings by understanding the Limanu STR occupancy trends. Seasonal demand shifts significantly influence how often properties are booked. Typically, Marchsees the highest demand (peak season occupancy), while February experiences the lowest (low season). Effective strategies, like adjusting minimum stays or offering promotions, can boost occupancy during slower periods. Here's how different property tiers perform in Limanu:
- Best-in-class properties (Top 10%) achieve 48%+ occupancy, indicating high desirability and potentially optimized availability.
- Strong performing properties (Top 25%) maintain 28% or higher occupancy, suggesting good market fit and guest satisfaction.
- Typical properties (Median) have an occupancy rate around 17%.
- Entry-level properties (Bottom 25%) average 11% occupancy, potentially facing higher vacancy.
Average Monthly Occupancy Rate Trend in Limanu
Average Daily Rate (ADR) Airbnb Trends in Limanu (2026)
Effective short term rental pricing strategy in Limanu involves understanding monthly ADR fluctuations. The Average Daily Rate (ADR) for Airbnb in Limanu typically peaks in July and dips lowest during September. Leveraging Airbnb dynamic pricing tools or strategies based on this seasonality can significantly boost revenue. Here's a look at the typical nightly rates achieved:
- Best-in-class properties (Top 10%) command rates of $137+ per night, often due to premium features or locations.
- Strong performing properties (Top 25%) achieve nightly rates of $97 or more.
- Typical properties (Median) charge around $70 per night.
- Entry-level properties (Bottom 25%) earn around $48 per night.
Average Daily Rate (ADR) Trend by Month in Limanu
Get Live Limanu Market Intelligence 👇

Explore Real-time Analytics
Airbnb Seasonality Analysis & Trends in Limanu (2026)
Peak Season (March, August, July)
- Revenue averages $1,204 per month
- Occupancy rates average 38.3%
- Daily rates average $85
Shoulder Season
- Revenue averages $635 per month
- Occupancy maintains around 17.3%
- Daily rates hold near $81
Low Season (January, May, November)
- Revenue drops to average $275 per month
- Occupancy decreases to average 10.1%
- Daily rates adjust to average $81
Seasonality Insights for Limanu
- The Airbnb seasonality in Limanu shows highly seasonal trends requiring careful strategy. While the sections above show seasonal averages, it's also insightful to look at the extremes:
- During the high season, the absolute peak month showcases Limanu's highest earning potential, with monthly revenues capable of climbing to $1,350, occupancy reaching a high of 39.4%, and ADRs peaking at $88.
- Conversely, the slowest single month of the year, typically falling within the low season, marks the market's lowest point. In this month, revenue might dip to $0, occupancy could drop to 0.0%, and ADRs may adjust down to $79.
- Understanding both the seasonal averages and these monthly peaks and troughs in revenue, occupancy, and ADR is crucial for maximizing your Airbnb profit potential in Limanu.
Seasonal Strategies for Maximizing Profit
- Peak Season: Maximize revenue through premium pricing and potentially longer minimum stays. Ensure high availability.
- Low Season: Offer competitive pricing, special promotions (e.g., extended stay discounts), and flexible cancellation policies. Target off-season travelers like remote workers or budget-conscious guests.
- Shoulder Seasons: Implement dynamic pricing that balances peak and low rates. Target weekend travelers or specific events. Offer slightly more flexible terms than peak season.
- Regularly analyze your own performance against these Limanu seasonality benchmarks and adjust your pricing and availability strategy accordingly.
Best Areas for Airbnb Investment in Limanu (2026)
Exploring the top neighborhoods for short-term rentals in Limanu? This section highlights key areas, outlining why they are attractive for hosts and guests, along with notable local attractions. Consider these locations based on your target guest profile and investment strategy.
| Neighborhood / Area | Why Host Here? (Target Guests & Appeal) | Key Attractions & Landmarks |
|---|---|---|
| Limanu Beach | A serene beach area ideal for families and beach lovers, offering uncrowded shores and a relaxed atmosphere. Perfect for guests looking to escape the bustling tourist spots. | Limanu Beach, Fishing excursions, Local seafood restaurants, Sunbathing areas, Water sports facilities |
| Constanța Old Town | Rich in history and culture, this area attracts tourists who want to explore the heritage of Constanța. Ideal for those seeking a mix of relaxation and sightseeing. | Roman Edifice with Mosaic, The Great Mahmudiye Mosque, Gemini Square, Constanța Casino, Museum of National History and Archeology |
| Mamaia | Famous for its vibrant nightlife and sandy beaches, Mamaia is an ideal spot for tourists looking for entertainment, bars, and a lively atmosphere, especially during summer. | Mamaia Beach, Mamaia Casino, Aquarium, Seaweed spa treatments, Nightclubs and bars |
| Navodari | A quieter alternative to Mamaia, appealing to families and groups looking for spacious accommodations and a more laid-back beach experience. | Navodari Beach, Local markets, Seaside promenade, Water parks, Fishing spots |
| Techirghiol | Known for its therapeutic salt lake, this area attracts health-conscious visitors seeking wellness and spa treatments, making it a unique offering for Airbnb stays. | Techirghiol Lake, Spa and wellness centers, Cultural festivals, Local handicraft shops, Rural landscapes |
| Eforie Nord | A popular resort town with therapeutic mud and seawater, Eforie Nord is attractive for health tourism, making it a target for guests looking to relax and rejuvenate. | Eforie Nord Beach, Thermal baths, Local restaurants, Water parks, Fun fairs |
| Sulina | Located at the mouth of the Danube, Sulina attracts nature lovers and bird watchers. Ideal for eco-tourism and unique experiences away from traditional beach spots. | Danube Delta Biosphere Reserve, Birdwatching, Cultural heritage sites, Boat tours, Fishing excursions |
| Vama Veche | A bohemian beach destination popular among young travelers and alternative culture enthusiasts. Known for its free spirit and music festivals, it’s a hotspot for a unique Airbnb stay. | Vama Veche Beach, Local music festivals, Art galleries, Beach bars, Camping opportunities |
Understanding Airbnb License Requirements & STR Laws in Limanu (2026)
While Limanu, Constanța, Romania currently shows low STR regulations, specific Airbnb license requirements might still exist or change. Always verify the latest short term rental regulations and Airbnb license requirements directly with local government authorities for Limanu to ensure full compliance before hosting.
(Source: AirROI data, 2026, finding no licensed listings among those analyzed)
Top Performing Airbnb Properties in Limanu (2026)
Benchmark your potential! Explore examples of top-performing Airbnb properties in Limanubased on Trailing Twelve Month (TTM) revenue. Analyze their characteristics, revenue, occupancy rate, and ADR to understand what drives success in this market.

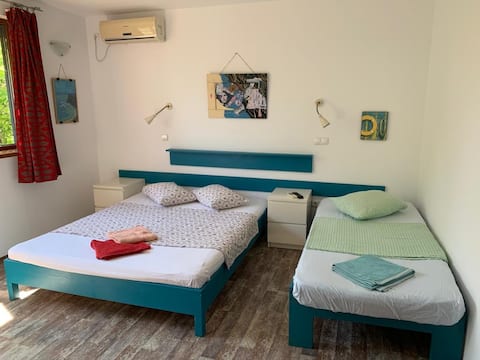
Private beach house
Entire Place • 5 bedrooms

traditional house 2 with beach exit
Entire Place • 3 bedrooms

Vamandipity SeaBreeze
Entire Place • 1 bedroom

Traditional house with exit to the beach
Entire Place • 2 bedrooms

Mobile tiny house by the beach up to 6 persons
Entire Place • 2 bedrooms
Cozy Triple Next to the Beach
Private Room • 1 bedroom
Note: Performance varies based on location, size, amenities, seasonality, and management quality. Data reflects the past 12 months.
Top Performing Airbnb Hosts in Limanu (2026)
Learn from the best! This table showcases top-performing Airbnb hosts in Limanu based on the number of properties managed and estimated total revenue over the past year. Analyze their scale and performance metrics.
| Host Name | Properties | Grossing Revenue | Stay Reviews | Avg Rating |
|---|---|---|---|---|
| Raluca | 1 | $48,203 | 4 | 5.00/5.0 |
| Florin | 6 | $23,255 | 66 | 4.99/5.0 |
| Tudor | 3 | $22,367 | 57 | 4.93/5.0 |
| Tudor | 6 | $20,199 | 16 | 4.49/5.0 |
| Mihaela | 3 | $12,404 | 64 | 4.94/5.0 |
| Sup | 9 | $11,997 | 125 | 4.86/5.0 |
| Mihaela | 3 | $8,787 | 74 | 4.92/5.0 |
| Letitia | 2 | $7,562 | 33 | 4.97/5.0 |
| Albirom | 2 | $6,491 | 2 | Not Rated |
| Daniel Claudiu | 2 | $4,690 | 2 | Not Rated |
Analyzing the strategies of top hosts, such as their property selection, pricing, and guest communication, can offer valuable lessons for optimizing your own Airbnb operations in Limanu.
Dive Deeper: Advanced Limanu STR Market Data (2026)
Ready to unlock more insights? AirROI provides access to advanced metrics and comprehensive Airbnb data for Limanu. Explore detailed analytics beyond this report to refine your investment strategy, optimize pricing, and maximize your vacation rental profits.
Explore Advanced MetricsLimanu Short-Term Rental Market Composition (2026): Property & Room Types
Room Type Distribution
Property Type Distribution
Market Composition Insights for Limanu
- The Limanu Airbnb market composition is heavily skewed towards Private Room listings, which make up 61.9% of the 63 active rentals. This indicates strong guest preference for privacy and space.
- Looking at the property type distribution in Limanu, House properties are the most common (54%), reflecting the local real estate landscape.
- Houses represent a significant 54% portion, catering likely to families or larger groups.
- The presence of 28.6% Hotel/Boutique listings indicates integration with traditional hospitality.
- Smaller segments like apartment/condo, others (combined 4.8%) offer potential for unique stay experiences.
Limanu Airbnb Room Capacity Analysis (2026): Bedroom Distribution
Distribution of Listings by Number of Bedrooms
Room Capacity Insights for Limanu
- The dominant room capacity in Limanu is 1 bedroom listings, making up 23.8% of the market. This suggests a strong demand for properties suitable for couples or solo travelers.
- Together, 1 bedroom and 2 bedrooms properties represent 39.7% of the active Airbnb listings in Limanu, indicating a high concentration in these sizes.
- A significant 22.3% of listings offer 3+ bedrooms, catering to larger groups and families seeking more space in Limanu.
Limanu Vacation Rental Guest Capacity Trends (2026)
Distribution of Listings by Guest Capacity
Guest Capacity Insights for Limanu
- The most common guest capacity trend in Limanu vacation rentals is listings accommodating 2 guests (19%). This suggests the primary traveler segment is likely couples or solo travelers.
- Properties designed for 2 guests and 4 guests dominate the Limanu STR market, accounting for 31.7% of listings.
- On average, properties in Limanu are equipped to host 1.7 guests.
Limanu Airbnb Booking Patterns (2026): Available vs. Booked Days
Available Days Distribution
Booked Days Distribution
Booking Pattern Insights for Limanu
- The most common availability pattern in Limanu falls within the 271-366 days range, representing 98.4% of listings. This suggests many properties have significant open periods on their calendars.
- Approximately 100.0% of listings show high availability (181+ days open annually), indicating potential for increased bookings or specific owner usage patterns.
- For booked days, the 1-30 days range is most frequent in Limanu (58.7%), reflecting common guest stay durations or potential owner blocking patterns.
Limanu Airbnb Minimum Stay Requirements Analysis
Distribution of Listings by Minimum Night Requirement
1 Night
7 listings
11.1% of total
2 Nights
20 listings
31.7% of total
3 Nights
7 listings
11.1% of total
4-6 Nights
3 listings
4.8% of total
30+ Nights
26 listings
41.3% of total
Key Insights
- The most prevalent minimum stay requirement in Limanu is 30+ Nights, adopted by 41.3% of listings. This highlights the market's preference for longer commitments.
- A significant segment (41.3%) caters to monthly stays (30+ nights) in Limanu, pointing to opportunities in the extended-stay market.
Recommendations
- Align with the market by considering a 30+ Nights minimum stay, as 41.3% of Limanu hosts use this setting.
- If feasible, allowing 1-night stays, especially midweek or during low season, could capture last-minute bookings, as only 11.1% currently do.
- A 2-night minimum appears standard (31.7%). Consider this for weekends or peak periods.
- Explore offering discounts for stays of 30+ nights to attract the 41.3% of the market seeking extended stays.
- Adjust minimum nights based on seasonality – potentially shorter during low season and longer during peak demand periods in Limanu.
Limanu Airbnb Cancellation Policy Trends Analysis (2026)
Limited
1 listings
1.6% of total
Flexible
18 listings
29% of total
Moderate
13 listings
21% of total
Firm
24 listings
38.7% of total
Strict
6 listings
9.7% of total
Cancellation Policy Insights for Limanu
- The prevailing Airbnb cancellation policy trend in Limanu is Firm, used by 38.7% of listings.
- There's a relatively balanced mix between guest-friendly (50.0%) and stricter (48.4%) policies, offering choices for different guest needs.
- Strict cancellation policies are quite rare (9.7%), potentially making listings with this policy less competitive unless justified by high demand or property type.
Recommendations for Hosts
- Consider adopting a Firm policy to align with the 38.7% market standard in Limanu.
- Using a Strict policy might deter some guests, as only 9.7% of listings use it. Evaluate if potential revenue protection outweighs possible lower booking rates.
- Regularly review your cancellation policy against competitors and market demand shifts in Limanu.
Limanu STR Booking Lead Time Analysis (2026)
Average Booking Lead Time by Month
Booking Lead Time Insights for Limanu
- The overall average booking lead time for vacation rentals in Limanu is 49 days.
- Guests book furthest in advance for stays during October (average 186 days), likely coinciding with peak travel demand or local events.
- The shortest booking windows occur for stays in November (average 0 days), indicating more last-minute travel plans during this time.
- Seasonally, Fall (73 days avg.) sees the longest lead times, while Summer (40 days avg.) has the shortest, reflecting typical travel planning cycles.
Recommendations for Hosts
- Use the overall average lead time (49 days) as a baseline for your pricing and availability strategy in Limanu.
- For October stays, consider implementing length-of-stay discounts or slightly higher rates for bookings made less than 186 days out to capitalize on advance planning.
- During November, focus on last-minute booking availability and promotions, as guests book with very short notice (0 days avg.).
- Target marketing efforts for the Fall season well in advance (at least 73 days) to capture early planners.
- Monitor your own booking lead times against these Limanu averages to identify opportunities for dynamic pricing adjustments.
Popular & Essential Airbnb Amenities in Limanu (2026)
Amenity Prevalence
Amenity Insights for Limanu
- Essential amenities in Limanu that guests expect include: Wifi. Lacking these (this) could significantly impact bookings.
- Popular amenities like Essentials, Outdoor dining area, Hot water are common but not universal. Offering these can provide a competitive edge.
Recommendations for Hosts
- Ensure your listing includes all essential amenities for Limanu: Wifi.
- Prioritize adding missing essentials: Wifi.
- Consider adding popular differentiators like Essentials or Outdoor dining area to increase appeal.
- Highlight unique or less common amenities you offer (e.g., hot tub, dedicated workspace, EV charger) in your listing description and photos.
- Regularly check competitor amenities in Limanu to stay competitive.
Limanu Airbnb Guest Demographics & Profile Analysis (2026)
Guest Profile Summary for Limanu
- The typical guest profile for Airbnb in Limanu consists of a mix of domestic (59%) and international guests, often arriving from nearby Bucharest, typically belonging to the Post-2000s (Gen Z/Alpha) group (50%), primarily speaking English or Romanian.
- Domestic travelers account for 58.7% of guests.
- Key international markets include Romania (58.7%) and United Kingdom (13%).
- Top languages spoken are English (40.3%) followed by Romanian (14.9%).
- A significant demographic segment is the Post-2000s (Gen Z/Alpha) group, representing 50% of guests.
Recommendations for Hosts
- Balance marketing efforts between domestic and international channels based on the guest mix.
- Tailor amenities and listing descriptions to appeal to the dominant Post-2000s (Gen Z/Alpha) demographic (e.g., highlight fast WiFi, smart home features, local guides).
- Highlight unique local experiences or amenities relevant to the primary guest profile.
- Consider seasonal promotions aligned with peak travel times for key origin markets.
Nearby Short-Term Rental Market Comparison
How does the Limanu Airbnb market stack up against its neighbors? Compare key performance metrics like average monthly revenue, ADR, and occupancy rates in surrounding areas to understand the broader regional STR landscape.
| Market | Active Properties | Monthly Revenue | Daily Rate | Avg. Occupancy |
|---|---|---|---|---|
| Rogachevo | 12 | $1,464 | $213.81 | 30% |
| Bozhurets | 13 | $751 | $160.05 | 36% |
| Obrochishte | 26 | $716 | $188.57 | 28% |
| Balchik | 130 | $709 | $164.80 | 27% |
| Jurilovca | 18 | $584 | $280.01 | 23% |
| Năvodari | 845 | $543 | $189.57 | 28% |
| Varna | 1,397 | $523 | $82.73 | 37% |
| Mamaia-Sat | 112 | $509 | $135.07 | 39% |
| Constanța | 610 | $479 | $109.92 | 31% |
| Topola | 36 | $461 | $107.07 | 33% |