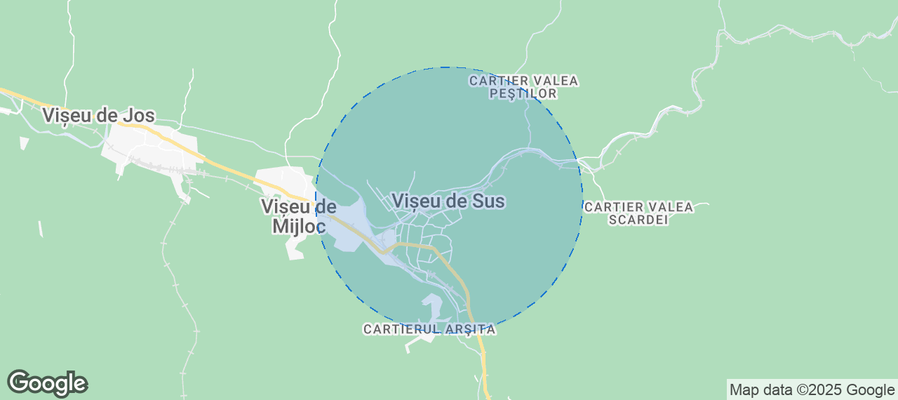
Vișeu de Sus Airbnb Market Analysis 2026: Short Term Rental Data & Vacation Rental Statistics in Maramureș, Romania
Is Airbnb profitable in Vișeu de Sus in 2026? Explore comprehensive Airbnb analytics for Vișeu de Sus, Maramureș, Romania to uncover income potential. This 2026 STR market report for Vișeu de Sus, based on AirROI data from February 2025 to January 2026, reveals key trends in the niche market of 23 active listings.
Whether you're considering an Airbnb investment in Vișeu de Sus, optimizing your existing vacation rental, or exploring rental arbitrage opportunities, understanding the Vișeu de Sus Airbnb data is crucial. Leveraging the low regulation environment is key to maximizing your short term rental income potential. Let's dive into the specifics.
Key Vișeu de Sus Airbnb Performance Metrics Overview
Monthly Airbnb Revenue Variations & Income Potential in Vișeu de Sus (2026)
Understanding the monthly revenue variations for Airbnb listings in Vișeu de Sus is key to maximizing your short term rental income potential. Seasonality significantly impacts earnings. Our analysis, based on data from the past 12 months, shows that the peak revenue month for STRs in Vișeu de Sus is typically November, while January often presents the lowest earnings, highlighting opportunities for strategic pricing adjustments during shoulder and low seasons. Explore the typical Airbnb income in Vișeu de Sus across different performance tiers:
- Best-in-class properties (Top 10%) achieve $1,695+ monthly, often utilizing dynamic pricing and superior guest experiences.
- Strong performing properties (Top 25%) earn $1,154 or more, indicating effective management and desirable locations/amenities.
- Typical properties (Median) generate around $684 per month, representing the average market performance.
- Entry-level properties (Bottom 25%) see earnings around $334, often with potential for optimization.
Average Monthly Airbnb Earnings Trend in Vișeu de Sus
Vișeu de Sus Airbnb Occupancy Rate Trends (2026)
Maximize your bookings by understanding the Vișeu de Sus STR occupancy trends. Seasonal demand shifts significantly influence how often properties are booked. Typically, Augustsees the highest demand (peak season occupancy), while January experiences the lowest (low season). Effective strategies, like adjusting minimum stays or offering promotions, can boost occupancy during slower periods. Here's how different property tiers perform in Vișeu de Sus:
- Best-in-class properties (Top 10%) achieve 56%+ occupancy, indicating high desirability and potentially optimized availability.
- Strong performing properties (Top 25%) maintain 31% or higher occupancy, suggesting good market fit and guest satisfaction.
- Typical properties (Median) have an occupancy rate around 19%.
- Entry-level properties (Bottom 25%) average 14% occupancy, potentially facing higher vacancy.
Average Monthly Occupancy Rate Trend in Vișeu de Sus
Average Daily Rate (ADR) Airbnb Trends in Vișeu de Sus (2026)
Effective short term rental pricing strategy in Vișeu de Sus involves understanding monthly ADR fluctuations. The Average Daily Rate (ADR) for Airbnb in Vișeu de Sus typically peaks in January and dips lowest during April. Leveraging Airbnb dynamic pricing tools or strategies based on this seasonality can significantly boost revenue. Here's a look at the typical nightly rates achieved:
- Best-in-class properties (Top 10%) command rates of $179+ per night, often due to premium features or locations.
- Strong performing properties (Top 25%) achieve nightly rates of $123 or more.
- Typical properties (Median) charge around $81 per night.
- Entry-level properties (Bottom 25%) earn around $47 per night.
Average Daily Rate (ADR) Trend by Month in Vișeu de Sus
Get Live Vișeu de Sus Market Intelligence 👇
Explore Real-time Analytics
Airbnb Seasonality Analysis & Trends in Vișeu de Sus (2026)
Peak Season (November, August, June)
- Revenue averages $1,022 per month
- Occupancy rates average 30.8%
- Daily rates average $94
Shoulder Season
- Revenue averages $869 per month
- Occupancy maintains around 27.5%
- Daily rates hold near $96
Low Season (January, March, April)
- Revenue drops to average $500 per month
- Occupancy decreases to average 18.8%
- Daily rates adjust to average $93
Seasonality Insights for Vișeu de Sus
- The Airbnb seasonality in Vișeu de Sus shows highly seasonal trends requiring careful strategy. While the sections above show seasonal averages, it's also insightful to look at the extremes:
- During the high season, the absolute peak month showcases Vișeu de Sus's highest earning potential, with monthly revenues capable of climbing to $1,053, occupancy reaching a high of 35.0%, and ADRs peaking at $104.
- Conversely, the slowest single month of the year, typically falling within the low season, marks the market's lowest point. In this month, revenue might dip to $442, occupancy could drop to 13.2%, and ADRs may adjust down to $88.
- Understanding both the seasonal averages and these monthly peaks and troughs in revenue, occupancy, and ADR is crucial for maximizing your Airbnb profit potential in Vișeu de Sus.
Seasonal Strategies for Maximizing Profit
- Peak Season: Maximize revenue through premium pricing and potentially longer minimum stays. Ensure high availability.
- Low Season: Offer competitive pricing, special promotions (e.g., extended stay discounts), and flexible cancellation policies. Target off-season travelers like remote workers or budget-conscious guests.
- Shoulder Seasons: Implement dynamic pricing that balances peak and low rates. Target weekend travelers or specific events. Offer slightly more flexible terms than peak season.
- Regularly analyze your own performance against these Vișeu de Sus seasonality benchmarks and adjust your pricing and availability strategy accordingly.
Best Areas for Airbnb Investment in Vișeu de Sus (2026)
Exploring the top neighborhoods for short-term rentals in Vișeu de Sus? This section highlights key areas, outlining why they are attractive for hosts and guests, along with notable local attractions. Consider these locations based on your target guest profile and investment strategy.
| Neighborhood / Area | Why Host Here? (Target Guests & Appeal) | Key Attractions & Landmarks |
|---|---|---|
| Centru Vișeu | The central area of Vișeu de Sus offers a mix of cultural attractions and easy access to local amenities. It’s perfect for tourists looking to experience the authentic lifestyle of the town. | Vișeu de Sus Railway, Wooden Churches of Maramureș, local markets, Vișeu River, restaurants serving traditional Romanian cuisine |
| Mocănița Train Station | Famous for the narrow-gauge steam railway, this area attracts tourists interested in unique travel experiences and picturesque landscapes. | Mocănița Steam Train, Vișeu de Sus Railway, scenic train rides through the Carpathians, cultural events related to the railway |
| Maramureș Mountains | A UNESCO World Heritage site known for its natural beauty and rural tourism. Ideal for outdoor enthusiasts and nature lovers looking for adventure and tranquility. | Hiking trails, Scenic views, traditional villages, outdoor sports, nature reserves |
| Cascada Cailor | One of the tallest waterfalls in Romania, this area is a natural attraction that draws visitors looking for breathtaking landscapes and hiking opportunities. | Cascada Cailor, hiking trails, picnic areas, nature photography opportunities |
| Bârsana Monastery | A key attraction in Maramureș, this beautiful wooden monastery attracts visitors interested in history, culture, and spirituality. | Bârsana Monastery, wooden churches, cultural heritage, guided tours |
| Botiza Village | Known for its traditional crafts and rural tourism, this village offers a glimpse into the local way of life and is attractive to culturally curious visitors. | traditional crafts, local festivals, artisan workshops, quaint village life |
| Repeda Valley | An area known for its scenic landscapes and outdoor activities, appealing to nature enthusiasts and those looking for adventure. | hiking, wildlife watching, peaceful nature spots, outdoor activities |
| Moisei Monastery | This area is known for its spiritual significance and beautiful natural settings, drawing visitors who are interested in religious and cultural tourism. | Moisei Monastery, scenic views, local folklore, nature walks |
Understanding Airbnb License Requirements & STR Laws in Vișeu de Sus (2026)
While Vișeu de Sus, Maramureș, Romania currently shows low STR regulations, specific Airbnb license requirements might still exist or change. Always verify the latest short term rental regulations and Airbnb license requirements directly with local government authorities for Vișeu de Sus to ensure full compliance before hosting.
(Source: AirROI data, 2026, finding no licensed listings among those analyzed)
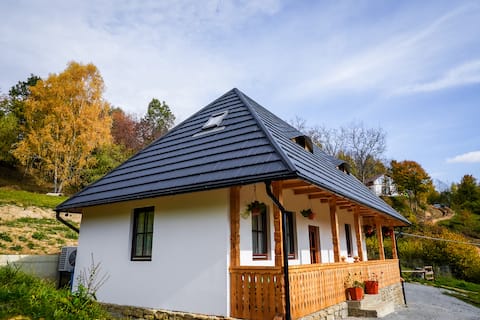
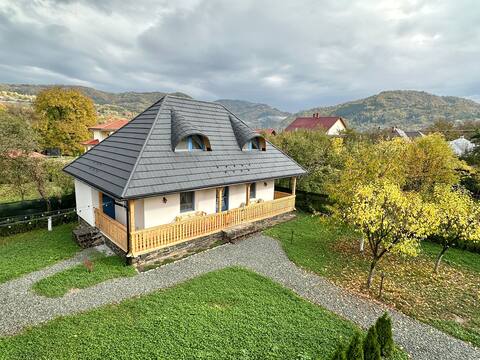
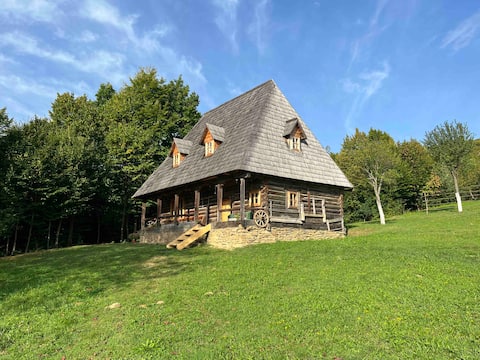
Top Performing Airbnb Properties in Vișeu de Sus (2026)
Benchmark your potential! Explore examples of top-performing Airbnb properties in Vișeu de Susbased on Trailing Twelve Month (TTM) revenue. Analyze their characteristics, revenue, occupancy rate, and ADR to understand what drives success in this market.

A Frame Cabin - Wine Valley
Entire Place • 1 bedroom
Casa Berg Pension Viseu de Sus
Entire Place • 3 bedrooms
La Bunici
Entire Place • 3 bedrooms

Mura House
Entire Place • 2 bedrooms

In Maramu’ la Mocanita! @Designess
Entire Place • 1 bedroom
Casa Valea Vinului-traditional house in Maramureș
Entire Place • 1 bedroom
Note: Performance varies based on location, size, amenities, seasonality, and management quality. Data reflects the past 12 months.
Top Performing Airbnb Hosts in Vișeu de Sus (2026)
Learn from the best! This table showcases top-performing Airbnb hosts in Vișeu de Sus based on the number of properties managed and estimated total revenue over the past year. Analyze their scale and performance metrics.
| Host Name | Properties | Grossing Revenue | Stay Reviews | Avg Rating |
|---|---|---|---|---|
| Marian | 2 | $17,138 | 11 | 4.89/5.0 |
| Adrian | 1 | $16,615 | 176 | 5.00/5.0 |
| Björn | 3 | $11,413 | 14 | 5.00/5.0 |
| Dolca | 1 | $9,289 | 6 | 5.00/5.0 |
| Alin | 1 | $8,685 | 6 | 5.00/5.0 |
| Alexandra | 1 | $8,499 | 74 | 4.85/5.0 |
| Angela | 3 | $8,227 | 12 | 5.00/5.0 |
| Radu | 1 | $8,050 | 127 | 4.92/5.0 |
| Dan | 1 | $4,716 | 3 | 5.00/5.0 |
| Serban Valentin | 1 | $4,620 | 1 | Not Rated |
Analyzing the strategies of top hosts, such as their property selection, pricing, and guest communication, can offer valuable lessons for optimizing your own Airbnb operations in Vișeu de Sus.
Dive Deeper: Advanced Vișeu de Sus STR Market Data (2026)
Ready to unlock more insights? AirROI provides access to advanced metrics and comprehensive Airbnb data for Vișeu de Sus. Explore detailed analytics beyond this report to refine your investment strategy, optimize pricing, and maximize your vacation rental profits.
Explore Advanced MetricsVișeu de Sus Short-Term Rental Market Composition (2026): Property & Room Types
Room Type Distribution
Property Type Distribution
Market Composition Insights for Vișeu de Sus
- The Vișeu de Sus Airbnb market composition is heavily skewed towards Entire Home/Apt listings, which make up 82.6% of the 23 active rentals. This indicates strong guest preference for privacy and space.
- Looking at the property type distribution in Vișeu de Sus, House properties are the most common (52.2%), reflecting the local real estate landscape.
- Houses represent a significant 52.2% portion, catering likely to families or larger groups.
- Smaller segments like hotel/boutique (combined 4.3%) offer potential for unique stay experiences.
Vișeu de Sus Airbnb Room Capacity Analysis (2026): Bedroom Distribution
Distribution of Listings by Number of Bedrooms
Room Capacity Insights for Vișeu de Sus
- The dominant room capacity in Vișeu de Sus is 3 bedrooms listings, making up 34.8% of the market. This suggests a strong demand for properties suitable for families or small groups.
- Together, 3 bedrooms and 2 bedrooms properties represent 60.9% of the active Airbnb listings in Vișeu de Sus, indicating a high concentration in these sizes.
- A significant 39.1% of listings offer 3+ bedrooms, catering to larger groups and families seeking more space in Vișeu de Sus.
Vișeu de Sus Vacation Rental Guest Capacity Trends (2026)
Distribution of Listings by Guest Capacity
Guest Capacity Insights for Vișeu de Sus
- The most common guest capacity trend in Vișeu de Sus vacation rentals is listings accommodating 2 guests (21.7%). This suggests the primary traveler segment is likely couples or solo travelers.
- Properties designed for 2 guests and 7 guests dominate the Vișeu de Sus STR market, accounting for 34.7% of listings.
- 39.0% of properties accommodate 6+ guests, serving the market segment for larger families or group travel in Vișeu de Sus.
- On average, properties in Vișeu de Sus are equipped to host 4.4 guests.
Vișeu de Sus Airbnb Booking Patterns (2026): Available vs. Booked Days
Available Days Distribution
Booked Days Distribution
Booking Pattern Insights for Vișeu de Sus
- The most common availability pattern in Vișeu de Sus falls within the 271-366 days range, representing 91.3% of listings. This suggests many properties have significant open periods on their calendars.
- Approximately 100.0% of listings show high availability (181+ days open annually), indicating potential for increased bookings or specific owner usage patterns.
- For booked days, the 31-90 days range is most frequent in Vișeu de Sus (47.8%), reflecting common guest stay durations or potential owner blocking patterns.
- A notable 4.3% of properties secure long booking periods (181+ days booked per year), highlighting successful long-term rental strategies or significant owner usage.
Vișeu de Sus Airbnb Minimum Stay Requirements Analysis
Distribution of Listings by Minimum Night Requirement
1 Night
8 listings
34.8% of total
2 Nights
10 listings
43.5% of total
3 Nights
1 listings
4.3% of total
4-6 Nights
2 listings
8.7% of total
30+ Nights
2 listings
8.7% of total
Key Insights
- The most prevalent minimum stay requirement in Vișeu de Sus is 2 Nights, adopted by 43.5% of listings. This highlights the market's preference for shorter, flexible bookings.
- A strong majority (78.3%) of the Vișeu de Sus Airbnb data shows acceptance of very short stays (1-2 nights), indicating a dynamic, high-turnover market.
Recommendations
- Align with the market by considering a 2 Nights minimum stay, as 43.5% of Vișeu de Sus hosts use this setting.
- Explore offering discounts for stays of 30+ nights to attract the 8.7% of the market seeking extended stays.
- Adjust minimum nights based on seasonality – potentially shorter during low season and longer during peak demand periods in Vișeu de Sus.
Vișeu de Sus Airbnb Cancellation Policy Trends Analysis (2026)
Flexible
11 listings
47.8% of total
Moderate
5 listings
21.7% of total
Firm
7 listings
30.4% of total
Cancellation Policy Insights for Vișeu de Sus
- The prevailing Airbnb cancellation policy trend in Vișeu de Sus is Flexible, used by 47.8% of listings.
- There's a relatively balanced mix between guest-friendly (69.5%) and stricter (30.4%) policies, offering choices for different guest needs.
Recommendations for Hosts
- Consider adopting a Flexible policy to align with the 47.8% market standard in Vișeu de Sus.
- Regularly review your cancellation policy against competitors and market demand shifts in Vișeu de Sus.
Vișeu de Sus STR Booking Lead Time Analysis (2026)
Average Booking Lead Time by Month
Booking Lead Time Insights for Vișeu de Sus
- The overall average booking lead time for vacation rentals in Vișeu de Sus is 57 days.
- Guests book furthest in advance for stays during December (average 89 days), likely coinciding with peak travel demand or local events.
- The shortest booking windows occur for stays in January (average 21 days), indicating more last-minute travel plans during this time.
- Seasonally, Fall (57 days avg.) sees the longest lead times, while Spring (41 days avg.) has the shortest, reflecting typical travel planning cycles.
Recommendations for Hosts
- Use the overall average lead time (57 days) as a baseline for your pricing and availability strategy in Vișeu de Sus.
- For December stays, consider implementing length-of-stay discounts or slightly higher rates for bookings made less than 89 days out to capitalize on advance planning.
- Target marketing efforts for the Fall season well in advance (at least 57 days) to capture early planners.
- Monitor your own booking lead times against these Vișeu de Sus averages to identify opportunities for dynamic pricing adjustments.
Popular & Essential Airbnb Amenities in Vișeu de Sus (2026)
Amenity Prevalence
Amenity Insights for Vișeu de Sus
- Essential amenities in Vișeu de Sus that guests expect include: Free parking on premises, Wifi. Lacking these (any) could significantly impact bookings.
- Popular amenities like Kitchen, TV, Heating are common but not universal. Offering these can provide a competitive edge.
Recommendations for Hosts
- Ensure your listing includes all essential amenities for Vișeu de Sus: Free parking on premises, Wifi.
- Prioritize adding missing essentials: Wifi.
- Consider adding popular differentiators like Kitchen or TV to increase appeal.
- Highlight unique or less common amenities you offer (e.g., hot tub, dedicated workspace, EV charger) in your listing description and photos.
- Regularly check competitor amenities in Vișeu de Sus to stay competitive.
Vișeu de Sus Airbnb Guest Demographics & Profile Analysis (2026)
Guest Profile Summary for Vișeu de Sus
- The typical guest profile for Airbnb in Vișeu de Sus consists of predominantly international visitors (91%), with top international origins including France, typically belonging to the Post-2000s (Gen Z/Alpha) group (50%), primarily speaking English or French.
- Domestic travelers account for 9.1% of guests.
- Key international markets include Germany (24.2%) and France (12.1%).
- Top languages spoken are English (35.4%) followed by French (16.7%).
- A significant demographic segment is the Post-2000s (Gen Z/Alpha) group, representing 50% of guests.
Recommendations for Hosts
- Focus marketing internationally, particularly towards travelers from France.
- Tailor amenities and listing descriptions to appeal to the dominant Post-2000s (Gen Z/Alpha) demographic (e.g., highlight fast WiFi, smart home features, local guides).
- Highlight unique local experiences or amenities relevant to the primary guest profile.
- Consider seasonal promotions aligned with peak travel times for key origin markets.
Nearby Short-Term Rental Market Comparison
How does the Vișeu de Sus Airbnb market stack up against its neighbors? Compare key performance metrics like average monthly revenue, ADR, and occupancy rates in surrounding areas to understand the broader regional STR landscape.
| Market | Active Properties | Monthly Revenue | Daily Rate | Avg. Occupancy |
|---|---|---|---|---|
| Călățele | 13 | $1,775 | $182.48 | 36% |
| Beliș | 17 | $1,522 | $247.77 | 25% |
| Gilău | 15 | $1,428 | $229.56 | 24% |
| Tiha Bârgăului | 10 | $1,155 | $235.51 | 22% |
| Mărișel | 13 | $1,069 | $207.16 | 25% |
| Vama | 13 | $1,000 | $148.77 | 28% |
| Șaru Dornei | 14 | $995 | $193.21 | 26% |
| Bistrița Bârg�ăului | 30 | $951 | $208.41 | 23% |
| Râșca | 10 | $892 | $204.80 | 19% |
| Zetea | 24 | $835 | $197.69 | 21% |