Al Naseem Municipality Airbnb Market Analysis 2026: Short Term Rental Data & Vacation Rental Statistics in Riyadh Region, Saudi Arabia
Is Airbnb profitable in Al Naseem Municipality in 2026? Explore comprehensive Airbnb analytics for Al Naseem Municipality, Riyadh Region, Saudi Arabia to uncover income potential. This 2026 STR market report for Al Naseem Municipality, based on AirROI data from February 2025 to January 2026, reveals key trends in the niche market of 22 active listings.
Whether you're considering an Airbnb investment in Al Naseem Municipality, optimizing your existing vacation rental, or exploring rental arbitrage opportunities, understanding the Al Naseem Municipality Airbnb data is crucial. Navigating the high regulation landscape is key to maximizing your short term rental income potential. Let's dive into the specifics.
Key Al Naseem Municipality Airbnb Performance Metrics Overview
Monthly Airbnb Revenue Variations & Income Potential in Al Naseem Municipality (2026)
Understanding the monthly revenue variations for Airbnb listings in Al Naseem Municipality is key to maximizing your short term rental income potential. Seasonality significantly impacts earnings. Our analysis, based on data from the past 12 months, shows that the peak revenue month for STRs in Al Naseem Municipality is typically December, while March often presents the lowest earnings, highlighting opportunities for strategic pricing adjustments during shoulder and low seasons. Explore the typical Airbnb income in Al Naseem Municipality across different performance tiers:
- Best-in-class properties (Top 10%) achieve $2,660+ monthly, often utilizing dynamic pricing and superior guest experiences.
- Strong performing properties (Top 25%) earn $1,788 or more, indicating effective management and desirable locations/amenities.
- Typical properties (Median) generate around $1,019 per month, representing the average market performance.
- Entry-level properties (Bottom 25%) see earnings around $558, often with potential for optimization.
Average Monthly Airbnb Earnings Trend in Al Naseem Municipality
Al Naseem Municipality Airbnb Occupancy Rate Trends (2026)
Maximize your bookings by understanding the Al Naseem Municipality STR occupancy trends. Seasonal demand shifts significantly influence how often properties are booked. Typically, Augustsees the highest demand (peak season occupancy), while March experiences the lowest (low season). Effective strategies, like adjusting minimum stays or offering promotions, can boost occupancy during slower periods. Here's how different property tiers perform in Al Naseem Municipality:
- Best-in-class properties (Top 10%) achieve 88%+ occupancy, indicating high desirability and potentially optimized availability.
- Strong performing properties (Top 25%) maintain 73% or higher occupancy, suggesting good market fit and guest satisfaction.
- Typical properties (Median) have an occupancy rate around 39%.
- Entry-level properties (Bottom 25%) average 21% occupancy, potentially facing higher vacancy.
Average Monthly Occupancy Rate Trend in Al Naseem Municipality
Average Daily Rate (ADR) Airbnb Trends in Al Naseem Municipality (2026)
Effective short term rental pricing strategy in Al Naseem Municipality involves understanding monthly ADR fluctuations. The Average Daily Rate (ADR) for Airbnb in Al Naseem Municipality typically peaks in May and dips lowest during November. Leveraging Airbnb dynamic pricing tools or strategies based on this seasonality can significantly boost revenue. Here's a look at the typical nightly rates achieved:
- Best-in-class properties (Top 10%) command rates of $165+ per night, often due to premium features or locations.
- Strong performing properties (Top 25%) achieve nightly rates of $100 or more.
- Typical properties (Median) charge around $65 per night.
- Entry-level properties (Bottom 25%) earn around $60 per night.
Average Daily Rate (ADR) Trend by Month in Al Naseem Municipality
Get Live Al Naseem Municipality Market Intelligence 👇

Explore Real-time Analytics
Airbnb Seasonality Analysis & Trends in Al Naseem Municipality (2026)
Peak Season (December, July, September)
- Revenue averages $1,797 per month
- Occupancy rates average 56.9%
- Daily rates average $89
Shoulder Season
- Revenue averages $1,369 per month
- Occupancy maintains around 48.9%
- Daily rates hold near $94
Low Season (January, March, June)
- Revenue drops to average $894 per month
- Occupancy decreases to average 34.2%
- Daily rates adjust to average $94
Seasonality Insights for Al Naseem Municipality
- The Airbnb seasonality in Al Naseem Municipality shows highly seasonal trends requiring careful strategy. While the sections above show seasonal averages, it's also insightful to look at the extremes:
- During the high season, the absolute peak month showcases Al Naseem Municipality's highest earning potential, with monthly revenues capable of climbing to $1,885, occupancy reaching a high of 60.9%, and ADRs peaking at $101.
- Conversely, the slowest single month of the year, typically falling within the low season, marks the market's lowest point. In this month, revenue might dip to $720, occupancy could drop to 26.7%, and ADRs may adjust down to $84.
- Understanding both the seasonal averages and these monthly peaks and troughs in revenue, occupancy, and ADR is crucial for maximizing your Airbnb profit potential in Al Naseem Municipality.
Seasonal Strategies for Maximizing Profit
- Peak Season: Maximize revenue through premium pricing and potentially longer minimum stays. Ensure high availability.
- Low Season: Offer competitive pricing, special promotions (e.g., extended stay discounts), and flexible cancellation policies. Target off-season travelers like remote workers or budget-conscious guests.
- Shoulder Seasons: Implement dynamic pricing that balances peak and low rates. Target weekend travelers or specific events. Offer slightly more flexible terms than peak season.
- Regularly analyze your own performance against these Al Naseem Municipality seasonality benchmarks and adjust your pricing and availability strategy accordingly.
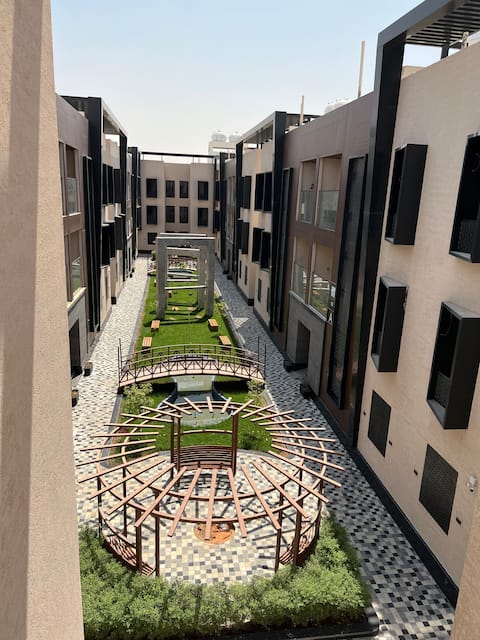
Best Areas for Airbnb Investment in Al Naseem Municipality (2026)
Exploring the top neighborhoods for short-term rentals in Al Naseem Municipality? This section highlights key areas, outlining why they are attractive for hosts and guests, along with notable local attractions. Consider these locations based on your target guest profile and investment strategy.
| Neighborhood / Area | Why Host Here? (Target Guests & Appeal) | Key Attractions & Landmarks |
|---|---|---|
| Al Naseem | A rapidly growing residential area favored by families and young professionals. Offers a blend of modern amenities, proximity to shopping centers, and easy access to major roads for commuters. | The Oasis Mall, Al Nakheel Mall, King Khalid International Airport, Local parks and recreational facilities, Restaurants and cafes |
| Al Mushaireb | A bustling area known for its cultural attractions and vibrant community life. Ideal for travelers interested in experiencing local culture and hospitality. | Museums, Cultural centers, Traditional markets, Restaurants serving local cuisine |
| Al Suwaidi | A well-developed neighborhood popular for its family-friendly environment, modern infrastructure, and accessibility to schools and hospitals. | Local parks, Shopping areas, Family entertainment centers |
| Al Malaz | A historic area with a mix of traditional and modern living, popular for its vibrant market scene and educational institutions nearby. | Malaz Horse Race Course, Al Malaz Park, Local eateries and coffee shops |
| Al Mursalat | A modern, upscale neighborhood favored by expatriates and professionals. Known for its high-end amenities and recreational facilities. | Shopping malls, Cafes, Gyms and fitness centers |
| Al Khuzama | A quiet, residential area that offers a suburban feel while remaining close to the city's main attractions. Great for longer stays and family trips. | Local parks, Shopping centers, Community centers |
| Al Jazeera | A developing area with affordable housing options and growing local amenities, making it attractive for budget-conscious travelers. | Local markets, Parks, Newly developed shopping areas |
| Al Jamiah | A centrally located area known for its blend of residential and commercial properties, with good access to public transport and nearby attractions. | Cultural sites, Educational institutions, Local dining options |
Understanding Airbnb License Requirements & STR Laws in Al Naseem Municipality (2026)
Yes, Al Naseem Municipality, Riyadh Region, Saudi Arabia enforces high STR regulations. Obtaining a license and ensuring compliance is almost certainly required according to current 2026 STR laws. Always verify the latest short term rental regulations and Airbnb license requirements directly with local government authorities for Al Naseem Municipality to ensure full compliance before hosting.
(Source: AirROI data, 2026, based on 91% licensed listings)
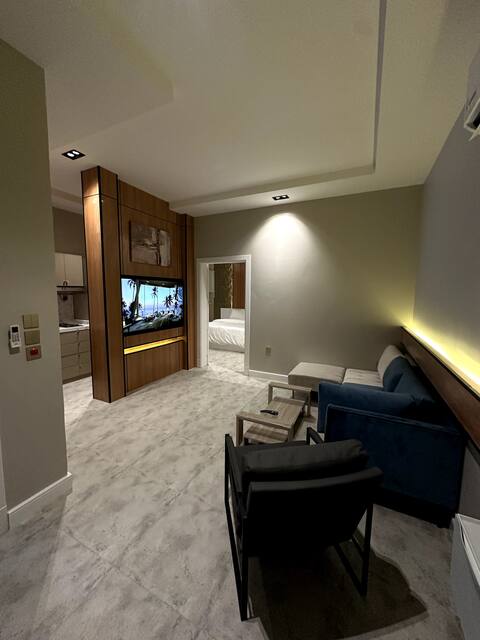
Top Performing Airbnb Properties in Al Naseem Municipality (2026)
Benchmark your potential! Explore examples of top-performing Airbnb properties in Al Naseem Municipalitybased on Trailing Twelve Month (TTM) revenue. Analyze their characteristics, revenue, occupancy rate, and ADR to understand what drives success in this market.

Luxury apartment 1 with private entrance, smart lock and two bedrooms
Entire Place • 3 bedrooms

Luxury apartment 33 with smart entry, Al-Salam neighborhood
Entire Place • 3 bedrooms

VWZ | 1BR | East Riyadh
Entire Place • 1 bedroom
Luxury hotel apartment for weekly and monthly stays (9)
Entire Place • 2 bedrooms
VWZ | 1BR | East Riyadh
Entire Place • 1 bedroom

VWZ | 1BR | East Riyadh
Entire Place • 1 bedroom
Note: Performance varies based on location, size, amenities, seasonality, and management quality. Data reflects the past 12 months.
Top Performing Airbnb Hosts in Al Naseem Municipality (2026)
Learn from the best! This table showcases top-performing Airbnb hosts in Al Naseem Municipality based on the number of properties managed and estimated total revenue over the past year. Analyze their scale and performance metrics.
| Host Name | Properties | Grossing Revenue | Stay Reviews | Avg Rating |
|---|---|---|---|---|
| Vwz Estates | 13 | $68,460 | 73 | 4.41/5.0 |
| سليمان | 2 | $53,562 | 46 | 4.97/5.0 |
| Sam | 1 | $15,188 | 4 | 5.00/5.0 |
| أبو عبدالرحمن | 1 | $5,919 | 53 | 4.85/5.0 |
| Mohammed7rb | 1 | $2,778 | 44 | 4.48/5.0 |
| Khalid | 1 | $1,709 | 1 | Not Rated |
| Awaed | 1 | $1,652 | 60 | 4.78/5.0 |
| Salem | 1 | $1,504 | 1 | Not Rated |
| Ahmed | 1 | $767 | 14 | 4.79/5.0 |
Analyzing the strategies of top hosts, such as their property selection, pricing, and guest communication, can offer valuable lessons for optimizing your own Airbnb operations in Al Naseem Municipality.
Dive Deeper: Advanced Al Naseem Municipality STR Market Data (2026)
Ready to unlock more insights? AirROI provides access to advanced metrics and comprehensive Airbnb data for Al Naseem Municipality. Explore detailed analytics beyond this report to refine your investment strategy, optimize pricing, and maximize your vacation rental profits.
Explore Advanced MetricsAl Naseem Municipality Short-Term Rental Market Composition (2026): Property & Room Types
Room Type Distribution
Property Type Distribution
Market Composition Insights for Al Naseem Municipality
- The Al Naseem Municipality Airbnb market composition is heavily skewed towards Entire Home/Apt listings, which make up 100% of the 22 active rentals. This indicates strong guest preference for privacy and space.
- Looking at the property type distribution in Al Naseem Municipality, Apartment/Condo properties are the most common (100%), reflecting the local real estate landscape.
Al Naseem Municipality Airbnb Room Capacity Analysis (2026): Bedroom Distribution
Distribution of Listings by Number of Bedrooms
Room Capacity Insights for Al Naseem Municipality
- The dominant room capacity in Al Naseem Municipality is 1 bedroom listings, making up 77.3% of the market. This suggests a strong demand for properties suitable for couples or solo travelers.
- Together, 1 bedroom and 2 bedrooms properties represent 90.9% of the active Airbnb listings in Al Naseem Municipality, indicating a high concentration in these sizes.
- With over half the market (77.3%) consisting of studios or 1-bedroom units, Al Naseem Municipality is particularly well-suited for individuals or couples.
- Listings with 3+ bedrooms (9.1%) represent a smaller niche, potentially indicating an underserved market for larger group accommodations in Al Naseem Municipality.
Al Naseem Municipality Vacation Rental Guest Capacity Trends (2026)
Distribution of Listings by Guest Capacity
Guest Capacity Insights for Al Naseem Municipality
- The most common guest capacity trend in Al Naseem Municipality vacation rentals is listings accommodating 2 guests (54.5%). This suggests the primary traveler segment is likely couples or solo travelers.
- Properties designed for 2 guests and 1 guest dominate the Al Naseem Municipality STR market, accounting for 72.7% of listings.
- A significant 72.7% of listings cater specifically to 1-2 guests, highlighting strong demand from couples and solo travelers in Al Naseem Municipality.
- On average, properties in Al Naseem Municipality are equipped to host 2.7 guests.
Al Naseem Municipality Airbnb Booking Patterns (2026): Available vs. Booked Days
Available Days Distribution
Booked Days Distribution
Booking Pattern Insights for Al Naseem Municipality
- The most common availability pattern in Al Naseem Municipality falls within the 271-366 days range, representing 72.7% of listings. This suggests many properties have significant open periods on their calendars.
- Approximately 90.9% of listings show high availability (181+ days open annually), indicating potential for increased bookings or specific owner usage patterns.
- For booked days, the 31-90 days range is most frequent in Al Naseem Municipality (50%), reflecting common guest stay durations or potential owner blocking patterns.
- A notable 9.0% of properties secure long booking periods (181+ days booked per year), highlighting successful long-term rental strategies or significant owner usage.
Al Naseem Municipality Airbnb Minimum Stay Requirements Analysis
Distribution of Listings by Minimum Night Requirement
1 Night
6 listings
27.3% of total
2 Nights
6 listings
27.3% of total
4-6 Nights
1 listings
4.5% of total
7-29 Nights
7 listings
31.8% of total
30+ Nights
2 listings
9.1% of total
Key Insights
- The most prevalent minimum stay requirement in Al Naseem Municipality is 7-29 Nights, adopted by 31.8% of listings. This highlights the market's preference for shorter, flexible bookings.
Recommendations
- Align with the market by considering a 7-29 Nights minimum stay, as 31.8% of Al Naseem Municipality hosts use this setting.
- If feasible, allowing 1-night stays, especially midweek or during low season, could capture last-minute bookings, as only 27.3% currently do.
- Explore offering discounts for stays of 30+ nights to attract the 9.1% of the market seeking extended stays.
- Adjust minimum nights based on seasonality – potentially shorter during low season and longer during peak demand periods in Al Naseem Municipality.
Al Naseem Municipality Airbnb Cancellation Policy Trends Analysis (2026)
Flexible
21 listings
100% of total
Cancellation Policy Insights for Al Naseem Municipality
- The prevailing Airbnb cancellation policy trend in Al Naseem Municipality is Flexible, used by 100% of listings.
- The market strongly favors guest-friendly terms, with 100.0% of listings offering Flexible or Moderate policies. This suggests guests in Al Naseem Municipality may expect booking flexibility.
Recommendations for Hosts
- Consider adopting a Flexible policy to align with the 100% market standard in Al Naseem Municipality.
- Given the high prevalence of Flexible policies (100%), offering this can enhance booking appeal, especially during shoulder seasons.
- Regularly review your cancellation policy against competitors and market demand shifts in Al Naseem Municipality.
Al Naseem Municipality STR Booking Lead Time Analysis (2026)
Average Booking Lead Time by Month
Booking Lead Time Insights for Al Naseem Municipality
- The overall average booking lead time for vacation rentals in Al Naseem Municipality is 23 days.
- Guests book furthest in advance for stays during April (average 38 days), likely coinciding with peak travel demand or local events.
- The shortest booking windows occur for stays in March (average 2 days), indicating more last-minute travel plans during this time.
- Seasonally, Summer (23 days avg.) sees the longest lead times, while Winter (12 days avg.) has the shortest, reflecting typical travel planning cycles.
Recommendations for Hosts
- Use the overall average lead time (23 days) as a baseline for your pricing and availability strategy in Al Naseem Municipality.
- For April stays, consider implementing length-of-stay discounts or slightly higher rates for bookings made less than 38 days out to capitalize on advance planning.
- During March, focus on last-minute booking availability and promotions, as guests book with very short notice (2 days avg.).
- Target marketing efforts for the Summer season well in advance (at least 23 days) to capture early planners.
- Monitor your own booking lead times against these Al Naseem Municipality averages to identify opportunities for dynamic pricing adjustments.
Popular & Essential Airbnb Amenities in Al Naseem Municipality (2026)
Amenity Prevalence
Amenity Insights for Al Naseem Municipality
- Essential amenities in Al Naseem Municipality that guests expect include: TV, Kitchen, Air conditioning, Free parking on premises. Lacking these (any) could significantly impact bookings.
- Popular amenities like Wifi, Washer, Pets allowed are common but not universal. Offering these can provide a competitive edge.
- Warning: Wifi is not universally provided but is considered essential globally. Ensure reliable Wifi is offered.
Recommendations for Hosts
- Ensure your listing includes all essential amenities for Al Naseem Municipality: TV, Kitchen, Air conditioning, Free parking on premises.
- Prioritize adding missing essentials: Air conditioning, Free parking on premises.
- Consider adding popular differentiators like Wifi or Washer to increase appeal.
- Highlight unique or less common amenities you offer (e.g., hot tub, dedicated workspace, EV charger) in your listing description and photos.
- Regularly check competitor amenities in Al Naseem Municipality to stay competitive.
Al Naseem Municipality Airbnb Guest Demographics & Profile Analysis (2026)
Guest Profile Summary for Al Naseem Municipality
- The typical guest profile for Airbnb in Al Naseem Municipality consists of a mix of domestic (50%) and international guests, with top international origins including United Kingdom, typically belonging to the 1990s (Older Gen Z) group (50%), primarily speaking Arabic or English.
- Domestic travelers account for 50.0% of guests.
- Key international markets include Saudi Arabia (50%) and United Kingdom (10%).
- Top languages spoken are Arabic (40%) followed by English (35%).
- A significant demographic segment is the Post-2000s (Gen Z/Alpha) group, representing 50% of guests.
Recommendations for Hosts
- Balance marketing efforts between domestic and international channels based on the guest mix.
- Tailor amenities and listing descriptions to appeal to the dominant 1990s (Older Gen Z) demographic (e.g., highlight fast WiFi, smart home features, local guides).
- Highlight unique local experiences or amenities relevant to the primary guest profile.
- Consider seasonal promotions aligned with peak travel times for key origin markets.
Nearby Short-Term Rental Market Comparison
How does the Al Naseem Municipality Airbnb market stack up against its neighbors? Compare key performance metrics like average monthly revenue, ADR, and occupancy rates in surrounding areas to understand the broader regional STR landscape.
| Market | Active Properties | Monthly Revenue | Daily Rate | Avg. Occupancy |
|---|---|---|---|---|
| Shmeisi Municipality | 11 | $718 | $181.29 | 34% |
| Al Maathar Municipality | 202 | $713 | $130.23 | 31% |
| Municipality of Al Shamal | 2,707 | $687 | $134.68 | 28% |
| Municipality of Olaya | 420 | $638 | $118.26 | 29% |
| الرياض | 58 | $634 | $141.11 | 27% |
| Ad Dir`iyah | 100 | $594 | $121.96 | 29% |
| As Sali Municipality | 19 | $570 | $97.26 | 31% |
| Riyadh | 3,466 | $552 | $114.00 | 29% |
| Municipalty of Irqah | 109 | $514 | $124.62 | 26% |
| Namar Municipality | 33 | $504 | $105.55 | 27% |