Jojong Airbnb Market Analysis 2026: Short Term Rental Data & Vacation Rental Statistics in Gapyeong-gun, South Korea
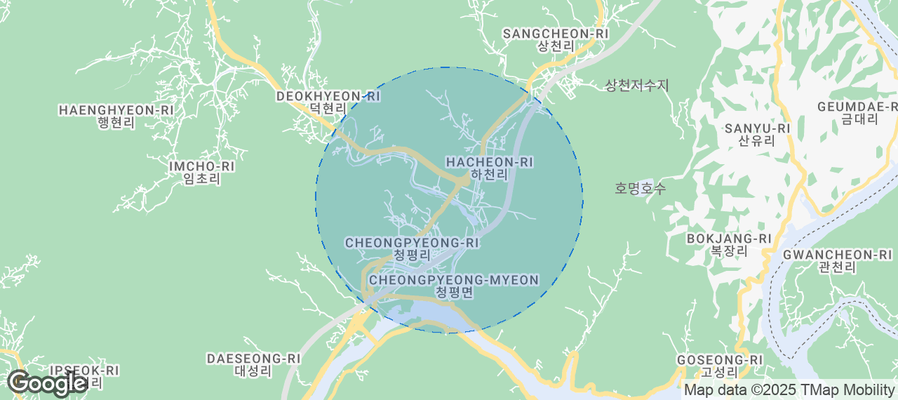
Is Airbnb profitable in Jojong in 2026? Explore comprehensive Airbnb analytics for Jojong, Gapyeong-gun, South Korea to uncover income potential. This 2026 STR market report for Jojong, based on AirROI data from July 2024 to June 2025, reveals key trends in the niche market of 18 active listings.
Whether you're considering an Airbnb investment in Jojong, optimizing your existing vacation rental, or exploring rental arbitrage opportunities, understanding the Jojong Airbnb data is crucial. Leveraging the low regulation environment is key to maximizing your short term rental income potential. Let's dive into the specifics.
Key Jojong Airbnb Performance Metrics Overview
Monthly Airbnb Revenue Variations & Income Potential in Jojong (2026)
Understanding the monthly revenue variations for Airbnb listings in Jojong is key to maximizing your short term rental income potential. Seasonality significantly impacts earnings. Our analysis, based on data from the past 12 months, shows that the peak revenue month for STRs in Jojong is typically December, while March often presents the lowest earnings, highlighting opportunities for strategic pricing adjustments during shoulder and low seasons. Explore the typical Airbnb income in Jojong across different performance tiers:
- Best-in-class properties (Top 10%) achieve $3,663+ monthly, often utilizing dynamic pricing and superior guest experiences.
- Strong performing properties (Top 25%) earn $2,181 or more, indicating effective management and desirable locations/amenities.
- Typical properties (Median) generate around $1,234 per month, representing the average market performance.
- Entry-level properties (Bottom 25%) see earnings around $548, often with potential for optimization.
Average Monthly Airbnb Earnings Trend in Jojong
Jojong Airbnb Occupancy Rate Trends (2026)
Maximize your bookings by understanding the Jojong STR occupancy trends. Seasonal demand shifts significantly influence how often properties are booked. Typically, Decembersees the highest demand (peak season occupancy), while March experiences the lowest (low season). Effective strategies, like adjusting minimum stays or offering promotions, can boost occupancy during slower periods. Here's how different property tiers perform in Jojong:
- Best-in-class properties (Top 10%) achieve 43%+ occupancy, indicating high desirability and potentially optimized availability.
- Strong performing properties (Top 25%) maintain 28% or higher occupancy, suggesting good market fit and guest satisfaction.
- Typical properties (Median) have an occupancy rate around 19%.
- Entry-level properties (Bottom 25%) average 9% occupancy, potentially facing higher vacancy.
Average Monthly Occupancy Rate Trend in Jojong
Average Daily Rate (ADR) Airbnb Trends in Jojong (2026)
Effective short term rental pricing strategy in Jojong involves understanding monthly ADR fluctuations. The Average Daily Rate (ADR) for Airbnb in Jojong typically peaks in June and dips lowest during November. Leveraging Airbnb dynamic pricing tools or strategies based on this seasonality can significantly boost revenue. Here's a look at the typical nightly rates achieved:
- Best-in-class properties (Top 10%) command rates of $348+ per night, often due to premium features or locations.
- Strong performing properties (Top 25%) achieve nightly rates of $222 or more.
- Typical properties (Median) charge around $153 per night.
- Entry-level properties (Bottom 25%) earn around $100 per night.
Average Daily Rate (ADR) Trend by Month in Jojong
Get Live Jojong Market Intelligence 👇
Explore Real-time Analytics
Airbnb Seasonality Analysis & Trends in Jojong (2025)
Peak Season (December, August, May)
- Revenue averages $2,267 per month
- Occupancy rates average 26.5%
- Daily rates average $191
Shoulder Season
- Revenue averages $1,628 per month
- Occupancy maintains around 22.5%
- Daily rates hold near $188
Low Season (March, April, October)
- Revenue drops to average $1,035 per month
- Occupancy decreases to average 15.9%
- Daily rates adjust to average $208
Seasonality Insights for Jojong
- The Airbnb seasonality in Jojong shows highly seasonal trends requiring careful strategy. While the sections above show seasonal averages, it's also insightful to look at the extremes:
- During the high season, the absolute peak month showcases Jojong's highest earning potential, with monthly revenues capable of climbing to $2,789, occupancy reaching a high of 28.4%, and ADRs peaking at $247.
- Conversely, the slowest single month of the year, typically falling within the low season, marks the market's lowest point. In this month, revenue might dip to $955, occupancy could drop to 14.9%, and ADRs may adjust down to $155.
- Understanding both the seasonal averages and these monthly peaks and troughs in revenue, occupancy, and ADR is crucial for maximizing your Airbnb profit potential in Jojong.
Seasonal Strategies for Maximizing Profit
- Peak Season: Maximize revenue through premium pricing and potentially longer minimum stays. Ensure high availability.
- Low Season: Offer competitive pricing, special promotions (e.g., extended stay discounts), and flexible cancellation policies. Target off-season travelers like remote workers or budget-conscious guests.
- Shoulder Seasons: Implement dynamic pricing that balances peak and low rates. Target weekend travelers or specific events. Offer slightly more flexible terms than peak season.
- Regularly analyze your own performance against these Jojong seasonality benchmarks and adjust your pricing and availability strategy accordingly.
Best Areas for Airbnb Investment in Jojong (2026)
Exploring the top neighborhoods for short-term rentals in Jojong? This section highlights key areas, outlining why they are attractive for hosts and guests, along with notable local attractions. Consider these locations based on your target guest profile and investment strategy.
| Neighborhood / Area | Why Host Here? (Target Guests & Appeal) | Key Attractions & Landmarks |
|---|---|---|
| Cheongpyeong Lake | A serene destination for nature lovers and water sports enthusiasts, Cheongpyeong Lake offers beautiful views and activities such as kayaking and fishing. | Cheongpyeong Lake, Nami Island, Petite France, Jade Garden, Mount Seorak |
| Nami Island | Famous for its beautiful tree-lined roads and cultural festivals, Nami Island is a popular destination for tourists looking for a picturesque getaway. | Metasequoia Lane, Garden of Morning Calm, Nami Island Zip Wire, Nami Island Ferry, Cultural performances |
| Gapyeong Rail Park | A unique attraction where visitors can pedal rail bikes along scenic routes, making it a fun experience for families and friends. | Gapyeong Rail Park, Homyeong Lake, Paragliding spots, Yangsuri Herb Island |
| Sanghyun Park | A beautiful park with walking trails and leisure activities, perfect for those who want to enjoy nature and relaxation. | Sanghyun Park, Bicycle rentals, Picnic spots, Scenic views of the mountains |
| Gyerong Mountain | Known for its hiking trails and breathtaking views, Gyerong Mountain is popular among hikers and nature enthusiasts looking for adventurous experiences. | Gyerong Mountain trails, Camping sites, Viewpoints, Local flora and fauna |
| Vivaldi Park Ski World | A popular ski resort attracting winter sports enthusiasts, making it an ideal spot for hosting winter vacation rentals. | Ski slopes, Snowboarding, Winter festivals, Ski schools, Lodges |
| Pencil Museum | An interesting museum that showcases the history of pencils, catering to families and curious tourists alike, providing a unique experience. | Pencil Museum exhibits, Workshops, Souvenir shops, Cafes nearby |
| Yangsuri Herb Island | A lovely place focusing on herbal tours and educational experiences, attracting guests who are interested in wellness and nature. | Herb workshops, Themed gardens, Educational tours, Cafés serving herbal products |
Understanding Airbnb License Requirements & STR Laws in Jojong (2026)
While Jojong, Gapyeong-gun, South Korea currently shows low STR regulations, specific Airbnb license requirements might still exist or change. Always verify the latest short term rental regulations and Airbnb license requirements directly with local government authorities for Jojong to ensure full compliance before hosting.
(Source: AirROI data, 2026, finding no licensed listings among those analyzed)
Top Performing Airbnb Properties in Jojong (2026)
Benchmark your potential! Explore examples of top-performing Airbnb properties in Jojongbased on Trailing Twelve Month (TTM) revenue. Analyze their characteristics, revenue, occupancy rate, and ADR to understand what drives success in this market.
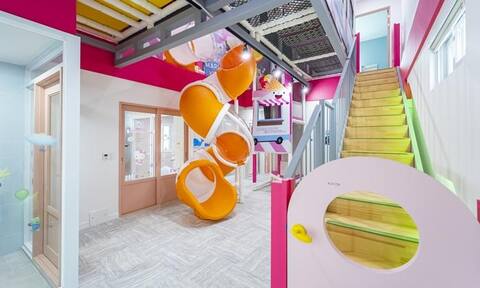
Private room without floor noise, private house, individual kids pool villa No. 4 (two-room type, tw
Entire Place • 2 bedrooms

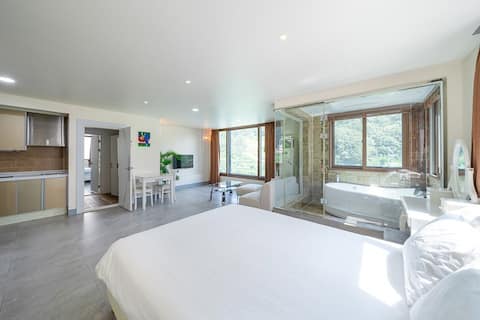
'Seorynshi', a stopped space and time in busy daily life
Entire Place • 2 bedrooms

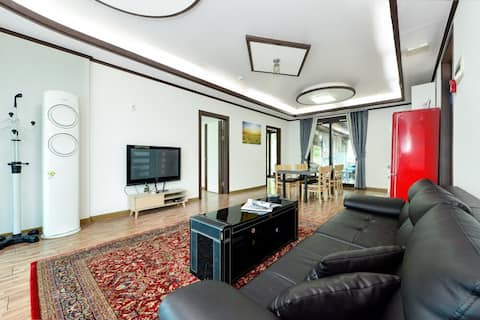
Villa-type private house Room A, a modern space with a touch of emotion
Entire Place • 5 bedrooms

European-style home built with Unaksan as a bottle
Entire Place • 2 bedrooms
A group of accommodations where you can relax and heal in nature (all rooms in Building B)
Entire Place • 6 bedrooms
A place where you can relax with the green nature of Gapyeong
Entire Place • 1 bedroom
Note: Performance varies based on location, size, amenities, seasonality, and management quality. Data reflects the past 12 months.
Top Performing Airbnb Hosts in Jojong (2026)
Learn from the best! This table showcases top-performing Airbnb hosts in Jojong based on the number of properties managed and estimated total revenue over the past year. Analyze their scale and performance metrics.
| Host Name | Properties | Grossing Revenue | Stay Reviews | Avg Rating |
|---|---|---|---|---|
| 순옥 | 2 | $59,033 | 516 | 4.79/5.0 |
| Onda | 2 | $44,532 | 15 | 4.65/5.0 |
| Ddnayo | 1 | $42,256 | 2 | Not Rated |
| 캐빈 | 7 | $33,221 | 30 | 4.91/5.0 |
| Onda | 2 | $30,998 | 2 | Not Rated |
| Host #458151519 | 2 | $25,731 | 1 | Not Rated |
| Onda | 1 | $24,173 | 4 | 5.00/5.0 |
| Onda | 1 | $22,080 | 6 | 4.50/5.0 |
Analyzing the strategies of top hosts, such as their property selection, pricing, and guest communication, can offer valuable lessons for optimizing your own Airbnb operations in Jojong.
Dive Deeper: Advanced Jojong STR Market Data (2026)
Ready to unlock more insights? AirROI provides access to advanced metrics and comprehensive Airbnb data for Jojong. Explore detailed analytics beyond this report to refine your investment strategy, optimize pricing, and maximize your vacation rental profits.
Explore Advanced MetricsJojong Short-Term Rental Market Composition (2026): Property & Room Types
Room Type Distribution
Property Type Distribution
Market Composition Insights for Jojong
- The Jojong Airbnb market composition is heavily skewed towards Entire Home/Apt listings, which make up 100% of the 18 active rentals. This indicates strong guest preference for privacy and space.
- Looking at the property type distribution in Jojong, Hotel/Boutique properties are the most common (55.6%), reflecting the local real estate landscape.
- Houses represent a significant 44.4% portion, catering likely to families or larger groups.
- The presence of 55.6% Hotel/Boutique listings indicates integration with traditional hospitality.
Jojong Airbnb Room Capacity Analysis (2026): Bedroom Distribution
Distribution of Listings by Number of Bedrooms
Room Capacity Insights for Jojong
- The dominant room capacity in Jojong is 2 bedrooms listings, making up 38.9% of the market. This suggests a strong demand for properties suitable for couples or solo travelers.
- Together, 2 bedrooms and 1 bedroom properties represent 66.7% of the active Airbnb listings in Jojong, indicating a high concentration in these sizes.
Jojong Vacation Rental Guest Capacity Trends (2026)
Distribution of Listings by Guest Capacity
Guest Capacity Insights for Jojong
- The most common guest capacity trend in Jojong vacation rentals is listings accommodating 8+ guests (50%). This suggests the primary traveler segment is likely larger groups.
- Properties designed for 8+ guests and 4 guests dominate the Jojong STR market, accounting for 66.7% of listings.
- 66.7% of properties accommodate 6+ guests, serving the market segment for larger families or group travel in Jojong.
- On average, properties in Jojong are equipped to host 6.0 guests.
Jojong Airbnb Booking Patterns (2026): Available vs. Booked Days
Available Days Distribution
Booked Days Distribution
Booking Pattern Insights for Jojong
- The most common availability pattern in Jojong falls within the 271-366 days range, representing 72.2% of listings. This suggests many properties have significant open periods on their calendars.
- Approximately 100.0% of listings show high availability (181+ days open annually), indicating potential for increased bookings or specific owner usage patterns.
- For booked days, the 1-30 days range is most frequent in Jojong (38.9%), reflecting common guest stay durations or potential owner blocking patterns.
Jojong Airbnb Minimum Stay Requirements Analysis
Distribution of Listings by Minimum Night Requirement
1 Night
17 listings
100% of total
Key Insights
- The most prevalent minimum stay requirement in Jojong is 1 Night, adopted by 100% of listings. This highlights the market's preference for shorter, flexible bookings.
- A strong majority (100.0%) of the Jojong Airbnb data shows acceptance of very short stays (1-2 nights), indicating a dynamic, high-turnover market.
Recommendations
- Align with the market by considering a 1 Night minimum stay, as 100% of Jojong hosts use this setting.
- Adjust minimum nights based on seasonality – potentially shorter during low season and longer during peak demand periods in Jojong.
Jojong Airbnb Cancellation Policy Trends Analysis (2026)
Flexible
2 listings
12.5% of total
Moderate
9 listings
56.3% of total
Firm
5 listings
31.3% of total
Cancellation Policy Insights for Jojong
- The prevailing Airbnb cancellation policy trend in Jojong is Moderate, used by 56.3% of listings.
- There's a relatively balanced mix between guest-friendly (68.8%) and stricter (31.3%) policies, offering choices for different guest needs.
Recommendations for Hosts
- Consider adopting a Moderate policy to align with the 56.3% market standard in Jojong.
- Regularly review your cancellation policy against competitors and market demand shifts in Jojong.
Jojong STR Booking Lead Time Analysis (2026)
Average Booking Lead Time by Month
Booking Lead Time Insights for Jojong
- The overall average booking lead time for vacation rentals in Jojong is 20 days.
- Guests book furthest in advance for stays during October (average 43 days), likely coinciding with peak travel demand or local events.
- The shortest booking windows occur for stays in July (average 11 days), indicating more last-minute travel plans during this time.
- Seasonally, Fall (32 days avg.) sees the longest lead times, while Summer (18 days avg.) has the shortest, reflecting typical travel planning cycles.
Recommendations for Hosts
- Use the overall average lead time (20 days) as a baseline for your pricing and availability strategy in Jojong.
- For October stays, consider implementing length-of-stay discounts or slightly higher rates for bookings made less than 43 days out to capitalize on advance planning.
- During July, focus on last-minute booking availability and promotions, as guests book with very short notice (11 days avg.).
- Target marketing efforts for the Fall season well in advance (at least 32 days) to capture early planners.
- Monitor your own booking lead times against these Jojong averages to identify opportunities for dynamic pricing adjustments.
Popular & Essential Airbnb Amenities in Jojong (2026)
Amenity data is currently unavailable for Jojong.
Jojong Airbnb Guest Demographics & Profile Analysis (2026)
Guest Profile Summary for Jojong
- The typical guest profile for Airbnb in Jojong consists of primarily domestic travelers (88%), often arriving from nearby Seoul, typically belonging to the Post-2000s (Gen Z/Alpha) group (50%), primarily speaking Korean or English.
- Domestic travelers account for 88.4% of guests.
- Key international markets include South Korea (88.4%) and Singapore (4.7%).
- Top languages spoken are Korean (50%) followed by English (36.4%).
- A significant demographic segment is the Post-2000s (Gen Z/Alpha) group, representing 50% of guests.
Recommendations for Hosts
- Target domestic marketing efforts towards travelers from Seoul and Daegu.
- Tailor amenities and listing descriptions to appeal to the dominant Post-2000s (Gen Z/Alpha) demographic (e.g., highlight fast WiFi, smart home features, local guides).
- Highlight unique local experiences or amenities relevant to the primary guest profile.
- Consider seasonal promotions aligned with peak travel times for key origin markets.
Nearby Short-Term Rental Market Comparison
How does the Jojong Airbnb market stack up against its neighbors? Compare key performance metrics like average monthly revenue, ADR, and occupancy rates in surrounding areas to understand the broader regional STR landscape.
| Market | Active Properties | Monthly Revenue | Daily Rate | Avg. Occupancy |
|---|---|---|---|---|
| Wondeok-ri | 12 | $2,571 | $209.45 | 39% |
| Seorak-myeon | 10 | $2,132 | $190.71 | 35% |
| Dojang-ri | 12 | $1,890 | $197.03 | 30% |
| Seorak | 11 | $1,671 | $201.29 | 29% |
| Bokjang-ri | 14 | $1,656 | $231.84 | 23% |
| Gapcheon-myeon | 12 | $1,467 | $138.74 | 37% |
| Yeoju-si | 36 | $1,429 | $205.87 | 28% |
| Gwangju-si | 59 | $1,335 | $164.54 | 32% |
| Seojong | 16 | $1,333 | $180.17 | 24% |
| Sang | 18 | $1,310 | $227.34 | 27% |