Nonsan-si Airbnb Market Analysis 2026: Short Term Rental Data & Vacation Rental Statistics in South Chungcheong, South Korea
Is Airbnb profitable in Nonsan-si in 2026? Explore comprehensive Airbnb analytics for Nonsan-si, South Chungcheong, South Korea to uncover income potential. This 2026 STR market report for Nonsan-si, based on AirROI data from February 2025 to January 2026, reveals key trends in the niche market of 23 active listings.
Whether you're considering an Airbnb investment in Nonsan-si, optimizing your existing vacation rental, or exploring rental arbitrage opportunities, understanding the Nonsan-si Airbnb data is crucial. Navigating the high regulation landscape is key to maximizing your short term rental income potential. Let's dive into the specifics.
Key Nonsan-si Airbnb Performance Metrics Overview
Monthly Airbnb Revenue Variations & Income Potential in Nonsan-si (2026)
Understanding the monthly revenue variations for Airbnb listings in Nonsan-si is key to maximizing your short term rental income potential. Seasonality significantly impacts earnings. Our analysis, based on data from the past 12 months, shows that the peak revenue month for STRs in Nonsan-si is typically August, while January often presents the lowest earnings, highlighting opportunities for strategic pricing adjustments during shoulder and low seasons. Explore the typical Airbnb income in Nonsan-si across different performance tiers:
- Best-in-class properties (Top 10%) achieve $2,684+ monthly, often utilizing dynamic pricing and superior guest experiences.
- Strong performing properties (Top 25%) earn $2,073 or more, indicating effective management and desirable locations/amenities.
- Typical properties (Median) generate around $1,215 per month, representing the average market performance.
- Entry-level properties (Bottom 25%) see earnings around $529, often with potential for optimization.
Average Monthly Airbnb Earnings Trend in Nonsan-si
Nonsan-si Airbnb Occupancy Rate Trends (2026)
Maximize your bookings by understanding the Nonsan-si STR occupancy trends. Seasonal demand shifts significantly influence how often properties are booked. Typically, Augustsees the highest demand (peak season occupancy), while January experiences the lowest (low season). Effective strategies, like adjusting minimum stays or offering promotions, can boost occupancy during slower periods. Here's how different property tiers perform in Nonsan-si:
- Best-in-class properties (Top 10%) achieve 58%+ occupancy, indicating high desirability and potentially optimized availability.
- Strong performing properties (Top 25%) maintain 46% or higher occupancy, suggesting good market fit and guest satisfaction.
- Typical properties (Median) have an occupancy rate around 30%.
- Entry-level properties (Bottom 25%) average 15% occupancy, potentially facing higher vacancy.
Average Monthly Occupancy Rate Trend in Nonsan-si
Average Daily Rate (ADR) Airbnb Trends in Nonsan-si (2026)
Effective short term rental pricing strategy in Nonsan-si involves understanding monthly ADR fluctuations. The Average Daily Rate (ADR) for Airbnb in Nonsan-si typically peaks in August and dips lowest during April. Leveraging Airbnb dynamic pricing tools or strategies based on this seasonality can significantly boost revenue. Here's a look at the typical nightly rates achieved:
- Best-in-class properties (Top 10%) command rates of $223+ per night, often due to premium features or locations.
- Strong performing properties (Top 25%) achieve nightly rates of $184 or more.
- Typical properties (Median) charge around $129 per night.
- Entry-level properties (Bottom 25%) earn around $93 per night.
Average Daily Rate (ADR) Trend by Month in Nonsan-si
Get Live Nonsan-si Market Intelligence 👇

Explore Real-time Analytics
Airbnb Seasonality Analysis & Trends in Nonsan-si (2026)
Peak Season (August, February, October)
- Revenue averages $1,634 per month
- Occupancy rates average 35.5%
- Daily rates average $143
Shoulder Season
- Revenue averages $1,355 per month
- Occupancy maintains around 33.3%
- Daily rates hold near $137
Low Season (January, June, December)
- Revenue drops to average $1,090 per month
- Occupancy decreases to average 24.0%
- Daily rates adjust to average $141
Seasonality Insights for Nonsan-si
- The Airbnb seasonality in Nonsan-si shows moderate seasonality with distinct peak and low periods. While the sections above show seasonal averages, it's also insightful to look at the extremes:
- During the high season, the absolute peak month showcases Nonsan-si's highest earning potential, with monthly revenues capable of climbing to $1,777, occupancy reaching a high of 38.9%, and ADRs peaking at $146.
- Conversely, the slowest single month of the year, typically falling within the low season, marks the market's lowest point. In this month, revenue might dip to $948, occupancy could drop to 19.6%, and ADRs may adjust down to $133.
- Understanding both the seasonal averages and these monthly peaks and troughs in revenue, occupancy, and ADR is crucial for maximizing your Airbnb profit potential in Nonsan-si.
Seasonal Strategies for Maximizing Profit
- Peak Season: Maximize revenue through premium pricing and potentially longer minimum stays. Ensure high availability.
- Low Season: Offer competitive pricing, special promotions (e.g., extended stay discounts), and flexible cancellation policies. Target off-season travelers like remote workers or budget-conscious guests.
- Shoulder Seasons: Implement dynamic pricing that balances peak and low rates. Target weekend travelers or specific events. Offer slightly more flexible terms than peak season.
- Regularly analyze your own performance against these Nonsan-si seasonality benchmarks and adjust your pricing and availability strategy accordingly.
Best Areas for Airbnb Investment in Nonsan-si (2026)
Exploring the top neighborhoods for short-term rentals in Nonsan-si? This section highlights key areas, outlining why they are attractive for hosts and guests, along with notable local attractions. Consider these locations based on your target guest profile and investment strategy.
| Neighborhood / Area | Why Host Here? (Target Guests & Appeal) | Key Attractions & Landmarks |
|---|---|---|
| Nonsan City Center | The bustling heart of Nonsan, filled with shops, eateries, and cultural sites. It's great for tourists wanting to experience local life and accessibility to other attractions. | Nonsan Confucian School, Nonsan National Museum, Nonsan Market, Nonsan Art Center |
| Myeongdong District | Known for its shopping and vibrant street food scene, Myeongdong attracts visitors who want to experience the local cuisine and shopping culture. | Myeongdong Shopping Street, Nonsan Street Food Alley, Nonsan Cultural Center |
| Gyeryongsan National Park | A popular destination for nature lovers and hikers. Offers beautiful scenery and is perfect for outdoor enthusiasts looking for a peaceful retreat. | Scenic hiking trails, Daeungjeon Hall, Temple stays, Various lookout points |
| Sudeoksa Temple | A historic Buddhist temple that draws visitors interested in culture and spirituality. It's a serene place to visit and learn about Buddhist practices. | Main Hall, Beautiful temple architecture, Surrounding nature trails, Cultural exhibitions |
| Nonsan Hanok Village | An area showcasing traditional Korean houses, giving visitors a glimpse into Korea's past. It's ideal for tourists interested in heritage and culture. | Traditional hanoks, Cultural performances, Workshops on traditional crafts |
| Asan Spa | Famous for its hot springs and wellness facilities, Asan Spa is a great attraction for visitors seeking relaxation and health benefits. | Hot springs, Spa resorts, Health-focused cafés and restaurants |
| Yeyul Park | A large park in Nonsan that offers leisure activities and a beautiful environment for families and picnic-goers. It's a great place to unwind and enjoy nature. | Walking and biking trails, Play areas for kids, Picnic areas |
| Nonsan Cherry Blossom Festival Sites | Famous for its stunning cherry blossoms in spring, it attracts numerous visitors for hanami and photography. A picturesque location for seasonal tourism. | Cherry Blossom trees, Flower viewing paths, Cultural events during the festival |
Understanding Airbnb License Requirements & STR Laws in Nonsan-si (2026)
Yes, Nonsan-si, South Chungcheong, South Korea enforces high STR regulations. Obtaining a license and ensuring compliance is almost certainly required according to current 2026 STR laws. Always verify the latest short term rental regulations and Airbnb license requirements directly with local government authorities for Nonsan-si to ensure full compliance before hosting.
(Source: AirROI data, 2026, based on 74% licensed listings)
Top Performing Airbnb Properties in Nonsan-si (2026)
Benchmark your potential! Explore examples of top-performing Airbnb properties in Nonsan-sibased on Trailing Twelve Month (TTM) revenue. Analyze their characteristics, revenue, occupancy rate, and ADR to understand what drives success in this market.

250-pyeong private pension "Nonsan Byeulgok" with a barbecue in front of the training center
Entire Place • 3 bedrooms
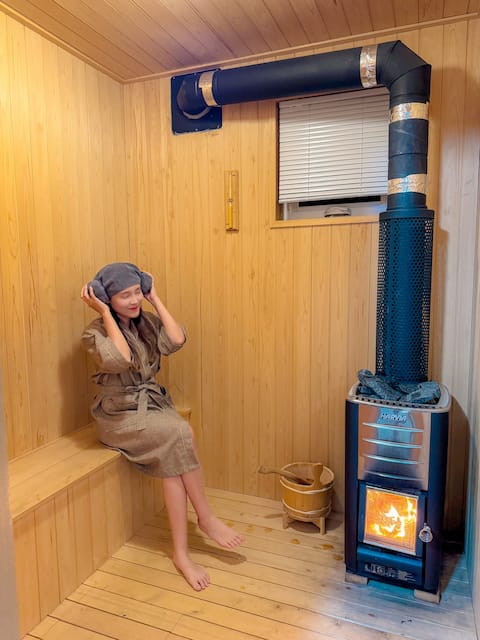
660m2 of land, river view, Finnish sauna, private house 'Stay Yangchon' / Accommodation self-modeled
Entire Place • 2 bedrooms
Odo Island
Entire Place • 2 bedrooms

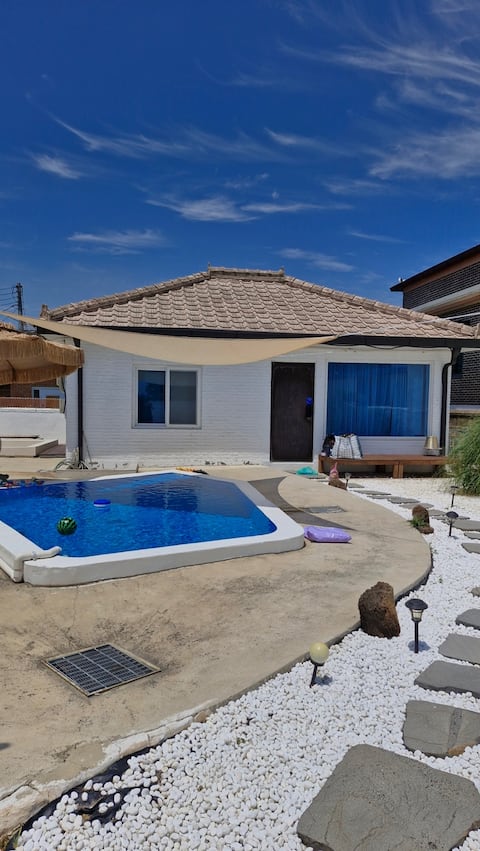
To the world of the city center, wind, sunshine, and barbecue party, rice fields, mountains, stars,
Entire Place • 2 bedrooms
![[Namane Nonsan] Beautiful Hanok Village, One day team, Spacious yard, Luxury barbecue & fire pit](https://a0.muscache.com/im/pictures/5c26929c-86dd-4505-92c0-18720d5cf116.jpg?im_w=480&im_format=avif)
[Namane Nonsan] Beautiful Hanok Village, One day team, Spacious yard, Luxury barbecue & fire pit
Entire Place • 3 bedrooms
![Won's farm stay [Won's Farm Stay] Nonsan, Buyue, Gongju, Jeonju Trip/Nonsan Training Center Visit/En](https://a0.muscache.com/im/pictures/f590bfed-beb3-41e8-a472-b793452aa8bc.jpg?im_w=480&im_format=avif)
Won's farm stay [Won's Farm Stay] Nonsan, Buyue, Gongju, Jeonju Trip/Nonsan Training Center Visit/En
Entire Place • 2 bedrooms
Note: Performance varies based on location, size, amenities, seasonality, and management quality. Data reflects the past 12 months.
Top Performing Airbnb Hosts in Nonsan-si (2026)
Learn from the best! This table showcases top-performing Airbnb hosts in Nonsan-si based on the number of properties managed and estimated total revenue over the past year. Analyze their scale and performance metrics.
| Host Name | Properties | Grossing Revenue | Stay Reviews | Avg Rating |
|---|---|---|---|---|
| 혜숙 | 2 | $58,879 | 37 | 5.00/5.0 |
| JongHyun | 2 | $37,768 | 370 | 4.89/5.0 |
| Dlover | 1 | $32,704 | 26 | 5.00/5.0 |
| 슬기 | 1 | $26,299 | 48 | 4.96/5.0 |
| Kang | 1 | $22,323 | 17 | 4.94/5.0 |
| Journey | 1 | $16,983 | 29 | 4.79/5.0 |
| Paul | 1 | $15,683 | 201 | 4.98/5.0 |
| Hyun | 2 | $14,327 | 217 | 4.72/5.0 |
| Clover | 1 | $13,292 | 95 | 4.96/5.0 |
| 태훈 | 1 | $11,417 | 14 | 4.93/5.0 |
Analyzing the strategies of top hosts, such as their property selection, pricing, and guest communication, can offer valuable lessons for optimizing your own Airbnb operations in Nonsan-si.
Dive Deeper: Advanced Nonsan-si STR Market Data (2026)
Ready to unlock more insights? AirROI provides access to advanced metrics and comprehensive Airbnb data for Nonsan-si. Explore detailed analytics beyond this report to refine your investment strategy, optimize pricing, and maximize your vacation rental profits.
Explore Advanced MetricsNonsan-si Short-Term Rental Market Composition (2026): Property & Room Types
Room Type Distribution
Property Type Distribution
Market Composition Insights for Nonsan-si
- The Nonsan-si Airbnb market composition is heavily skewed towards Entire Home/Apt listings, which make up 91.3% of the 23 active rentals. This indicates strong guest preference for privacy and space.
- Looking at the property type distribution in Nonsan-si, House properties are the most common (52.2%), reflecting the local real estate landscape.
- Houses represent a significant 52.2% portion, catering likely to families or larger groups.
- The presence of 30.4% Hotel/Boutique listings indicates integration with traditional hospitality.
Nonsan-si Airbnb Room Capacity Analysis (2026): Bedroom Distribution
Distribution of Listings by Number of Bedrooms
Room Capacity Insights for Nonsan-si
- The dominant room capacity in Nonsan-si is 2 bedrooms listings, making up 34.8% of the market. This suggests a strong demand for properties suitable for couples or solo travelers.
- Together, 2 bedrooms and 1 bedroom properties represent 56.5% of the active Airbnb listings in Nonsan-si, indicating a high concentration in these sizes.
Nonsan-si Vacation Rental Guest Capacity Trends (2026)
Distribution of Listings by Guest Capacity
Guest Capacity Insights for Nonsan-si
- The most common guest capacity trend in Nonsan-si vacation rentals is listings accommodating 8+ guests (34.8%). This suggests the primary traveler segment is likely larger groups.
- Properties designed for 8+ guests and 6 guests dominate the Nonsan-si STR market, accounting for 56.5% of listings.
- 69.5% of properties accommodate 6+ guests, serving the market segment for larger families or group travel in Nonsan-si.
- On average, properties in Nonsan-si are equipped to host 5.7 guests.
Nonsan-si Airbnb Booking Patterns (2026): Available vs. Booked Days
Available Days Distribution
Booked Days Distribution
Booking Pattern Insights for Nonsan-si
- The most common availability pattern in Nonsan-si falls within the 181-270 days range, representing 47.8% of listings. This suggests many properties have significant open periods on their calendars.
- Approximately 91.3% of listings show high availability (181+ days open annually), indicating potential for increased bookings or specific owner usage patterns.
- For booked days, the 91-180 days range is most frequent in Nonsan-si (47.8%), reflecting common guest stay durations or potential owner blocking patterns.
- A notable 8.7% of properties secure long booking periods (181+ days booked per year), highlighting successful long-term rental strategies or significant owner usage.
Nonsan-si Airbnb Minimum Stay Requirements Analysis
Distribution of Listings by Minimum Night Requirement
1 Night
22 listings
95.7% of total
2 Nights
1 listings
4.3% of total
Key Insights
- The most prevalent minimum stay requirement in Nonsan-si is 1 Night, adopted by 95.7% of listings. This highlights the market's preference for shorter, flexible bookings.
- A strong majority (100.0%) of the Nonsan-si Airbnb data shows acceptance of very short stays (1-2 nights), indicating a dynamic, high-turnover market.
Recommendations
- Align with the market by considering a 1 Night minimum stay, as 95.7% of Nonsan-si hosts use this setting.
- Adjust minimum nights based on seasonality – potentially shorter during low season and longer during peak demand periods in Nonsan-si.
Nonsan-si Airbnb Cancellation Policy Trends Analysis (2026)
Limited
1 listings
4.3% of total
Flexible
1 listings
4.3% of total
Moderate
12 listings
52.2% of total
Firm
7 listings
30.4% of total
Strict
2 listings
8.7% of total
Cancellation Policy Insights for Nonsan-si
- The prevailing Airbnb cancellation policy trend in Nonsan-si is Moderate, used by 52.2% of listings.
- There's a relatively balanced mix between guest-friendly (56.5%) and stricter (39.1%) policies, offering choices for different guest needs.
- Strict cancellation policies are quite rare (8.7%), potentially making listings with this policy less competitive unless justified by high demand or property type.
Recommendations for Hosts
- Consider adopting a Moderate policy to align with the 52.2% market standard in Nonsan-si.
- Using a Strict policy might deter some guests, as only 8.7% of listings use it. Evaluate if potential revenue protection outweighs possible lower booking rates.
- Regularly review your cancellation policy against competitors and market demand shifts in Nonsan-si.
Nonsan-si STR Booking Lead Time Analysis (2026)
Average Booking Lead Time by Month
Booking Lead Time Insights for Nonsan-si
- The overall average booking lead time for vacation rentals in Nonsan-si is 23 days.
- Guests book furthest in advance for stays during October (average 36 days), likely coinciding with peak travel demand or local events.
- The shortest booking windows occur for stays in February (average 17 days), indicating more last-minute travel plans during this time.
- Seasonally, Fall (28 days avg.) sees the longest lead times, while Winter (18 days avg.) has the shortest, reflecting typical travel planning cycles.
Recommendations for Hosts
- Use the overall average lead time (23 days) as a baseline for your pricing and availability strategy in Nonsan-si.
- For October stays, consider implementing length-of-stay discounts or slightly higher rates for bookings made less than 36 days out to capitalize on advance planning.
- Target marketing efforts for the Fall season well in advance (at least 28 days) to capture early planners.
- Monitor your own booking lead times against these Nonsan-si averages to identify opportunities for dynamic pricing adjustments.
Popular & Essential Airbnb Amenities in Nonsan-si (2026)
Amenity Prevalence
Amenity Insights for Nonsan-si
- Essential amenities in Nonsan-si that guests expect include: Heating, Wifi, Air conditioning, Kitchen, Shampoo, Hair dryer, Hot water. Lacking these (any) could significantly impact bookings.
- Popular amenities like Dishes and silverware, Free parking on premises, TV are common but not universal. Offering these can provide a competitive edge.
Recommendations for Hosts
- Ensure your listing includes all essential amenities for Nonsan-si: Heating, Wifi, Air conditioning, Kitchen, Shampoo, Hair dryer, Hot water.
- Prioritize adding missing essentials: Shampoo, Hair dryer, Hot water.
- Consider adding popular differentiators like Dishes and silverware or Free parking on premises to increase appeal.
- Highlight unique or less common amenities you offer (e.g., hot tub, dedicated workspace, EV charger) in your listing description and photos.
- Regularly check competitor amenities in Nonsan-si to stay competitive.
Nonsan-si Airbnb Guest Demographics & Profile Analysis (2026)
Guest Profile Summary for Nonsan-si
- The typical guest profile for Airbnb in Nonsan-si consists of primarily domestic travelers (94%), often arriving from nearby Seoul, typically belonging to the Post-2000s (Gen Z/Alpha) group (50%), primarily speaking Korean or English.
- Domestic travelers account for 93.5% of guests.
- Key international markets include South Korea (93.5%) and United States (3.2%).
- Top languages spoken are Korean (48.7%) followed by English (38.5%).
- A significant demographic segment is the Post-2000s (Gen Z/Alpha) group, representing 50% of guests.
Recommendations for Hosts
- Target domestic marketing efforts towards travelers from Seoul and Busan.
- Tailor amenities and listing descriptions to appeal to the dominant Post-2000s (Gen Z/Alpha) demographic (e.g., highlight fast WiFi, smart home features, local guides).
- Highlight unique local experiences or amenities relevant to the primary guest profile.
- Consider seasonal promotions aligned with peak travel times for key origin markets.
Nearby Short-Term Rental Market Comparison
How does the Nonsan-si Airbnb market stack up against its neighbors? Compare key performance metrics like average monthly revenue, ADR, and occupancy rates in surrounding areas to understand the broader regional STR landscape.
| Market | Active Properties | Monthly Revenue | Daily Rate | Avg. Occupancy |
|---|---|---|---|---|
| Homyeong-ri | 12 | $2,746 | $354.97 | 25% |
| Wondeok-ri | 10 | $2,296 | $221.70 | 36% |
| Sang | 15 | $1,951 | $254.39 | 25% |
| Icheon-ri | 10 | $1,713 | $179.19 | 31% |
| Seorak | 10 | $1,702 | $189.17 | 28% |
| Dojang-ri | 12 | $1,514 | $204.25 | 28% |
| Yeoju-si | 28 | $1,480 | $209.28 | 26% |
| Nomun-ri | 16 | $1,344 | $301.08 | 22% |
| Hwayang-eup | 30 | $1,326 | $180.87 | 26% |
| Jeongbae-ri | 13 | $1,216 | $186.07 | 28% |