Ssangbuk-ri Airbnb Market Analysis 2025: Short Term Rental Data & Vacation Rental Statistics in South Chungcheong, South Korea
Is Airbnb profitable in Ssangbuk-ri in 2025? Explore comprehensive Airbnb analytics for Ssangbuk-ri, South Chungcheong, South Korea to uncover income potential. This 2025 STR market report for Ssangbuk-ri, based on AirROI data from September 2024 to August 2025, reveals key trends in the niche market of 21 active listings.
Whether you're considering an Airbnb investment in Ssangbuk-ri, optimizing your existing vacation rental, or exploring rental arbitrage opportunities, understanding the Ssangbuk-ri Airbnb data is crucial. Leveraging the low regulation environment is key to maximizing your short term rental income potential. Let's dive into the specifics.
Key Ssangbuk-ri Airbnb Performance Metrics Overview
Monthly Airbnb Revenue Variations & Income Potential in Ssangbuk-ri (2025)
Understanding the monthly revenue variations for Airbnb listings in Ssangbuk-ri is key to maximizing your short term rental income potential. Seasonality significantly impacts earnings. Our analysis, based on data from the past 12 months, shows that the peak revenue month for STRs in Ssangbuk-ri is typically July, while June often presents the lowest earnings, highlighting opportunities for strategic pricing adjustments during shoulder and low seasons. Explore the typical Airbnb income in Ssangbuk-ri across different performance tiers:
- Best-in-class properties (Top 10%) achieve $2,446+ monthly, often utilizing dynamic pricing and superior guest experiences.
- Strong performing properties (Top 25%) earn $979 or more, indicating effective management and desirable locations/amenities.
- Typical properties (Median) generate around $574 per month, representing the average market performance.
- Entry-level properties (Bottom 25%) see earnings around $394, often with potential for optimization.
Average Monthly Airbnb Earnings Trend in Ssangbuk-ri
Ssangbuk-ri Airbnb Occupancy Rate Trends (2025)
Maximize your bookings by understanding the Ssangbuk-ri STR occupancy trends. Seasonal demand shifts significantly influence how often properties are booked. Typically, Octobersees the highest demand (peak season occupancy), while June experiences the lowest (low season). Effective strategies, like adjusting minimum stays or offering promotions, can boost occupancy during slower periods. Here's how different property tiers perform in Ssangbuk-ri:
- Best-in-class properties (Top 10%) achieve 47%+ occupancy, indicating high desirability and potentially optimized availability.
- Strong performing properties (Top 25%) maintain 30% or higher occupancy, suggesting good market fit and guest satisfaction.
- Typical properties (Median) have an occupancy rate around 18%.
- Entry-level properties (Bottom 25%) average 12% occupancy, potentially facing higher vacancy.
Average Monthly Occupancy Rate Trend in Ssangbuk-ri
Average Daily Rate (ADR) Airbnb Trends in Ssangbuk-ri (2025)
Effective short term rental pricing strategy in Ssangbuk-ri involves understanding monthly ADR fluctuations. The Average Daily Rate (ADR) for Airbnb in Ssangbuk-ri typically peaks in August and dips lowest during March. Leveraging Airbnb dynamic pricing tools or strategies based on this seasonality can significantly boost revenue. Here's a look at the typical nightly rates achieved:
- Best-in-class properties (Top 10%) command rates of $156+ per night, often due to premium features or locations.
- Strong performing properties (Top 25%) achieve nightly rates of $115 or more.
- Typical properties (Median) charge around $103 per night.
- Entry-level properties (Bottom 25%) earn around $94 per night.
Average Daily Rate (ADR) Trend by Month in Ssangbuk-ri
Get Live Ssangbuk-ri Market Intelligence 👇

Explore Real-time Analytics
Airbnb Seasonality Analysis & Trends in Ssangbuk-ri (2025)
Peak Season (July, August, October)
- Revenue averages $1,087 per month
- Occupancy rates average 26.5%
- Daily rates average $117
Shoulder Season
- Revenue averages $874 per month
- Occupancy maintains around 23.4%
- Daily rates hold near $112
Low Season (February, June, December)
- Revenue drops to average $700 per month
- Occupancy decreases to average 17.2%
- Daily rates adjust to average $113
Seasonality Insights for Ssangbuk-ri
- The Airbnb seasonality in Ssangbuk-ri shows moderate seasonality with distinct peak and low periods. While the sections above show seasonal averages, it's also insightful to look at the extremes:
- During the high season, the absolute peak month showcases Ssangbuk-ri's highest earning potential, with monthly revenues capable of climbing to $1,094, occupancy reaching a high of 27.6%, and ADRs peaking at $120.
- Conversely, the slowest single month of the year, typically falling within the low season, marks the market's lowest point. In this month, revenue might dip to $562, occupancy could drop to 14.3%, and ADRs may adjust down to $107.
- Understanding both the seasonal averages and these monthly peaks and troughs in revenue, occupancy, and ADR is crucial for maximizing your Airbnb profit potential in Ssangbuk-ri.
Seasonal Strategies for Maximizing Profit
- Peak Season: Maximize revenue through premium pricing and potentially longer minimum stays. Ensure high availability.
- Low Season: Offer competitive pricing, special promotions (e.g., extended stay discounts), and flexible cancellation policies. Target off-season travelers like remote workers or budget-conscious guests.
- Shoulder Seasons: Implement dynamic pricing that balances peak and low rates. Target weekend travelers or specific events. Offer slightly more flexible terms than peak season.
- Regularly analyze your own performance against these Ssangbuk-ri seasonality benchmarks and adjust your pricing and availability strategy accordingly.
Best Areas for Airbnb Investment in Ssangbuk-ri (2025)
Exploring the top neighborhoods for short-term rentals in Ssangbuk-ri? This section highlights key areas, outlining why they are attractive for hosts and guests, along with notable local attractions. Consider these locations based on your target guest profile and investment strategy.
| Neighborhood / Area | Why Host Here? (Target Guests & Appeal) | Key Attractions & Landmarks |
|---|---|---|
| Ssangbuk-ri Beach | A tranquil beach area Ideal for visitors seeking relaxation and natural beauty. The pristine coastline and scenic views make it a perfect getaway for families and couples. | Ssangbuk-ri Beach, Sunset Views, Beachfront Cafés, Nature Trails, Fishing Spots |
| Local Market District | The vibrant local market area where visitors can experience authentic South Korean culture and cuisine. Popular among tourists looking for unique local products and food. | Ssangbuk Market, Street Food Stalls, Traditional Craft Shops, Cultural Festivals, Local Cuisine |
| Hiking Trails | Known for beautiful hiking trails and outdoor activities that attract adventure seekers and nature lovers. Great for those looking to explore the local flora and fauna. | Mt. Sobaek National Park, Scenic Viewpoints, Hiking Paths, Wildlife Sightings, Picnic Areas |
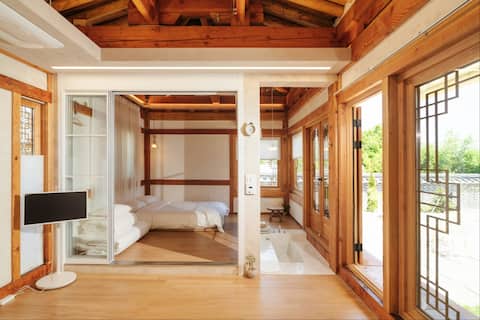
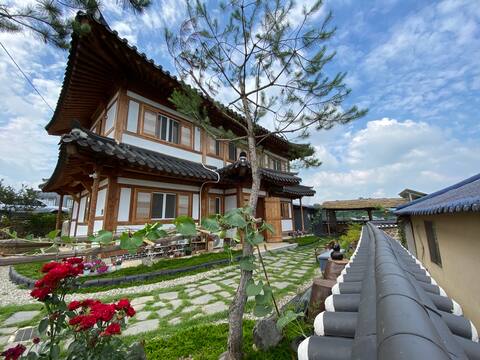
| Cultural Heritage Sites | Rich in history and culture, this area features traditional Korean architecture and heritage sites that attract both local and international tourists interested in history. | Historic Temples, Traditional Hanok Villages, Cultural Exhibitions, Local Artisans, Cultural Workshops |
| Forest Retreats | Offers a peaceful escape into nature with lush forests and serene environments. An ideal destination for travelers looking to relax and rejuvenate. | Forest Bathing, Nature Retreats, Eco-Friendly Stays, Bird Watching, Nature Photography |
| Private Villas | Luxurious private villas perfect for larger groups or families, offering privacy and comfort with beautiful surroundings. These are popular for family reunions and special occasions. | Luxury Amenities, Poolside Relaxation, Barbecue Areas, Outdoor Spaces, Group Activities |
| Spa and Wellness | A wellness hub that provides various spa treatments and relaxation techniques. Attracts those looking to unwind and pamper themselves. | Traditional Korean Spas, Wellness Retreats, Massage Therapy, Health Workshops, Yoga Classes |
| Culinary Experiences | Renowned for its culinary offerings, attracting food enthusiasts and those interested in trying local dishes prepared by top chefs. | Cooking Classes, Food Tours, Wine Tastings, Local Farms, Culinary Events |
Understanding Airbnb License Requirements & STR Laws in Ssangbuk-ri (2025)
While Ssangbuk-ri, South Chungcheong, South Korea currently shows low STR regulations, specific Airbnb license requirements might still exist or change. Always verify the latest short term rental regulations and Airbnb license requirements directly with local government authorities for Ssangbuk-ri to ensure full compliance before hosting.
(Source: AirROI data, 2025, finding no licensed listings among those analyzed)
Top Performing Airbnb Properties in Ssangbuk-ri (2025)
Benchmark your potential! Explore examples of top-performing Airbnb properties in Ssangbuk-ribased on Trailing Twelve Month (TTM) revenue. Analyze their characteristics, revenue, occupancy rate, and ADR to understand what drives success in this market.
Dalmune # Foot Bath # Emotional Hanok # Private Pension # Chungnam Certified Accommodation
Entire Place • 1 bedroom

Hae-moo-ne#Jacuzzi#Hanok Stay#Private Pension#Chungnam Certified Accommodation
Entire Place • 1 bedroom

Buseo Room, Bugyojeong Hanok Guesthouse (4 people room. Family, friend recommendation/breakfast prov
Private Room • N/A

Baekyeon Hanok (Family welcome, Female only guest room)
Private Room • N/A
Bugeo Hanok Pension with a pretty yard
Private Room • 1 bedroom
Buseojeong Hanok Guest House Love Room (4 people. Family, friend recommendation/breakfast provided)
Private Room • N/A
Note: Performance varies based on location, size, amenities, seasonality, and management quality. Data reflects the past 12 months.
Top Performing Airbnb Hosts in Ssangbuk-ri (2025)
Learn from the best! This table showcases top-performing Airbnb hosts in Ssangbuk-ri based on the number of properties managed and estimated total revenue over the past year. Analyze their scale and performance metrics.
| Host Name | Properties | Grossing Revenue | Stay Reviews | Avg Rating |
|---|---|---|---|---|
| 스테이 하녹 | 2 | $61,882 | 38 | 4.97/5.0 |
| 부여와한옥 | 4 | $24,426 | 57 | 4.84/5.0 |
| 여진 | 2 | $19,986 | 80 | 4.80/5.0 |
| 옥금 | 2 | $14,549 | 8 | 4.71/5.0 |
| 석진 | 2 | $11,447 | 19 | 4.58/5.0 |
| 양순 | 1 | $10,516 | 144 | 4.84/5.0 |
| 인성 | 3 | $8,458 | 24 | 4.22/5.0 |
| 미정 | 4 | $6,163 | 74 | 4.59/5.0 |
| 화자 | 1 | $4,230 | 13 | 4.77/5.0 |
Analyzing the strategies of top hosts, such as their property selection, pricing, and guest communication, can offer valuable lessons for optimizing your own Airbnb operations in Ssangbuk-ri.
Dive Deeper: Advanced Ssangbuk-ri STR Market Data (2025)
Ready to unlock more insights? AirROI provides access to advanced metrics and comprehensive Airbnb data for Ssangbuk-ri. Explore detailed analytics beyond this report to refine your investment strategy, optimize pricing, and maximize your vacation rental profits.
Explore Advanced MetricsSsangbuk-ri Short-Term Rental Market Composition (2025): Property & Room Types
Room Type Distribution
Property Type Distribution
Market Composition Insights for Ssangbuk-ri
- The Ssangbuk-ri Airbnb market composition is heavily skewed towards Private Room listings, which make up 85.7% of the 21 active rentals. This indicates strong guest preference for privacy and space.
- Looking at the property type distribution in Ssangbuk-ri, House properties are the most common (52.4%), reflecting the local real estate landscape.
- Houses represent a significant 52.4% portion, catering likely to families or larger groups.
- The presence of 42.9% Hotel/Boutique listings indicates integration with traditional hospitality.
- Smaller segments like outdoor/unique (combined 4.8%) offer potential for unique stay experiences.
Ssangbuk-ri Airbnb Room Capacity Analysis (2025): Bedroom Distribution
Distribution of Listings by Number of Bedrooms
Room Capacity Insights for Ssangbuk-ri
- The dominant room capacity in Ssangbuk-ri is 1 bedroom listings, making up 66.7% of the market. This suggests a strong demand for properties suitable for couples or solo travelers.
- Together, 1 bedroom and 4 bedrooms properties represent 71.5% of the active Airbnb listings in Ssangbuk-ri, indicating a high concentration in these sizes.
- With over half the market (66.7%) consisting of studios or 1-bedroom units, Ssangbuk-ri is particularly well-suited for individuals or couples.
- Listings with 3+ bedrooms (4.8%) represent a smaller niche, potentially indicating an underserved market for larger group accommodations in Ssangbuk-ri.
Ssangbuk-ri Vacation Rental Guest Capacity Trends (2025)
Distribution of Listings by Guest Capacity
Guest Capacity Insights for Ssangbuk-ri
- The most common guest capacity trend in Ssangbuk-ri vacation rentals is listings accommodating 4 guests (33.3%). This suggests the primary traveler segment is likely small families or groups.
- Properties designed for 4 guests and 2 guests dominate the Ssangbuk-ri STR market, accounting for 61.9% of listings.
- Listings for large groups (6+ guests) are relatively rare (4.8%), potentially indicating an opportunity for hosts targeting this segment in Ssangbuk-ri.
- On average, properties in Ssangbuk-ri are equipped to host 2.2 guests.
Ssangbuk-ri Airbnb Booking Patterns (2025): Available vs. Booked Days
Available Days Distribution
Booked Days Distribution
Booking Pattern Insights for Ssangbuk-ri
- The most common availability pattern in Ssangbuk-ri falls within the 271-366 days range, representing 81% of listings. This suggests many properties have significant open periods on their calendars.
- Approximately 100.0% of listings show high availability (181+ days open annually), indicating potential for increased bookings or specific owner usage patterns.
- For booked days, the 31-90 days range is most frequent in Ssangbuk-ri (57.1%), reflecting common guest stay durations or potential owner blocking patterns.
Ssangbuk-ri Airbnb Minimum Stay Requirements Analysis
Distribution of Listings by Minimum Night Requirement
1 Night
21 listings
100% of total
Key Insights
- The most prevalent minimum stay requirement in Ssangbuk-ri is 1 Night, adopted by 100% of listings. This highlights the market's preference for shorter, flexible bookings.
- A strong majority (100.0%) of the Ssangbuk-ri Airbnb data shows acceptance of very short stays (1-2 nights), indicating a dynamic, high-turnover market.
Recommendations
- Align with the market by considering a 1 Night minimum stay, as 100% of Ssangbuk-ri hosts use this setting.
- Adjust minimum nights based on seasonality – potentially shorter during low season and longer during peak demand periods in Ssangbuk-ri.
Ssangbuk-ri Airbnb Cancellation Policy Trends Analysis (2025)
Moderate
9 listings
42.9% of total
Firm
8 listings
38.1% of total
Strict
4 listings
19% of total
Cancellation Policy Insights for Ssangbuk-ri
- The prevailing Airbnb cancellation policy trend in Ssangbuk-ri is Moderate, used by 42.9% of listings.
- A majority (57.1%) of hosts in Ssangbuk-ri utilize Firm or Strict policies, indicating a market where hosts prioritize booking security.
Recommendations for Hosts
- Consider adopting a Moderate policy to align with the 42.9% market standard in Ssangbuk-ri.
- Regularly review your cancellation policy against competitors and market demand shifts in Ssangbuk-ri.
Ssangbuk-ri STR Booking Lead Time Analysis (2025)
Average Booking Lead Time by Month
Booking Lead Time Insights for Ssangbuk-ri
- The overall average booking lead time for vacation rentals in Ssangbuk-ri is 25 days.
- Guests book furthest in advance for stays during May (average 39 days), likely coinciding with peak travel demand or local events.
- The shortest booking windows occur for stays in July (average 15 days), indicating more last-minute travel plans during this time.
- Seasonally, Spring (31 days avg.) sees the longest lead times, while Winter (21 days avg.) has the shortest, reflecting typical travel planning cycles.
Recommendations for Hosts
- Use the overall average lead time (25 days) as a baseline for your pricing and availability strategy in Ssangbuk-ri.
- For May stays, consider implementing length-of-stay discounts or slightly higher rates for bookings made less than 39 days out to capitalize on advance planning.
- Target marketing efforts for the Spring season well in advance (at least 31 days) to capture early planners.
- Monitor your own booking lead times against these Ssangbuk-ri averages to identify opportunities for dynamic pricing adjustments.
Popular & Essential Airbnb Amenities in Ssangbuk-ri (2025)
Amenity Prevalence
Amenity Insights for Ssangbuk-ri
- Essential amenities in Ssangbuk-ri that guests expect include: Wifi, Smoke alarm, Carbon monoxide alarm, Heating, Essentials, Free parking on premises, Bed linens, Fire extinguisher, Hair dryer. Lacking these (any) could significantly impact bookings.
- Popular amenities like Shampoo are common but not universal. Offering these can provide a competitive edge.
Recommendations for Hosts
- Ensure your listing includes all essential amenities for Ssangbuk-ri: Wifi, Smoke alarm, Carbon monoxide alarm, Heating, Essentials, Free parking on premises, Bed linens, Fire extinguisher, Hair dryer.
- Prioritize adding missing essentials: Carbon monoxide alarm, Heating, Essentials, Free parking on premises, Bed linens, Fire extinguisher, Hair dryer.
- Consider adding popular differentiators like Shampoo to increase appeal.
- Highlight unique or less common amenities you offer (e.g., hot tub, dedicated workspace, EV charger) in your listing description and photos.
- Regularly check competitor amenities in Ssangbuk-ri to stay competitive.
Ssangbuk-ri Airbnb Guest Demographics & Profile Analysis (2025)
Guest Profile Summary for Ssangbuk-ri
- The typical guest profile for Airbnb in Ssangbuk-ri consists of primarily domestic travelers (81%), often arriving from nearby Seoul, typically belonging to the Post-2000s (Gen Z/Alpha) group (50%), primarily speaking Korean or English.
- Domestic travelers account for 81.3% of guests.
- Key international markets include South Korea (81.3%) and United States (6.3%).
- Top languages spoken are Korean (56.3%) followed by English (31.3%).
- A significant demographic segment is the Post-2000s (Gen Z/Alpha) group, representing 50% of guests.
Recommendations for Hosts
- Target domestic marketing efforts towards travelers from Seoul and New York.
- Tailor amenities and listing descriptions to appeal to the dominant Post-2000s (Gen Z/Alpha) demographic (e.g., highlight fast WiFi, smart home features, local guides).
- Highlight unique local experiences or amenities relevant to the primary guest profile.
- Consider seasonal promotions aligned with peak travel times for key origin markets.
Nearby Short-Term Rental Market Comparison
How does the Ssangbuk-ri Airbnb market stack up against its neighbors? Compare key performance metrics like average monthly revenue, ADR, and occupancy rates in surrounding areas to understand the broader regional STR landscape.
| Market | Active Properties | Monthly Revenue | Daily Rate | Avg. Occupancy |
|---|---|---|---|---|
| Homyeong-ri | 12 | $3,318 | $362.66 | 29% |
| Wondeok-ri | 10 | $2,719 | $231.64 | 40% |
| Dojang-ri | 12 | $1,833 | $200.81 | 31% |
| Seorak | 11 | $1,721 | $204.06 | 28% |
| Icheon-ri | 12 | $1,611 | $201.43 | 30% |
| Sang | 17 | $1,603 | $242.31 | 25% |
| Bokjang-ri | 14 | $1,357 | $224.40 | 20% |
| Gwangju-si | 55 | $1,329 | $159.69 | 30% |
| Hakdong-ri | 25 | $1,302 | $172.55 | 27% |
| Yeoju-si | 37 | $1,293 | $200.81 | 26% |