Avesta Airbnb Market Analysis 2026: Short Term Rental Data & Vacation Rental Statistics in Dalarna County, Sweden
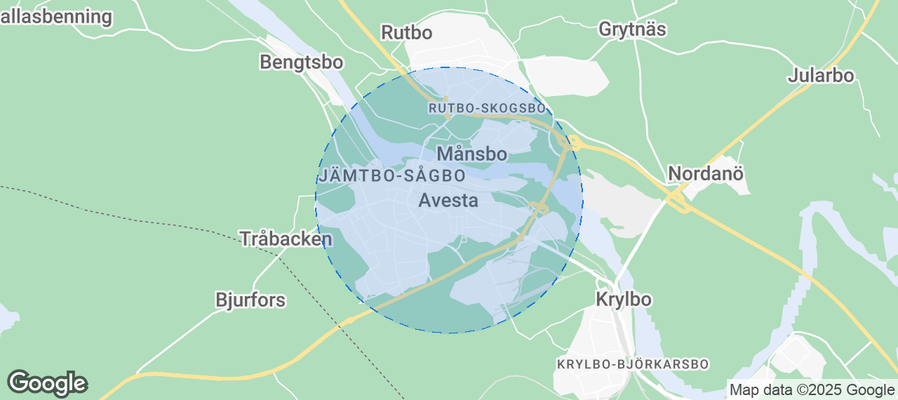
Is Airbnb profitable in Avesta in 2026? Explore comprehensive Airbnb analytics for Avesta, Dalarna County, Sweden to uncover income potential. This 2026 STR market report for Avesta, based on AirROI data from May 2024 to April 2025, reveals key trends in the niche market of 22 active listings.
Whether you're considering an Airbnb investment in Avesta, optimizing your existing vacation rental, or exploring rental arbitrage opportunities, understanding the Avesta Airbnb data is crucial. Leveraging the low regulation environment is key to maximizing your short term rental income potential. Let's dive into the specifics.
Key Avesta Airbnb Performance Metrics Overview
Monthly Airbnb Revenue Variations & Income Potential in Avesta (2026)
Understanding the monthly revenue variations for Airbnb listings in Avesta is key to maximizing your short term rental income potential. Seasonality significantly impacts earnings. Our analysis, based on data from the past 12 months, shows that the peak revenue month for STRs in Avesta is typically May, while November often presents the lowest earnings, highlighting opportunities for strategic pricing adjustments during shoulder and low seasons. Explore the typical Airbnb income in Avesta across different performance tiers:
- Best-in-class properties (Top 10%) achieve $3,317+ monthly, often utilizing dynamic pricing and superior guest experiences.
- Strong performing properties (Top 25%) earn $2,283 or more, indicating effective management and desirable locations/amenities.
- Typical properties (Median) generate around $1,357 per month, representing the average market performance.
- Entry-level properties (Bottom 25%) see earnings around $928, often with potential for optimization.
Average Monthly Airbnb Earnings Trend in Avesta
Avesta Airbnb Occupancy Rate Trends (2026)
Maximize your bookings by understanding the Avesta STR occupancy trends. Seasonal demand shifts significantly influence how often properties are booked. Typically, Decembersees the highest demand (peak season occupancy), while April experiences the lowest (low season). Effective strategies, like adjusting minimum stays or offering promotions, can boost occupancy during slower periods. Here's how different property tiers perform in Avesta:
- Best-in-class properties (Top 10%) achieve 52%+ occupancy, indicating high desirability and potentially optimized availability.
- Strong performing properties (Top 25%) maintain 37% or higher occupancy, suggesting good market fit and guest satisfaction.
- Typical properties (Median) have an occupancy rate around 23%.
- Entry-level properties (Bottom 25%) average 17% occupancy, potentially facing higher vacancy.
Average Monthly Occupancy Rate Trend in Avesta
Average Daily Rate (ADR) Airbnb Trends in Avesta (2026)
Effective short term rental pricing strategy in Avesta involves understanding monthly ADR fluctuations. The Average Daily Rate (ADR) for Airbnb in Avesta typically peaks in August and dips lowest during March. Leveraging Airbnb dynamic pricing tools or strategies based on this seasonality can significantly boost revenue. Here's a look at the typical nightly rates achieved:
- Best-in-class properties (Top 10%) command rates of $192+ per night, often due to premium features or locations.
- Strong performing properties (Top 25%) achieve nightly rates of $145 or more.
- Typical properties (Median) charge around $105 per night.
- Entry-level properties (Bottom 25%) earn around $81 per night.
Average Daily Rate (ADR) Trend by Month in Avesta
Get Live Avesta Market Intelligence 👇
Explore Real-time Analytics
Airbnb Seasonality Analysis & Trends in Avesta (2025)
Peak Season (May, June, March)
- Revenue averages $3,175 per month
- Occupancy rates average 18.9%
- Daily rates average $123
Shoulder Season
- Revenue averages $1,340 per month
- Occupancy maintains around 29.0%
- Daily rates hold near $116
Low Season (September, October, November)
- Revenue drops to average $849 per month
- Occupancy decreases to average 27.0%
- Daily rates adjust to average $129
Seasonality Insights for Avesta
- The Airbnb seasonality in Avesta shows highly seasonal trends requiring careful strategy. While the sections above show seasonal averages, it's also insightful to look at the extremes:
- During the high season, the absolute peak month showcases Avesta's highest earning potential, with monthly revenues capable of climbing to $4,107, occupancy reaching a high of 46.2%, and ADRs peaking at $137.
- Conversely, the slowest single month of the year, typically falling within the low season, marks the market's lowest point. In this month, revenue might dip to $770, occupancy could drop to 0.0%, and ADRs may adjust down to $104.
- Understanding both the seasonal averages and these monthly peaks and troughs in revenue, occupancy, and ADR is crucial for maximizing your Airbnb profit potential in Avesta.
Seasonal Strategies for Maximizing Profit
- Peak Season: Maximize revenue through premium pricing and potentially longer minimum stays. Ensure high availability.
- Low Season: Offer competitive pricing, special promotions (e.g., extended stay discounts), and flexible cancellation policies. Target off-season travelers like remote workers or budget-conscious guests.
- Shoulder Seasons: Implement dynamic pricing that balances peak and low rates. Target weekend travelers or specific events. Offer slightly more flexible terms than peak season.
- Regularly analyze your own performance against these Avesta seasonality benchmarks and adjust your pricing and availability strategy accordingly.
Best Areas for Airbnb Investment in Avesta (2026)
Exploring the top neighborhoods for short-term rentals in Avesta? This section highlights key areas, outlining why they are attractive for hosts and guests, along with notable local attractions. Consider these locations based on your target guest profile and investment strategy.
| Neighborhood / Area | Why Host Here? (Target Guests & Appeal) | Key Attractions & Landmarks |
|---|---|---|
| Avesta City Center | The heart of Avesta, offering convenient access to shops, restaurants, and cultural attractions. A great place for travelers who want to experience the local lifestyle and amenities. | Avesta Art, Dalarna Museum, Avestafallen, Avesta Golf Club, Lindesbergs Museum |
| Torsång | A picturesque village known for its scenic beauty and historical significance. Attracts guests looking for a serene getaway close to nature and traditional Swedish architecture. | Torsång Church, Lake Aviken, Walking trails, Nearby nature reserves |
| Hedemora | Just a short drive from Avesta, Hedemora offers a cozy small-town atmosphere with historical charm. Ideal for visitors seeking tranquility and local culture. | Hedemora Church, The Old Town, Hedemora Glasto, Dalarna Railway |
| Skattungbyn | A charming village that provides a tranquil rural experience, perfect for visitors looking to escape the hustle and bustle of city life. | Beautiful countryside views, Local farm experiences, Hiking trails |
| Korsnäs | Known for its close proximity to water activities and nature exploration. An ideal spot for families and outdoor enthusiasts. | Korsnäsviken, Fishing opportunities, Boating and kayaking |
| Smedjebacken | Another nearby town offering a friendly environment and access to local attractions. Suitable for guests who appreciate quieter towns with history. | Smedjebacken Church, Local arts and crafts stores, Historical society museum |
| Stora Skedvi | A serene village perfect for nature lovers, with opportunities for hiking and enjoying the Swedish landscape. Ideal for longer stays in nature. | Beautiful lakes and forests, Hiking paths, Biking routes |
| Borlänge | A larger nearby city with urban amenities, shopping, and entertainment. Great for travelers who want city conveniences while being close to Avesta. | Kupolen Shopping Center, Borås Energy Park, Dalarna University |
Understanding Airbnb License Requirements & STR Laws in Avesta (2026)
While Avesta, Dalarna County, Sweden currently shows low STR regulations, specific Airbnb license requirements might still exist or change. Always verify the latest short term rental regulations and Airbnb license requirements directly with local government authorities for Avesta to ensure full compliance before hosting.
(Source: AirROI data, 2026, finding no licensed listings among those analyzed)
Top Performing Airbnb Properties in Avesta (2026)
Benchmark your potential! Explore examples of top-performing Airbnb properties in Avestabased on Trailing Twelve Month (TTM) revenue. Analyze their characteristics, revenue, occupancy rate, and ADR to understand what drives success in this market.
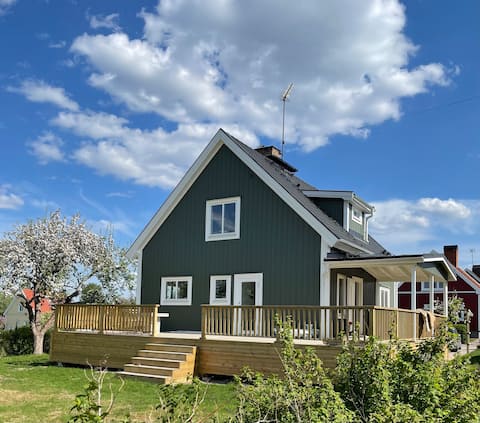
Newly renovated house in Avesta.
Entire Place • 3 bedrooms
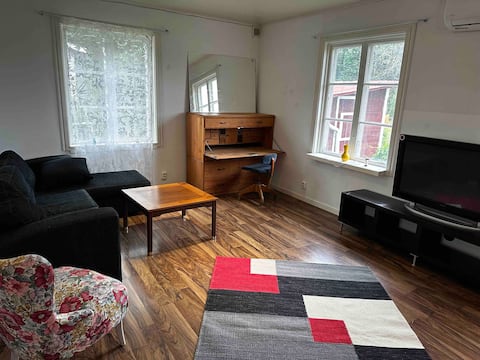
Krylbo Avesta uthyrning pågår
Entire Place • 2 bedrooms
Krylbo Avesta lägenhet eget hus
Entire Place • 1 bedroom
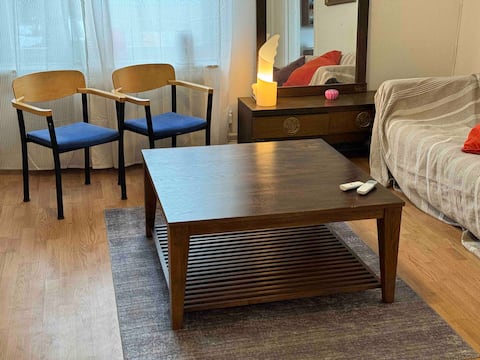
Underbar 2a i krylbo
Entire Place • 1 bedroom
rum i mysig lägenhet nya bilder kommer. Krylbo
Private Room • 1 bedroom
nu har du din 2 du söker
Entire Place • 1 bedroom
Note: Performance varies based on location, size, amenities, seasonality, and management quality. Data reflects the past 12 months.
Top Performing Airbnb Hosts in Avesta (2026)
Learn from the best! This table showcases top-performing Airbnb hosts in Avesta based on the number of properties managed and estimated total revenue over the past year. Analyze their scale and performance metrics.
| Host Name | Properties | Grossing Revenue | Stay Reviews | Avg Rating |
|---|---|---|---|---|
| Host #1189021 | 9 | $96,884 | 0 | 0.00/5.0 |
| Host #434877880 | 5 | $48,084 | 0 | 0.00/5.0 |
| Erdem | 3 | $30,293 | 13 | 3.04/5.0 |
| Elice | 1 | $24,148 | 5 | 5.00/5.0 |
| Host #218933888 | 1 | $10,894 | 0 | 0.00/5.0 |
| Host #372897109 | 1 | $7,473 | 0 | 0.00/5.0 |
| Host #244612231 | 1 | $3,036 | 11 | 5.00/5.0 |
| Ghassan | 1 | $670 | 18 | 4.72/5.0 |
Analyzing the strategies of top hosts, such as their property selection, pricing, and guest communication, can offer valuable lessons for optimizing your own Airbnb operations in Avesta.
Dive Deeper: Advanced Avesta STR Market Data (2026)
Ready to unlock more insights? AirROI provides access to advanced metrics and comprehensive Airbnb data for Avesta. Explore detailed analytics beyond this report to refine your investment strategy, optimize pricing, and maximize your vacation rental profits.
Explore Advanced MetricsAvesta Short-Term Rental Market Composition (2026): Property & Room Types
Room Type Distribution
Property Type Distribution
Market Composition Insights for Avesta
- The Avesta Airbnb market composition is heavily skewed towards Entire Home/Apt listings, which make up 90.9% of the 22 active rentals. This indicates strong guest preference for privacy and space.
- Looking at the property type distribution in Avesta, Apartment/Condo properties are the most common (81.8%), reflecting the local real estate landscape.
- Smaller segments like outdoor/unique (combined 4.5%) offer potential for unique stay experiences.
Avesta Airbnb Room Capacity Analysis (2026): Bedroom Distribution
Distribution of Listings by Number of Bedrooms
Room Capacity Insights for Avesta
- The dominant room capacity in Avesta is 1 bedroom listings, making up 68.2% of the market. This suggests a strong demand for properties suitable for couples or solo travelers.
- Together, 1 bedroom and 2 bedrooms properties represent 90.9% of the active Airbnb listings in Avesta, indicating a high concentration in these sizes.
- With over half the market (68.2%) consisting of studios or 1-bedroom units, Avesta is particularly well-suited for individuals or couples.
- Listings with 3+ bedrooms (4.5%) represent a smaller niche, potentially indicating an underserved market for larger group accommodations in Avesta.
Avesta Vacation Rental Guest Capacity Trends (2026)
Distribution of Listings by Guest Capacity
Guest Capacity Insights for Avesta
- The most common guest capacity trend in Avesta vacation rentals is listings accommodating 2 guests (54.5%). This suggests the primary traveler segment is likely couples or solo travelers.
- Properties designed for 2 guests and 4 guests dominate the Avesta STR market, accounting for 72.7% of listings.
- A significant 59.0% of listings cater specifically to 1-2 guests, highlighting strong demand from couples and solo travelers in Avesta.
- On average, properties in Avesta are equipped to host 3.0 guests.
Avesta Airbnb Booking Patterns (2026): Available vs. Booked Days
Available Days Distribution
Booked Days Distribution
Booking Pattern Insights for Avesta
- The most common availability pattern in Avesta falls within the 271-366 days range, representing 81.8% of listings. This suggests many properties have significant open periods on their calendars.
- Approximately 95.4% of listings show high availability (181+ days open annually), indicating potential for increased bookings or specific owner usage patterns.
- For booked days, the 31-90 days range is most frequent in Avesta (72.7%), reflecting common guest stay durations or potential owner blocking patterns.
- A notable 4.5% of properties secure long booking periods (181+ days booked per year), highlighting successful long-term rental strategies or significant owner usage.
Avesta Airbnb Minimum Stay Requirements Analysis
Distribution of Listings by Minimum Night Requirement
1 Night
18 listings
85.7% of total
2 Nights
2 listings
9.5% of total
3 Nights
1 listings
4.8% of total
Key Insights
- The most prevalent minimum stay requirement in Avesta is 1 Night, adopted by 85.7% of listings. This highlights the market's preference for shorter, flexible bookings.
- A strong majority (95.2%) of the Avesta Airbnb data shows acceptance of very short stays (1-2 nights), indicating a dynamic, high-turnover market.
Recommendations
- Align with the market by considering a 1 Night minimum stay, as 85.7% of Avesta hosts use this setting.
- Adjust minimum nights based on seasonality – potentially shorter during low season and longer during peak demand periods in Avesta.
Avesta Airbnb Cancellation Policy Trends Analysis (2026)
Flexible
4 listings
100% of total
Cancellation Policy Insights for Avesta
- The prevailing Airbnb cancellation policy trend in Avesta is Flexible, used by 100% of listings.
- The market strongly favors guest-friendly terms, with 100.0% of listings offering Flexible or Moderate policies. This suggests guests in Avesta may expect booking flexibility.
Recommendations for Hosts
- Consider adopting a Flexible policy to align with the 100% market standard in Avesta.
- Given the high prevalence of Flexible policies (100%), offering this can enhance booking appeal, especially during shoulder seasons.
- Regularly review your cancellation policy against competitors and market demand shifts in Avesta.
Avesta STR Booking Lead Time Analysis (2026)
Average Booking Lead Time by Month
Booking Lead Time Insights for Avesta
- The overall average booking lead time for vacation rentals in Avesta is 11 days.
- Guests book furthest in advance for stays during March (average 36 days), likely coinciding with peak travel demand or local events.
- The shortest booking windows occur for stays in May (average 0 days), indicating more last-minute travel plans during this time.
- Seasonally, Winter (13 days avg.) sees the longest lead times, while Fall (7 days avg.) has the shortest, reflecting typical travel planning cycles.
Recommendations for Hosts
- Use the overall average lead time (11 days) as a baseline for your pricing and availability strategy in Avesta.
- For March stays, consider implementing length-of-stay discounts or slightly higher rates for bookings made less than 36 days out to capitalize on advance planning.
- During May, focus on last-minute booking availability and promotions, as guests book with very short notice (0 days avg.).
- Target marketing efforts for the Winter season well in advance (at least 13 days) to capture early planners.
- Monitor your own booking lead times against these Avesta averages to identify opportunities for dynamic pricing adjustments.
Popular & Essential Airbnb Amenities in Avesta (2026)
Amenity Prevalence
Amenity Insights for Avesta
- Essential amenities in Avesta that guests expect include: Kitchen, Smoke alarm, TV, Free parking on premises, Washer, Hot water, Heating. Lacking these (any) could significantly impact bookings.
- Popular amenities like Essentials, Wifi, Dryer are common but not universal. Offering these can provide a competitive edge.
- Warning: Wifi is not universally provided but is considered essential globally. Ensure reliable Wifi is offered.
Recommendations for Hosts
- Ensure your listing includes all essential amenities for Avesta: Kitchen, Smoke alarm, TV, Free parking on premises, Washer, Hot water, Heating.
- Prioritize adding missing essentials: TV, Free parking on premises, Washer, Hot water, Heating.
- Consider adding popular differentiators like Essentials or Wifi to increase appeal.
- Highlight unique or less common amenities you offer (e.g., hot tub, dedicated workspace, EV charger) in your listing description and photos.
- Regularly check competitor amenities in Avesta to stay competitive.
Avesta Airbnb Guest Demographics & Profile Analysis (2026)
Guest Profile Summary for Avesta
- The typical guest profile for Airbnb in Avesta consists of primarily domestic travelers (67%), often arriving from nearby Stockholm, typically belonging to the Post-2000s (Gen Z/Alpha) group (50%), primarily speaking English or Swedish.
- Domestic travelers account for 66.7% of guests.
- Key international markets include Sweden (66.7%) and Poland (16.7%).
- Top languages spoken are English (35.3%) followed by Swedish (20.6%).
- A significant demographic segment is the Post-2000s (Gen Z/Alpha) group, representing 50% of guests.
Recommendations for Hosts
- Target domestic marketing efforts towards travelers from Stockholm and Szczecin.
- Tailor amenities and listing descriptions to appeal to the dominant Post-2000s (Gen Z/Alpha) demographic (e.g., highlight fast WiFi, smart home features, local guides).
- Highlight unique local experiences or amenities relevant to the primary guest profile.
- Consider seasonal promotions aligned with peak travel times for key origin markets.
Nearby Short-Term Rental Market Comparison
How does the Avesta Airbnb market stack up against its neighbors? Compare key performance metrics like average monthly revenue, ADR, and occupancy rates in surrounding areas to understand the broader regional STR landscape.
| Market | Active Properties | Monthly Revenue | Daily Rate | Avg. Occupancy |
|---|---|---|---|---|
| Söderhamns kommun | 23 | $2,469 | $178.21 | 41% |
| Flen | 11 | $2,277 | $141.03 | 45% |
| Kungsängen | 10 | $2,221 | $262.28 | 44% |
| Gysinge | 21 | $1,733 | $220.90 | 23% |
| Arboga kommun | 15 | $1,640 | $139.20 | 43% |
| Flens kommun | 53 | $1,640 | $182.85 | 38% |
| Ekerö kommun | 132 | $1,501 | $195.30 | 39% |
| Katrineholms kommun | 30 | $1,474 | $158.81 | 38% |
| Mariefred | 19 | $1,473 | $180.11 | 33% |
| Gnesta kommun | 48 | $1,435 | $190.36 | 32% |