Burgsvik Airbnb Market Analysis 2026: Short Term Rental Data & Vacation Rental Statistics in Gotland County, Sweden
Is Airbnb profitable in Burgsvik in 2026? Explore comprehensive Airbnb analytics for Burgsvik, Gotland County, Sweden to uncover income potential. This 2026 STR market report for Burgsvik, based on AirROI data from May 2024 to April 2025, reveals key trends in the niche market of 17 active listings.
Whether you're considering an Airbnb investment in Burgsvik, optimizing your existing vacation rental, or exploring rental arbitrage opportunities, understanding the Burgsvik Airbnb data is crucial. Leveraging the low regulation environment is key to maximizing your short term rental income potential. Let's dive into the specifics.
Key Burgsvik Airbnb Performance Metrics Overview
Monthly Airbnb Revenue Variations & Income Potential in Burgsvik (2026)
Understanding the monthly revenue variations for Airbnb listings in Burgsvik is key to maximizing your short term rental income potential. Seasonality significantly impacts earnings. Our analysis, based on data from the past 12 months, shows that the peak revenue month for STRs in Burgsvik is typically July, while January often presents the lowest earnings, highlighting opportunities for strategic pricing adjustments during shoulder and low seasons. Explore the typical Airbnb income in Burgsvik across different performance tiers:
- Best-in-class properties (Top 10%) achieve $3,280+ monthly, often utilizing dynamic pricing and superior guest experiences.
- Strong performing properties (Top 25%) earn $2,267 or more, indicating effective management and desirable locations/amenities.
- Typical properties (Median) generate around $1,058 per month, representing the average market performance.
- Entry-level properties (Bottom 25%) see earnings around $666, often with potential for optimization.
Average Monthly Airbnb Earnings Trend in Burgsvik
Burgsvik Airbnb Occupancy Rate Trends (2026)
Maximize your bookings by understanding the Burgsvik STR occupancy trends. Seasonal demand shifts significantly influence how often properties are booked. Typically, Julysees the highest demand (peak season occupancy), while January experiences the lowest (low season). Effective strategies, like adjusting minimum stays or offering promotions, can boost occupancy during slower periods. Here's how different property tiers perform in Burgsvik:
- Best-in-class properties (Top 10%) achieve 50%+ occupancy, indicating high desirability and potentially optimized availability.
- Strong performing properties (Top 25%) maintain 38% or higher occupancy, suggesting good market fit and guest satisfaction.
- Typical properties (Median) have an occupancy rate around 21%.
- Entry-level properties (Bottom 25%) average 10% occupancy, potentially facing higher vacancy.
Average Monthly Occupancy Rate Trend in Burgsvik
Average Daily Rate (ADR) Airbnb Trends in Burgsvik (2026)
Effective short term rental pricing strategy in Burgsvik involves understanding monthly ADR fluctuations. The Average Daily Rate (ADR) for Airbnb in Burgsvik typically peaks in December and dips lowest during September. Leveraging Airbnb dynamic pricing tools or strategies based on this seasonality can significantly boost revenue. Here's a look at the typical nightly rates achieved:
- Best-in-class properties (Top 10%) command rates of $341+ per night, often due to premium features or locations.
- Strong performing properties (Top 25%) achieve nightly rates of $221 or more.
- Typical properties (Median) charge around $154 per night.
- Entry-level properties (Bottom 25%) earn around $105 per night.
Average Daily Rate (ADR) Trend by Month in Burgsvik
Get Live Burgsvik Market Intelligence 👇

Explore Real-time Analytics
Airbnb Seasonality Analysis & Trends in Burgsvik (2025)
Peak Season (July, December, October)
- Revenue averages $3,234 per month
- Occupancy rates average 35.3%
- Daily rates average $218
Shoulder Season
- Revenue averages $1,197 per month
- Occupancy maintains around 26.1%
- Daily rates hold near $212
Low Season (January, March, May)
- Revenue drops to average $365 per month
- Occupancy decreases to average 12.3%
- Daily rates adjust to average $220
Seasonality Insights for Burgsvik
- The Airbnb seasonality in Burgsvik shows highly seasonal trends requiring careful strategy. While the sections above show seasonal averages, it's also insightful to look at the extremes:
- During the high season, the absolute peak month showcases Burgsvik's highest earning potential, with monthly revenues capable of climbing to $4,398, occupancy reaching a high of 68.7%, and ADRs peaking at $248.
- Conversely, the slowest single month of the year, typically falling within the low season, marks the market's lowest point. In this month, revenue might dip to $203, occupancy could drop to 4.3%, and ADRs may adjust down to $199.
- Understanding both the seasonal averages and these monthly peaks and troughs in revenue, occupancy, and ADR is crucial for maximizing your Airbnb profit potential in Burgsvik.
Seasonal Strategies for Maximizing Profit
- Peak Season: Maximize revenue through premium pricing and potentially longer minimum stays. Ensure high availability.
- Low Season: Offer competitive pricing, special promotions (e.g., extended stay discounts), and flexible cancellation policies. Target off-season travelers like remote workers or budget-conscious guests.
- Shoulder Seasons: Implement dynamic pricing that balances peak and low rates. Target weekend travelers or specific events. Offer slightly more flexible terms than peak season.
- Regularly analyze your own performance against these Burgsvik seasonality benchmarks and adjust your pricing and availability strategy accordingly.
Best Areas for Airbnb Investment in Burgsvik (2026)
Exploring the top neighborhoods for short-term rentals in Burgsvik? This section highlights key areas, outlining why they are attractive for hosts and guests, along with notable local attractions. Consider these locations based on your target guest profile and investment strategy.
| Neighborhood / Area | Why Host Here? (Target Guests & Appeal) | Key Attractions & Landmarks |
|---|---|---|
| Burgsvik Beach | A picturesque beach area known for its stunning coastline and tranquil atmosphere. Ideal for tourists looking for a peaceful retreat by the sea. | Burgsvik Beach, Burgsvik Harbor, Local seafood restaurants, Walking trails, Fishing spots |
| Burgsvik Village | A quaint village atmosphere with traditional Swedish architecture and a close-knit community. Attracts visitors looking for charm and local culture. | Historic buildings, Local shops, Cafés, Art galleries, Cultural events |
| Klintehamn | Nearby Klintehamn offers convenient access to additional amenities and has a beautiful harbor area. Great for those wanting to explore more of Gotland's coastal beauty. | Klintehamn Marina, Klinte Church, Beaches, Nature reserves, Cycling paths |
| Lye | A small, scenic area known for its landscapes and proximity to nature reserves, perfect for outdoor enthusiasts seeking relaxation in a natural setting. | Lye Nature Reserve, Bird watching, Hiking trails, Scenic views, Local wildlife |
| Sundre | Offers a blend of countryside charm and access to local attractions, making it an ideal spot for family vacations and nature lovers. | Sundre Nature Reserve, Local farms, Quiet trails, Picnic areas, Cultural heritage sites |
| Stånga | A peaceful rural area with stunning landscapes and proximity to Gotland's history and culture, ideal for those wanting a rural getaway. | Stånga Church, Historical sites, Countryside walks, Local markets, Cozy accommodations |
| Visby | Although not Burgsvik, Visby is the main tourist hub on Gotland, famous for its medieval buildings and vibrant atmosphere, drawing numerous visitors throughout the year. | Gotland Museum, Visby Ringwall, Botanical Gardens, Shopping streets, Restaurants and nightlife |
| Fårö | Accessible from Burgsvik, Fårö is known for its unique natural beauty and cultural significance, attracting visitors who appreciate nature and film history (Trollhattan's Bergman). | Fårö Beaches, Bergman Center, Lighthouse sites, Scenic landscapes, Fårö village |
Understanding Airbnb License Requirements & STR Laws in Burgsvik (2026)
While Burgsvik, Gotland County, Sweden currently shows low STR regulations, specific Airbnb license requirements might still exist or change. Always verify the latest short term rental regulations and Airbnb license requirements directly with local government authorities for Burgsvik to ensure full compliance before hosting.
(Source: AirROI data, 2026, finding no licensed listings among those analyzed)
Top Performing Airbnb Properties in Burgsvik (2026)
Benchmark your potential! Explore examples of top-performing Airbnb properties in Burgsvikbased on Trailing Twelve Month (TTM) revenue. Analyze their characteristics, revenue, occupancy rate, and ADR to understand what drives success in this market.
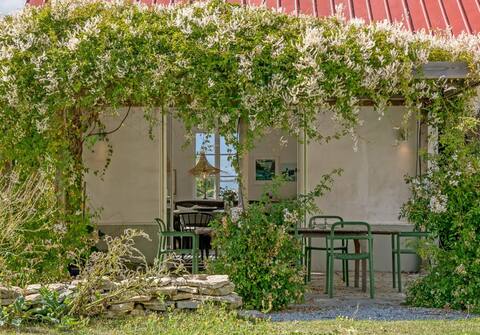
House with sea view in the heart of Burgsvik
Entire Place • 4 bedrooms
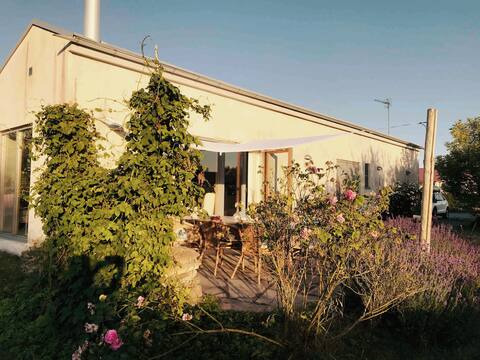
Awesome home in Burgsvik with WiFi
Entire Place • 3 bedrooms
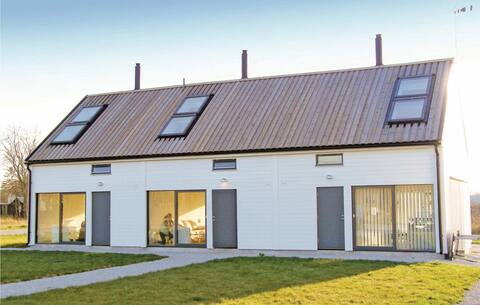
Modern stone house near beach and harbour
Entire Place • 4 bedrooms
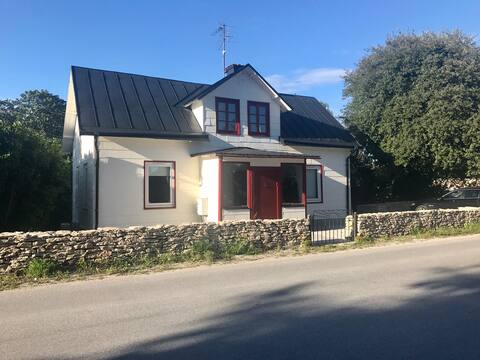
House with 9 beds in the middle of Burgsvik on southern Gotland
Entire Place • 4 bedrooms
House + guesthouse at Hamnvägen in Burgsvik 6-8 beds.
Entire Place • 3 bedrooms

Architect-designed villa on Gotland alvarmark
Entire Place • 3 bedrooms
Note: Performance varies based on location, size, amenities, seasonality, and management quality. Data reflects the past 12 months.
Top Performing Airbnb Hosts in Burgsvik (2026)
Learn from the best! This table showcases top-performing Airbnb hosts in Burgsvik based on the number of properties managed and estimated total revenue over the past year. Analyze their scale and performance metrics.
| Host Name | Properties | Grossing Revenue | Stay Reviews | Avg Rating |
|---|---|---|---|---|
| Anna/Peter | 3 | $23,376 | 78 | 4.90/5.0 |
| Gabriella | 1 | $16,588 | 5 | 5.00/5.0 |
| Novasol | 1 | $15,887 | 7 | 3.86/5.0 |
| Sofia | 1 | $13,757 | 20 | 4.60/5.0 |
| Anna | 1 | $11,131 | 9 | 4.89/5.0 |
| Per | 1 | $10,796 | 26 | 4.50/5.0 |
| Host #50889996 | 1 | $10,641 | 0 | 0.00/5.0 |
| Kristofer | 1 | $9,536 | 5 | 5.00/5.0 |
| Jon | 1 | $7,042 | 20 | 4.50/5.0 |
| Eva | 1 | $6,351 | 14 | 4.93/5.0 |
Analyzing the strategies of top hosts, such as their property selection, pricing, and guest communication, can offer valuable lessons for optimizing your own Airbnb operations in Burgsvik.
Dive Deeper: Advanced Burgsvik STR Market Data (2026)
Ready to unlock more insights? AirROI provides access to advanced metrics and comprehensive Airbnb data for Burgsvik. Explore detailed analytics beyond this report to refine your investment strategy, optimize pricing, and maximize your vacation rental profits.
Explore Advanced MetricsBurgsvik Short-Term Rental Market Composition (2026): Property & Room Types
Room Type Distribution
Property Type Distribution
Market Composition Insights for Burgsvik
- The Burgsvik Airbnb market composition is heavily skewed towards Entire Home/Apt listings, which make up 100% of the 17 active rentals. This indicates strong guest preference for privacy and space.
- Looking at the property type distribution in Burgsvik, House properties are the most common (76.5%), reflecting the local real estate landscape.
- Houses represent a significant 76.5% portion, catering likely to families or larger groups.
- The presence of 5.9% Hotel/Boutique listings indicates integration with traditional hospitality.
Burgsvik Airbnb Room Capacity Analysis (2026): Bedroom Distribution
Distribution of Listings by Number of Bedrooms
Room Capacity Insights for Burgsvik
- The dominant room capacity in Burgsvik is 3 bedrooms listings, making up 47.1% of the market. This suggests a strong demand for properties suitable for families or small groups.
- Together, 3 bedrooms and 4 bedrooms properties represent 70.6% of the active Airbnb listings in Burgsvik, indicating a high concentration in these sizes.
- A significant 76.5% of listings offer 3+ bedrooms, catering to larger groups and families seeking more space in Burgsvik.
Burgsvik Vacation Rental Guest Capacity Trends (2026)
Distribution of Listings by Guest Capacity
Guest Capacity Insights for Burgsvik
- The most common guest capacity trend in Burgsvik vacation rentals is listings accommodating 8+ guests (41.2%). This suggests the primary traveler segment is likely larger groups.
- Properties designed for 8+ guests and 6 guests dominate the Burgsvik STR market, accounting for 70.6% of listings.
- 76.5% of properties accommodate 6+ guests, serving the market segment for larger families or group travel in Burgsvik.
- On average, properties in Burgsvik are equipped to host 6.5 guests.
Burgsvik Airbnb Booking Patterns (2026): Available vs. Booked Days
Available Days Distribution
Booked Days Distribution
Booking Pattern Insights for Burgsvik
- The most common availability pattern in Burgsvik falls within the 271-366 days range, representing 100% of listings. This suggests many properties have significant open periods on their calendars.
- Approximately 100.0% of listings show high availability (181+ days open annually), indicating potential for increased bookings or specific owner usage patterns.
- For booked days, the 31-90 days range is most frequent in Burgsvik (70.6%), reflecting common guest stay durations or potential owner blocking patterns.
Burgsvik Airbnb Minimum Stay Requirements Analysis
Distribution of Listings by Minimum Night Requirement
1 Night
3 listings
17.6% of total
2 Nights
2 listings
11.8% of total
3 Nights
4 listings
23.5% of total
4-6 Nights
4 listings
23.5% of total
7-29 Nights
4 listings
23.5% of total
Key Insights
- The most prevalent minimum stay requirement in Burgsvik is 3 Nights, adopted by 23.5% of listings. This highlights the market's preference for longer commitments.
Recommendations
- Align with the market by considering a 3 Nights minimum stay, as 23.5% of Burgsvik hosts use this setting.
- If feasible, allowing 1-night stays, especially midweek or during low season, could capture last-minute bookings, as only 17.6% currently do.
- Adjust minimum nights based on seasonality – potentially shorter during low season and longer during peak demand periods in Burgsvik.
Burgsvik Airbnb Cancellation Policy Trends Analysis (2026)
Super Strict 60 Days
1 listings
7.7% of total
Moderate
2 listings
15.4% of total
Firm
4 listings
30.8% of total
Strict
6 listings
46.2% of total
Cancellation Policy Insights for Burgsvik
- The prevailing Airbnb cancellation policy trend in Burgsvik is Strict, used by 46.2% of listings.
- A majority (77.0%) of hosts in Burgsvik utilize Firm or Strict policies, indicating a market where hosts prioritize booking security.
Recommendations for Hosts
- Consider adopting a Strict policy to align with the 46.2% market standard in Burgsvik.
- With 46.2% using Strict terms, this is a viable option in Burgsvik, particularly for high-value properties or during peak demand periods.
- Regularly review your cancellation policy against competitors and market demand shifts in Burgsvik.
Burgsvik STR Booking Lead Time Analysis (2026)
Average Booking Lead Time by Month
Booking Lead Time Insights for Burgsvik
- The overall average booking lead time for vacation rentals in Burgsvik is 85 days.
- Guests book furthest in advance for stays during November (average 193 days), likely coinciding with peak travel demand or local events.
- The shortest booking windows occur for stays in December (average 4 days), indicating more last-minute travel plans during this time.
- Seasonally, Summer (145 days avg.) sees the longest lead times, while Winter (9 days avg.) has the shortest, reflecting typical travel planning cycles.
Recommendations for Hosts
- Use the overall average lead time (85 days) as a baseline for your pricing and availability strategy in Burgsvik.
- For November stays, consider implementing length-of-stay discounts or slightly higher rates for bookings made less than 193 days out to capitalize on advance planning.
- During December, focus on last-minute booking availability and promotions, as guests book with very short notice (4 days avg.).
- Target marketing efforts for the Summer season well in advance (at least 145 days) to capture early planners.
- Monitor your own booking lead times against these Burgsvik averages to identify opportunities for dynamic pricing adjustments.
Popular & Essential Airbnb Amenities in Burgsvik (2026)
Amenity Prevalence
Amenity Insights for Burgsvik
- Essential amenities in Burgsvik that guests expect include: Stove, Dishes and silverware, Refrigerator, Free parking on premises, Kitchen. Lacking these (any) could significantly impact bookings.
- Popular amenities like Smoke alarm, Dishwasher, Heating are common but not universal. Offering these can provide a competitive edge.
Recommendations for Hosts
- Ensure your listing includes all essential amenities for Burgsvik: Stove, Dishes and silverware, Refrigerator, Free parking on premises, Kitchen.
- Consider adding popular differentiators like Smoke alarm or Dishwasher to increase appeal.
- Highlight unique or less common amenities you offer (e.g., hot tub, dedicated workspace, EV charger) in your listing description and photos.
- Regularly check competitor amenities in Burgsvik to stay competitive.
Burgsvik Airbnb Guest Demographics & Profile Analysis (2026)
Guest Profile Summary for Burgsvik
- The typical guest profile for Airbnb in Burgsvik consists of primarily domestic travelers (96%), often arriving from nearby Stockholm, typically belonging to the Post-2000s (Gen Z/Alpha) group (50%), primarily speaking English or Swedish.
- Domestic travelers account for 95.8% of guests.
- Key international markets include Sweden (95.8%) and Germany (4.2%).
- Top languages spoken are English (40.9%) followed by Swedish (40.9%).
- A significant demographic segment is the Post-2000s (Gen Z/Alpha) group, representing 50% of guests.
Recommendations for Hosts
- Target domestic marketing efforts towards travelers from Stockholm and Västerås.
- Tailor amenities and listing descriptions to appeal to the dominant Post-2000s (Gen Z/Alpha) demographic (e.g., highlight fast WiFi, smart home features, local guides).
- Highlight unique local experiences or amenities relevant to the primary guest profile.
- Consider seasonal promotions aligned with peak travel times for key origin markets.
Nearby Short-Term Rental Market Comparison
How does the Burgsvik Airbnb market stack up against its neighbors? Compare key performance metrics like average monthly revenue, ADR, and occupancy rates in surrounding areas to understand the broader regional STR landscape.
| Market | Active Properties | Monthly Revenue | Daily Rate | Avg. Occupancy |
|---|---|---|---|---|
| Trosa kommun | 36 | $1,549 | $212.84 | 38% |
| Nynäshamns kommun | 40 | $1,438 | $242.06 | 37% |
| Oxelösunds kommun | 11 | $1,177 | $149.73 | 47% |
| Nyköpings kommun | 84 | $1,029 | $154.50 | 39% |
| Oxelösund | 15 | $1,026 | $166.80 | 33% |
| Visby | 474 | $984 | $198.19 | 46% |
| Ljugarn | 21 | $983 | $196.09 | 46% |
| Gotland Municipality | 569 | $911 | $168.39 | 44% |
| Sandhamn | 28 | $903 | $218.85 | 45% |
| Norra Visby | 20 | $875 | $185.36 | 53% |