Bjärred Airbnb Market Analysis 2026: Short Term Rental Data & Vacation Rental Statistics in Skåne County, Sweden
Is Airbnb profitable in Bjärred in 2026? Explore comprehensive Airbnb analytics for Bjärred, Skåne County, Sweden to uncover income potential. This 2026 STR market report for Bjärred, based on AirROI data from August 2024 to July 2025, reveals key trends in the niche market of 18 active listings.
Whether you're considering an Airbnb investment in Bjärred, optimizing your existing vacation rental, or exploring rental arbitrage opportunities, understanding the Bjärred Airbnb data is crucial. Leveraging the low regulation environment is key to maximizing your short term rental income potential. Let's dive into the specifics.
Key Bjärred Airbnb Performance Metrics Overview
Monthly Airbnb Revenue Variations & Income Potential in Bjärred (2026)
Understanding the monthly revenue variations for Airbnb listings in Bjärred is key to maximizing your short term rental income potential. Seasonality significantly impacts earnings. Our analysis, based on data from the past 12 months, shows that the peak revenue month for STRs in Bjärred is typically August, while February often presents the lowest earnings, highlighting opportunities for strategic pricing adjustments during shoulder and low seasons. Explore the typical Airbnb income in Bjärred across different performance tiers:
- Best-in-class properties (Top 10%) achieve $6,038+ monthly, often utilizing dynamic pricing and superior guest experiences.
- Strong performing properties (Top 25%) earn $3,680 or more, indicating effective management and desirable locations/amenities.
- Typical properties (Median) generate around $1,899 per month, representing the average market performance.
- Entry-level properties (Bottom 25%) see earnings around $803, often with potential for optimization.
Average Monthly Airbnb Earnings Trend in Bjärred
Bjärred Airbnb Occupancy Rate Trends (2026)
Maximize your bookings by understanding the Bjärred STR occupancy trends. Seasonal demand shifts significantly influence how often properties are booked. Typically, Octobersees the highest demand (peak season occupancy), while February experiences the lowest (low season). Effective strategies, like adjusting minimum stays or offering promotions, can boost occupancy during slower periods. Here's how different property tiers perform in Bjärred:
- Best-in-class properties (Top 10%) achieve 79%+ occupancy, indicating high desirability and potentially optimized availability.
- Strong performing properties (Top 25%) maintain 61% or higher occupancy, suggesting good market fit and guest satisfaction.
- Typical properties (Median) have an occupancy rate around 33%.
- Entry-level properties (Bottom 25%) average 13% occupancy, potentially facing higher vacancy.
Average Monthly Occupancy Rate Trend in Bjärred
Average Daily Rate (ADR) Airbnb Trends in Bjärred (2026)
Effective short term rental pricing strategy in Bjärred involves understanding monthly ADR fluctuations. The Average Daily Rate (ADR) for Airbnb in Bjärred typically peaks in July and dips lowest during February. Leveraging Airbnb dynamic pricing tools or strategies based on this seasonality can significantly boost revenue. Here's a look at the typical nightly rates achieved:
- Best-in-class properties (Top 10%) command rates of $331+ per night, often due to premium features or locations.
- Strong performing properties (Top 25%) achieve nightly rates of $272 or more.
- Typical properties (Median) charge around $194 per night.
- Entry-level properties (Bottom 25%) earn around $133 per night.
Average Daily Rate (ADR) Trend by Month in Bjärred
Get Live Bjärred Market Intelligence 👇

Explore Real-time Analytics
Airbnb Seasonality Analysis & Trends in Bjärred (2025)
Peak Season (August, July, June)
- Revenue averages $3,928 per month
- Occupancy rates average 46.6%
- Daily rates average $223
Shoulder Season
- Revenue averages $2,671 per month
- Occupancy maintains around 42.1%
- Daily rates hold near $197
Low Season (February, March, April)
- Revenue drops to average $1,413 per month
- Occupancy decreases to average 29.4%
- Daily rates adjust to average $209
Seasonality Insights for Bjärred
- The Airbnb seasonality in Bjärred shows highly seasonal trends requiring careful strategy. While the sections above show seasonal averages, it's also insightful to look at the extremes:
- During the high season, the absolute peak month showcases Bjärred's highest earning potential, with monthly revenues capable of climbing to $4,016, occupancy reaching a high of 59.7%, and ADRs peaking at $240.
- Conversely, the slowest single month of the year, typically falling within the low season, marks the market's lowest point. In this month, revenue might dip to $761, occupancy could drop to 15.8%, and ADRs may adjust down to $185.
- Understanding both the seasonal averages and these monthly peaks and troughs in revenue, occupancy, and ADR is crucial for maximizing your Airbnb profit potential in Bjärred.
Seasonal Strategies for Maximizing Profit
- Peak Season: Maximize revenue through premium pricing and potentially longer minimum stays. Ensure high availability.
- Low Season: Offer competitive pricing, special promotions (e.g., extended stay discounts), and flexible cancellation policies. Target off-season travelers like remote workers or budget-conscious guests.
- Shoulder Seasons: Implement dynamic pricing that balances peak and low rates. Target weekend travelers or specific events. Offer slightly more flexible terms than peak season.
- Regularly analyze your own performance against these Bjärred seasonality benchmarks and adjust your pricing and availability strategy accordingly.
Best Areas for Airbnb Investment in Bjärred (2026)
Exploring the top neighborhoods for short-term rentals in Bjärred? This section highlights key areas, outlining why they are attractive for hosts and guests, along with notable local attractions. Consider these locations based on your target guest profile and investment strategy.
| Neighborhood / Area | Why Host Here? (Target Guests & Appeal) | Key Attractions & Landmarks |
|---|---|---|
| Bjärred Beach | A popular coastal area known for its beautiful beach and family-friendly atmosphere. Ideal for travelers seeking relaxation, swimming, and local seafood restaurants. | Bjärred Beach, Lund Marina, Bjärred's Coastal Park, Lund Botanical Gardens, The Kullaberg Nature Reserve |
| Bjärred Village | Charming village atmosphere with local shops, cafes, and close proximity to nature. Appeals to visitors looking for a quaint experience away from city life. | Bjärred Local Market, Café Mölle, Bjärred Church, Nature walks in nearby parks, Local art galleries |
| Lund | Nearby university city known for its historical architecture and vibrant student life. Attracts visitors for cultural experiences and academic-related stays. | Lund Cathedral, Lund University, Kulturen Open-Air Museum, Botanical Gardens, Lund Observatory |
| Skåneleden Trail | A scenic trail perfect for outdoor enthusiasts, offering hiking and nature experiences throughout the beautiful landscapes of Skåne. Great for eco-tourism. | Skåneleden Trail, Nature reserves, Hiking paths, Bjärred’s Nature Reserve, Wildlife spotting |
| Bjärred Marina | A picturesque marina area offering stunning views of the Öresund Strait and opportunities for sailing and water sports. Appeals to those interested in aquatic activities. | Bjärred Marina, Sailing excursions, Fishing spots, Waterfront dining, Picnic areas |
| Bjärred Golf Club | A popular destination for golf enthusiasts, featuring a well-maintained course and stunning views. Attracts golfers year-round and holiday visitors looking to relax. | Bjärred Golf Club, Driving range, Golf tournaments, Nature views, Clubhouse dining |
| Öresund Bridge Viewpoint | An iconic landmark offering breathtaking views of the bridge connecting Sweden and Denmark; a perfect spot for sightseeing and photography. | Öresund Bridge, Scenic viewpoints, Walking trails, Photography spots, Picnic areas |
| Local Festivals | Bjärred hosts several annual festivals that attract visitors for local culture, food, and entertainment. Ideal for those looking for local experiences and community events. | Bjärred Summer Festival, Local food markets, Cultural events, Artisan fairs, Live music performances |
Understanding Airbnb License Requirements & STR Laws in Bjärred (2026)
While Bjärred, Skåne County, Sweden currently shows low STR regulations, specific Airbnb license requirements might still exist or change. Always verify the latest short term rental regulations and Airbnb license requirements directly with local government authorities for Bjärred to ensure full compliance before hosting.
(Source: AirROI data, 2026, finding no licensed listings among those analyzed)
Top Performing Airbnb Properties in Bjärred (2026)
Benchmark your potential! Explore examples of top-performing Airbnb properties in Bjärredbased on Trailing Twelve Month (TTM) revenue. Analyze their characteristics, revenue, occupancy rate, and ADR to understand what drives success in this market.
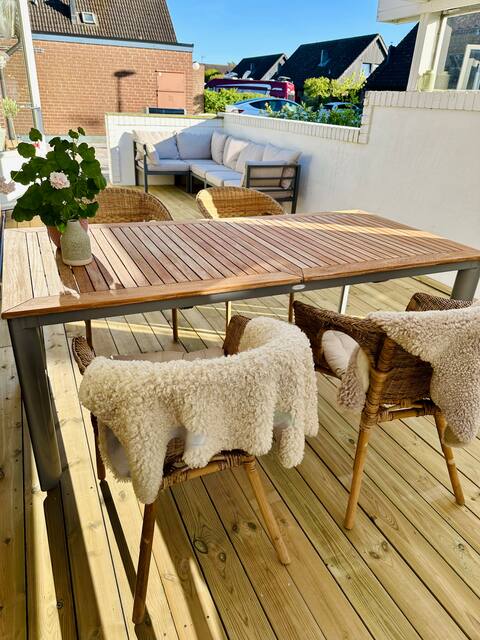
Large, beachfront villa in calm area: 8+ beds
Entire Place • 4 bedrooms
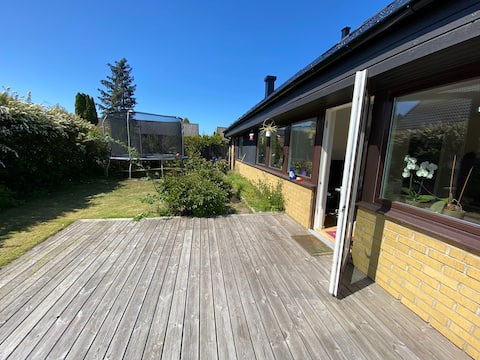
Charming Villa near the beach–Perfect for Families
Entire Place • 4 bedrooms

Radhuset
Entire Place • 4 bedrooms

Comfortable & spacious modern villa with pool
Entire Place • 3 bedrooms
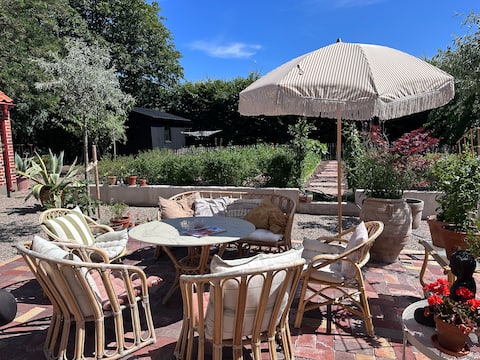
Villa Solvik, proximity to beach and restaurants
Entire Place • 3 bedrooms
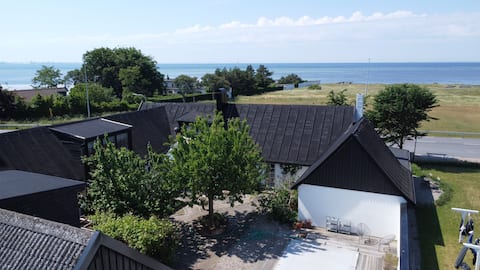
Bjerred B&B Ladan
Entire Place • 1 bedroom
Note: Performance varies based on location, size, amenities, seasonality, and management quality. Data reflects the past 12 months.
Top Performing Airbnb Hosts in Bjärred (2026)
Learn from the best! This table showcases top-performing Airbnb hosts in Bjärred based on the number of properties managed and estimated total revenue over the past year. Analyze their scale and performance metrics.
| Host Name | Properties | Grossing Revenue | Stay Reviews | Avg Rating |
|---|---|---|---|---|
| Peter | 5 | $61,197 | 45 | 4.96/5.0 |
| Tea-Louice | 1 | $54,464 | 9 | 5.00/5.0 |
| Mercedes | 1 | $48,383 | 21 | 4.90/5.0 |
| Magnus | 1 | $32,917 | 10 | 5.00/5.0 |
| Maja | 1 | $28,077 | 6 | 5.00/5.0 |
| Caroline | 1 | $22,927 | 3 | 5.00/5.0 |
| Anna | 1 | $13,518 | 53 | 4.96/5.0 |
| Therese | 1 | $12,942 | 9 | 5.00/5.0 |
| Mattias | 1 | $11,562 | 8 | 5.00/5.0 |
| Madeleine | 1 | $6,824 | 40 | 4.83/5.0 |
Analyzing the strategies of top hosts, such as their property selection, pricing, and guest communication, can offer valuable lessons for optimizing your own Airbnb operations in Bjärred.
Dive Deeper: Advanced Bjärred STR Market Data (2026)
Ready to unlock more insights? AirROI provides access to advanced metrics and comprehensive Airbnb data for Bjärred. Explore detailed analytics beyond this report to refine your investment strategy, optimize pricing, and maximize your vacation rental profits.
Explore Advanced MetricsBjärred Short-Term Rental Market Composition (2026): Property & Room Types
Room Type Distribution
Property Type Distribution
Market Composition Insights for Bjärred
- The Bjärred Airbnb market composition is heavily skewed towards Entire Home/Apt listings, which make up 88.9% of the 18 active rentals. This indicates strong guest preference for privacy and space.
- Looking at the property type distribution in Bjärred, House properties are the most common (61.1%), reflecting the local real estate landscape.
- Houses represent a significant 61.1% portion, catering likely to families or larger groups.
- The presence of 11.1% Hotel/Boutique listings indicates integration with traditional hospitality.
Bjärred Airbnb Room Capacity Analysis (2026): Bedroom Distribution
Distribution of Listings by Number of Bedrooms
Room Capacity Insights for Bjärred
- The dominant room capacity in Bjärred is 4 bedrooms listings, making up 27.8% of the market. This suggests a strong demand for properties suitable for families or small groups.
- Together, 4 bedrooms and 3 bedrooms properties represent 55.6% of the active Airbnb listings in Bjärred, indicating a high concentration in these sizes.
- A significant 61.2% of listings offer 3+ bedrooms, catering to larger groups and families seeking more space in Bjärred.
Bjärred Vacation Rental Guest Capacity Trends (2026)
Distribution of Listings by Guest Capacity
Guest Capacity Insights for Bjärred
- The most common guest capacity trend in Bjärred vacation rentals is listings accommodating 6 guests (27.8%). This suggests the primary traveler segment is likely larger groups.
- Properties designed for 6 guests and 5 guests dominate the Bjärred STR market, accounting for 50.0% of listings.
- 44.5% of properties accommodate 6+ guests, serving the market segment for larger families or group travel in Bjärred.
- On average, properties in Bjärred are equipped to host 5.0 guests.
Bjärred Airbnb Booking Patterns (2026): Available vs. Booked Days
Available Days Distribution
Booked Days Distribution
Booking Pattern Insights for Bjärred
- The most common availability pattern in Bjärred falls within the 271-366 days range, representing 72.2% of listings. This suggests many properties have significant open periods on their calendars.
- Approximately 83.3% of listings show high availability (181+ days open annually), indicating potential for increased bookings or specific owner usage patterns.
- For booked days, the 31-90 days range is most frequent in Bjärred (50%), reflecting common guest stay durations or potential owner blocking patterns.
- A notable 16.7% of properties secure long booking periods (181+ days booked per year), highlighting successful long-term rental strategies or significant owner usage.
Bjärred Airbnb Minimum Stay Requirements Analysis
Distribution of Listings by Minimum Night Requirement
1 Night
7 listings
38.9% of total
2 Nights
2 listings
11.1% of total
3 Nights
2 listings
11.1% of total
4-6 Nights
4 listings
22.2% of total
7-29 Nights
1 listings
5.6% of total
30+ Nights
2 listings
11.1% of total
Key Insights
- The most prevalent minimum stay requirement in Bjärred is 1 Night, adopted by 38.9% of listings. This highlights the market's preference for shorter, flexible bookings.
- A significant segment (11.1%) caters to monthly stays (30+ nights) in Bjärred, pointing to opportunities in the extended-stay market.
Recommendations
- Align with the market by considering a 1 Night minimum stay, as 38.9% of Bjärred hosts use this setting.
- Explore offering discounts for stays of 30+ nights to attract the 11.1% of the market seeking extended stays.
- Adjust minimum nights based on seasonality – potentially shorter during low season and longer during peak demand periods in Bjärred.
Bjärred Airbnb Cancellation Policy Trends Analysis (2026)
Flexible
5 listings
29.4% of total
Moderate
3 listings
17.6% of total
Firm
9 listings
52.9% of total
Cancellation Policy Insights for Bjärred
- The prevailing Airbnb cancellation policy trend in Bjärred is Firm, used by 52.9% of listings.
- A majority (52.9%) of hosts in Bjärred utilize Firm or Strict policies, indicating a market where hosts prioritize booking security.
Recommendations for Hosts
- Consider adopting a Firm policy to align with the 52.9% market standard in Bjärred.
- Regularly review your cancellation policy against competitors and market demand shifts in Bjärred.
Bjärred STR Booking Lead Time Analysis (2026)
Average Booking Lead Time by Month
Booking Lead Time Insights for Bjärred
- The overall average booking lead time for vacation rentals in Bjärred is 59 days.
- Guests book furthest in advance for stays during July (average 124 days), likely coinciding with peak travel demand or local events.
- The shortest booking windows occur for stays in October (average 17 days), indicating more last-minute travel plans during this time.
- Seasonally, Summer (88 days avg.) sees the longest lead times, while Winter (31 days avg.) has the shortest, reflecting typical travel planning cycles.
Recommendations for Hosts
- Use the overall average lead time (59 days) as a baseline for your pricing and availability strategy in Bjärred.
- For July stays, consider implementing length-of-stay discounts or slightly higher rates for bookings made less than 124 days out to capitalize on advance planning.
- Target marketing efforts for the Summer season well in advance (at least 88 days) to capture early planners.
- Monitor your own booking lead times against these Bjärred averages to identify opportunities for dynamic pricing adjustments.
Popular & Essential Airbnb Amenities in Bjärred (2026)
Amenity Prevalence
Amenity Insights for Bjärred
- Popular amenities like Smoke alarm, Free parking on premises, Wifi are common but not universal. Offering these can provide a competitive edge.
- Warning: Wifi is not universally provided but is considered essential globally. Ensure reliable Wifi is offered.
Recommendations for Hosts
- Consider adding popular differentiators like Smoke alarm or Free parking on premises to increase appeal.
- Highlight unique or less common amenities you offer (e.g., hot tub, dedicated workspace, EV charger) in your listing description and photos.
- Regularly check competitor amenities in Bjärred to stay competitive.
Bjärred Airbnb Guest Demographics & Profile Analysis (2026)
Guest Profile Summary for Bjärred
- The typical guest profile for Airbnb in Bjärred consists of predominantly international visitors (80%), with top international origins including Sweden, typically belonging to the Post-2000s (Gen Z/Alpha) group (50%), primarily speaking English or German.
- Domestic travelers account for 20.5% of guests.
- Key international markets include Germany (35.9%) and Sweden (20.5%).
- Top languages spoken are English (42.3%) followed by German (28.8%).
- A significant demographic segment is the Post-2000s (Gen Z/Alpha) group, representing 50% of guests.
Recommendations for Hosts
- Focus marketing internationally, particularly towards travelers from Sweden.
- Tailor amenities and listing descriptions to appeal to the dominant Post-2000s (Gen Z/Alpha) demographic (e.g., highlight fast WiFi, smart home features, local guides).
- Highlight unique local experiences or amenities relevant to the primary guest profile.
- Consider seasonal promotions aligned with peak travel times for key origin markets.
Nearby Short-Term Rental Market Comparison
How does the Bjärred Airbnb market stack up against its neighbors? Compare key performance metrics like average monthly revenue, ADR, and occupancy rates in surrounding areas to understand the broader regional STR landscape.
| Market | Active Properties | Monthly Revenue | Daily Rate | Avg. Occupancy |
|---|---|---|---|---|
| Råbylille Strand | 33 | $2,030 | $205.88 | 42% |
| Copenhagen | 10,190 | $1,963 | $203.63 | 49% |
| Skovshoved | 46 | $1,844 | $306.64 | 41% |
| Vellinge | 17 | $1,753 | $177.39 | 45% |
| Frederiksberg | 1,170 | $1,745 | $201.86 | 48% |
| Perstorps kommun | 15 | $1,719 | $151.74 | 48% |
| Östra Göinge kommun | 10 | $1,647 | $202.47 | 44% |
| Greve Strand | 56 | $1,628 | $177.22 | 49% |
| Kastrup | 81 | $1,626 | $167.59 | 49% |
| Klausdorf | 17 | $1,612 | $138.95 | 47% |