Bleket Airbnb Market Analysis 2025: Short Term Rental Data & Vacation Rental Statistics in Västra Götaland County, Sweden
Is Airbnb profitable in Bleket in 2025? Explore comprehensive Airbnb analytics for Bleket, Västra Götaland County, Sweden to uncover income potential. This 2025 STR market report for Bleket, based on AirROI data from July 2024 to June 2025, reveals key trends in the niche market of 18 active listings.
Whether you're considering an Airbnb investment in Bleket, optimizing your existing vacation rental, or exploring rental arbitrage opportunities, understanding the Bleket Airbnb data is crucial. Leveraging the low regulation environment is key to maximizing your short term rental income potential. Let's dive into the specifics.
Key Bleket Airbnb Performance Metrics Overview
Monthly Airbnb Revenue Variations & Income Potential in Bleket (2025)
Understanding the monthly revenue variations for Airbnb listings in Bleket is key to maximizing your short term rental income potential. Seasonality significantly impacts earnings. Our analysis, based on data from the past 12 months, shows that the peak revenue month for STRs in Bleket is typically July, while November often presents the lowest earnings, highlighting opportunities for strategic pricing adjustments during shoulder and low seasons. Explore the typical Airbnb income in Bleket across different performance tiers:
- Best-in-class properties (Top 10%) achieve $4,895+ monthly, often utilizing dynamic pricing and superior guest experiences.
- Strong performing properties (Top 25%) earn $2,147 or more, indicating effective management and desirable locations/amenities.
- Typical properties (Median) generate around $1,121 per month, representing the average market performance.
- Entry-level properties (Bottom 25%) see earnings around $768, often with potential for optimization.
Average Monthly Airbnb Earnings Trend in Bleket
Bleket Airbnb Occupancy Rate Trends (2025)
Maximize your bookings by understanding the Bleket STR occupancy trends. Seasonal demand shifts significantly influence how often properties are booked. Typically, Julysees the highest demand (peak season occupancy), while May experiences the lowest (low season). Effective strategies, like adjusting minimum stays or offering promotions, can boost occupancy during slower periods. Here's how different property tiers perform in Bleket:
- Best-in-class properties (Top 10%) achieve 78%+ occupancy, indicating high desirability and potentially optimized availability.
- Strong performing properties (Top 25%) maintain 54% or higher occupancy, suggesting good market fit and guest satisfaction.
- Typical properties (Median) have an occupancy rate around 37%.
- Entry-level properties (Bottom 25%) average 25% occupancy, potentially facing higher vacancy.
Average Monthly Occupancy Rate Trend in Bleket
Average Daily Rate (ADR) Airbnb Trends in Bleket (2025)
Effective short term rental pricing strategy in Bleket involves understanding monthly ADR fluctuations. The Average Daily Rate (ADR) for Airbnb in Bleket typically peaks in June and dips lowest during November. Leveraging Airbnb dynamic pricing tools or strategies based on this seasonality can significantly boost revenue. Here's a look at the typical nightly rates achieved:
- Best-in-class properties (Top 10%) command rates of $284+ per night, often due to premium features or locations.
- Strong performing properties (Top 25%) achieve nightly rates of $202 or more.
- Typical properties (Median) charge around $132 per night.
- Entry-level properties (Bottom 25%) earn around $94 per night.
Average Daily Rate (ADR) Trend by Month in Bleket
Get Live Bleket Market Intelligence 👇
Explore Real-time Analytics
Airbnb Seasonality Analysis & Trends in Bleket (2025)
Peak Season (July, August, March)
- Revenue averages $3,143 per month
- Occupancy rates average 59.8%
- Daily rates average $162
Shoulder Season
- Revenue averages $1,560 per month
- Occupancy maintains around 37.8%
- Daily rates hold near $161
Low Season (May, November, December)
- Revenue drops to average $946 per month
- Occupancy decreases to average 25.7%
- Daily rates adjust to average $159
Seasonality Insights for Bleket
- The Airbnb seasonality in Bleket shows highly seasonal trends requiring careful strategy. While the sections above show seasonal averages, it's also insightful to look at the extremes:
- During the high season, the absolute peak month showcases Bleket's highest earning potential, with monthly revenues capable of climbing to $3,994, occupancy reaching a high of 76.1%, and ADRs peaking at $178.
- Conversely, the slowest single month of the year, typically falling within the low season, marks the market's lowest point. In this month, revenue might dip to $915, occupancy could drop to 22.6%, and ADRs may adjust down to $153.
- Understanding both the seasonal averages and these monthly peaks and troughs in revenue, occupancy, and ADR is crucial for maximizing your Airbnb profit potential in Bleket.
Seasonal Strategies for Maximizing Profit
- Peak Season: Maximize revenue through premium pricing and potentially longer minimum stays. Ensure high availability.
- Low Season: Offer competitive pricing, special promotions (e.g., extended stay discounts), and flexible cancellation policies. Target off-season travelers like remote workers or budget-conscious guests.
- Shoulder Seasons: Implement dynamic pricing that balances peak and low rates. Target weekend travelers or specific events. Offer slightly more flexible terms than peak season.
- Regularly analyze your own performance against these Bleket seasonality benchmarks and adjust your pricing and availability strategy accordingly.
Best Areas for Airbnb Investment in Bleket (2025)
Exploring the top neighborhoods for short-term rentals in Bleket? This section highlights key areas, outlining why they are attractive for hosts and guests, along with notable local attractions. Consider these locations based on your target guest profile and investment strategy.
| Neighborhood / Area | Why Host Here? (Target Guests & Appeal) | Key Attractions & Landmarks |
|---|---|---|
| Bleket Beach | A serene coastal area known for its beautiful beaches and outdoor activities. Ideal for families and travelers seeking relaxation and nature, with plenty of water activities. | Bleket Beach, Scenic hiking trails, Local seafood restaurants, Kayaking opportunities, Nature reserves |
| Tegneby | A quaint village that offers a glimpse into rural Swedish life. It is perfect for those looking to escape the hustle and bustle of city life, with charming landscapes and local culture. | Historical church, Local farms, Beautiful countryside, Cultural events, Artisan markets |
| Brastad | A picturesque area near the Bohuslän coast, known for its historic buildings and proximity to the sea. Popular with tourists exploring the region's natural beauty. | Brastad Marina, Hiking trails, Stunning coastal views, Nearby islands to explore, Local art galleries |
| Lysekil | A popular summer destination with a vibrant beach life and access to the stunning Gullmarsfjord. Attracts both nature enthusiasts and those looking for seaside leisure. | Lysekil Beach, Gullmarsfjord, Aquaria Water Museum, Stangehuvud Nature Reserve, Boat tours |
| Fjärås Bräcka | An elevated area known for its breathtaking views of the surrounding landscape and proximity to the Kungsbacka Fjord. Ideal for outdoor activities and nature lovers. | Hiking paths, Vistas overlooking the fjord, Historical sites, Camping areas, Bird watching |
| Sotenäs | A coastal region renowned for its spectacular scenery and beautiful archipelago. Perfect for adventure lovers and those seeking tranquility by the sea. | Skärhamn Art Gallery, Mollösund village, Swimming spots, Boat excursions, Fishing opportunities |
| Kungshamn | A charming seaside town with a rich maritime history and vibrant harbor life. Appeals to tourists interested in culture, history, and water activities. | Kungshamn harbor, Historic seaside buildings, Beaches, Restaurants with seafood dishes, Maritime museums |
| Grebbestad | A popular summer destination famous for its charming harbor and fresh seafood. Great for visitors seeking a lively atmosphere and beautiful coastal scenery. | Grebbestad Marina, Local seafood market, Beaches and boating, Fishing villages, Artisan shops |
Understanding Airbnb License Requirements & STR Laws in Bleket (2025)
While Bleket, Västra Götaland County, Sweden currently shows low STR regulations, specific Airbnb license requirements might still exist or change. Always verify the latest short term rental regulations and Airbnb license requirements directly with local government authorities for Bleket to ensure full compliance before hosting.
(Source: AirROI data, 2025, finding no licensed listings among those analyzed)
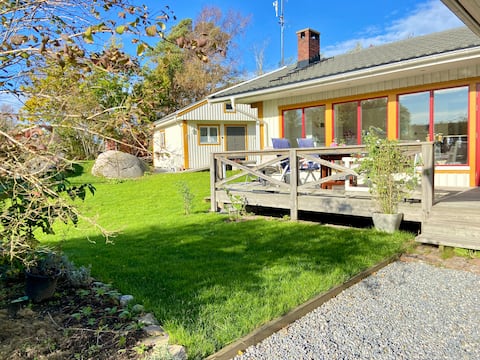
Top Performing Airbnb Properties in Bleket (2025)
Benchmark your potential! Explore examples of top-performing Airbnb properties in Bleketbased on Trailing Twelve Month (TTM) revenue. Analyze their characteristics, revenue, occupancy rate, and ADR to understand what drives success in this market.

Unique ocean villa by Klädesholmen
Entire Place • 2 bedrooms
Peaceful private location for the big company.
Entire Place • 4 bedrooms

Small cottage with sea view on Tjörn
Entire Place • 2 bedrooms

BOCKHOLMEN SEA LODGE
Entire Place • 2 bedrooms

Unique Archipelago House on Secluded Island – A Dream Vacation!
Entire Place • 4 bedrooms

Cozy house in Bleket on Tjörn
Entire Place • 2 bedrooms
Note: Performance varies based on location, size, amenities, seasonality, and management quality. Data reflects the past 12 months.
Top Performing Airbnb Hosts in Bleket (2025)
Learn from the best! This table showcases top-performing Airbnb hosts in Bleket based on the number of properties managed and estimated total revenue over the past year. Analyze their scale and performance metrics.
| Host Name | Properties | Grossing Revenue | Stay Reviews | Avg Rating |
|---|---|---|---|---|
| Lena | 2 | $44,869 | 7 | 5.00/5.0 |
| David | 1 | $40,285 | 20 | 4.95/5.0 |
| Åsa | 1 | $17,803 | 13 | 5.00/5.0 |
| Joakim | 1 | $16,743 | 5 | 5.00/5.0 |
| Carl-Olof | 1 | $14,261 | 68 | 4.90/5.0 |
| Christina | 1 | $12,651 | 17 | 5.00/5.0 |
| Jakob | 1 | $12,189 | 3 | 5.00/5.0 |
| Jesper | 1 | $11,507 | 3 | 5.00/5.0 |
| Helga Sofie | 1 | $10,107 | 54 | 4.87/5.0 |
| Margareta | 1 | $9,824 | 23 | 4.74/5.0 |
Analyzing the strategies of top hosts, such as their property selection, pricing, and guest communication, can offer valuable lessons for optimizing your own Airbnb operations in Bleket.
Dive Deeper: Advanced Bleket STR Market Data (2025)
Ready to unlock more insights? AirROI provides access to advanced metrics and comprehensive Airbnb data for Bleket. Explore detailed analytics beyond this report to refine your investment strategy, optimize pricing, and maximize your vacation rental profits.
Explore Advanced MetricsBleket Short-Term Rental Market Composition (2025): Property & Room Types
Room Type Distribution
Property Type Distribution
Market Composition Insights for Bleket
- The Bleket Airbnb market composition is heavily skewed towards Entire Home/Apt listings, which make up 100% of the 18 active rentals. This indicates strong guest preference for privacy and space.
- Looking at the property type distribution in Bleket, House properties are the most common (55.6%), reflecting the local real estate landscape.
- Houses represent a significant 55.6% portion, catering likely to families or larger groups.
- The presence of 5.6% Hotel/Boutique listings indicates integration with traditional hospitality.
Bleket Airbnb Room Capacity Analysis (2025): Bedroom Distribution
Distribution of Listings by Number of Bedrooms
Room Capacity Insights for Bleket
- The dominant room capacity in Bleket is 2 bedrooms listings, making up 33.3% of the market. This suggests a strong demand for properties suitable for couples or solo travelers.
- Together, 2 bedrooms and 4 bedrooms properties represent 55.5% of the active Airbnb listings in Bleket, indicating a high concentration in these sizes.
- A significant 44.5% of listings offer 3+ bedrooms, catering to larger groups and families seeking more space in Bleket.
Bleket Vacation Rental Guest Capacity Trends (2025)
Distribution of Listings by Guest Capacity
Guest Capacity Insights for Bleket
- The most common guest capacity trend in Bleket vacation rentals is listings accommodating 4 guests (33.3%). This suggests the primary traveler segment is likely small families or groups.
- Properties designed for 4 guests and 8+ guests dominate the Bleket STR market, accounting for 61.1% of listings.
- 44.5% of properties accommodate 6+ guests, serving the market segment for larger families or group travel in Bleket.
- On average, properties in Bleket are equipped to host 5.5 guests.
Bleket Airbnb Booking Patterns (2025): Available vs. Booked Days
Available Days Distribution
Booked Days Distribution
Booking Pattern Insights for Bleket
- The most common availability pattern in Bleket falls within the 271-366 days range, representing 66.7% of listings. This suggests many properties have significant open periods on their calendars.
- Approximately 88.9% of listings show high availability (181+ days open annually), indicating potential for increased bookings or specific owner usage patterns.
- For booked days, the 31-90 days range is most frequent in Bleket (50%), reflecting common guest stay durations or potential owner blocking patterns.
- A notable 11.1% of properties secure long booking periods (181+ days booked per year), highlighting successful long-term rental strategies or significant owner usage.
Bleket Airbnb Minimum Stay Requirements Analysis
Distribution of Listings by Minimum Night Requirement
1 Night
1 listings
6.3% of total
2 Nights
4 listings
25% of total
3 Nights
2 listings
12.5% of total
4-6 Nights
3 listings
18.8% of total
7-29 Nights
2 listings
12.5% of total
30+ Nights
4 listings
25% of total
Key Insights
- The most prevalent minimum stay requirement in Bleket is 2 Nights, adopted by 25% of listings. This highlights the market's preference for shorter, flexible bookings.
- A significant segment (25%) caters to monthly stays (30+ nights) in Bleket, pointing to opportunities in the extended-stay market.
Recommendations
- Align with the market by considering a 2 Nights minimum stay, as 25% of Bleket hosts use this setting.
- If feasible, allowing 1-night stays, especially midweek or during low season, could capture last-minute bookings, as only 6.3% currently do.
- Explore offering discounts for stays of 30+ nights to attract the 25% of the market seeking extended stays.
- Adjust minimum nights based on seasonality – potentially shorter during low season and longer during peak demand periods in Bleket.
Bleket Airbnb Cancellation Policy Trends Analysis (2025)
Limited
1 listings
6.3% of total
Flexible
4 listings
25% of total
Moderate
4 listings
25% of total
Firm
6 listings
37.5% of total
Strict
1 listings
6.3% of total
Cancellation Policy Insights for Bleket
- The prevailing Airbnb cancellation policy trend in Bleket is Firm, used by 37.5% of listings.
- There's a relatively balanced mix between guest-friendly (50.0%) and stricter (43.8%) policies, offering choices for different guest needs.
- Strict cancellation policies are quite rare (6.3%), potentially making listings with this policy less competitive unless justified by high demand or property type.
Recommendations for Hosts
- Consider adopting a Firm policy to align with the 37.5% market standard in Bleket.
- Using a Strict policy might deter some guests, as only 6.3% of listings use it. Evaluate if potential revenue protection outweighs possible lower booking rates.
- Regularly review your cancellation policy against competitors and market demand shifts in Bleket.
Bleket STR Booking Lead Time Analysis (2025)
Average Booking Lead Time by Month
Booking Lead Time Insights for Bleket
- The overall average booking lead time for vacation rentals in Bleket is 54 days.
- Guests book furthest in advance for stays during June (average 100 days), likely coinciding with peak travel demand or local events.
- The shortest booking windows occur for stays in February (average 7 days), indicating more last-minute travel plans during this time.
- Seasonally, Summer (74 days avg.) sees the longest lead times, while Fall (15 days avg.) has the shortest, reflecting typical travel planning cycles.
Recommendations for Hosts
- Use the overall average lead time (54 days) as a baseline for your pricing and availability strategy in Bleket.
- For June stays, consider implementing length-of-stay discounts or slightly higher rates for bookings made less than 100 days out to capitalize on advance planning.
- During February, focus on last-minute booking availability and promotions, as guests book with very short notice (7 days avg.).
- Target marketing efforts for the Summer season well in advance (at least 74 days) to capture early planners.
- Monitor your own booking lead times against these Bleket averages to identify opportunities for dynamic pricing adjustments.
Popular & Essential Airbnb Amenities in Bleket (2025)
Amenity data is currently unavailable for Bleket.
Bleket Airbnb Guest Demographics & Profile Analysis (2025)
Guest Profile Summary for Bleket
- The typical guest profile for Airbnb in Bleket consists of a mix of domestic (35%) and international guests, with top international origins including Germany, typically belonging to the Post-2000s (Gen Z/Alpha) group (50%), primarily speaking English or German.
- Domestic travelers account for 35.2% of guests.
- Key international markets include Sweden (35.2%) and Germany (26.8%).
- Top languages spoken are English (38.8%) followed by German (16.5%).
- A significant demographic segment is the Post-2000s (Gen Z/Alpha) group, representing 50% of guests.
Recommendations for Hosts
- Focus marketing internationally, particularly towards travelers from Germany.
- Tailor amenities and listing descriptions to appeal to the dominant Post-2000s (Gen Z/Alpha) demographic (e.g., highlight fast WiFi, smart home features, local guides).
- Highlight unique local experiences or amenities relevant to the primary guest profile.
- Consider seasonal promotions aligned with peak travel times for key origin markets.
Nearby Short-Term Rental Market Comparison
How does the Bleket Airbnb market stack up against its neighbors? Compare key performance metrics like average monthly revenue, ADR, and occupancy rates in surrounding areas to understand the broader regional STR landscape.
| Market | Active Properties | Monthly Revenue | Daily Rate | Avg. Occupancy |
|---|---|---|---|---|
| Lerums kommun | 37 | $1,985 | $260.54 | 42% |
| Starrkärr och Näs | 13 | $1,844 | $237.38 | 21% |
| Mölle | 43 | $1,616 | $185.84 | 40% |
| Udsholt | 87 | $1,566 | $210.49 | 37% |
| Alingsås kommun | 38 | $1,500 | $158.22 | 40% |
| Snekkersten | 26 | $1,475 | $232.83 | 45% |
| Onsala | 22 | $1,466 | $220.18 | 41% |
| Syddjurs Municipality | 424 | $1,434 | $231.67 | 38% |
| Trönningenäs | 19 | $1,434 | $258.36 | 42% |
| Borås kommun | 43 | $1,426 | $131.39 | 50% |