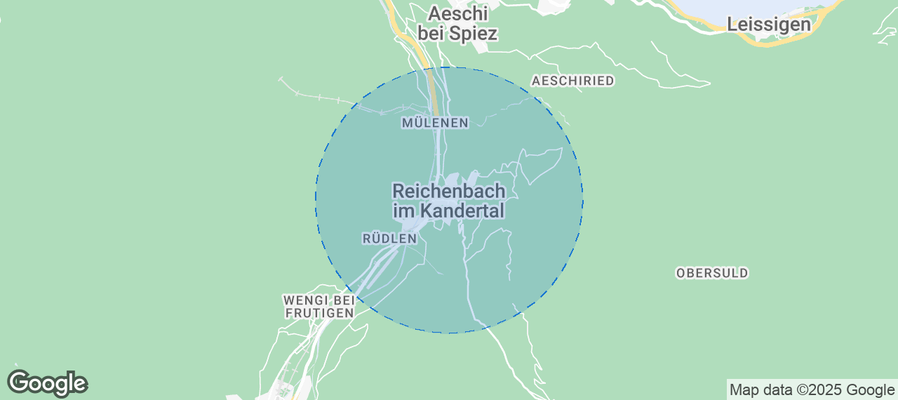
Reichenbach im Kandertal Airbnb Market Analysis 2026: Short Term Rental Data & Vacation Rental Statistics in Bern, Switzerland
Is Airbnb profitable in Reichenbach im Kandertal in 2026? Explore comprehensive Airbnb analytics for Reichenbach im Kandertal, Bern, Switzerland to uncover income potential. This 2026 STR market report for Reichenbach im Kandertal, based on AirROI data from February 2025 to January 2026, reveals key trends in the niche market of 49 active listings.
Whether you're considering an Airbnb investment in Reichenbach im Kandertal, optimizing your existing vacation rental, or exploring rental arbitrage opportunities, understanding the Reichenbach im Kandertal Airbnb data is crucial. Leveraging the low regulation environment is key to maximizing your short term rental income potential. Let's dive into the specifics.
Key Reichenbach im Kandertal Airbnb Performance Metrics Overview
Monthly Airbnb Revenue Variations & Income Potential in Reichenbach im Kandertal (2026)
Understanding the monthly revenue variations for Airbnb listings in Reichenbach im Kandertal is key to maximizing your short term rental income potential. Seasonality significantly impacts earnings. Our analysis, based on data from the past 12 months, shows that the peak revenue month for STRs in Reichenbach im Kandertal is typically August, while March often presents the lowest earnings, highlighting opportunities for strategic pricing adjustments during shoulder and low seasons. Explore the typical Airbnb income in Reichenbach im Kandertal across different performance tiers:
- Best-in-class properties (Top 10%) achieve $10,483+ monthly, often utilizing dynamic pricing and superior guest experiences.
- Strong performing properties (Top 25%) earn $4,368 or more, indicating effective management and desirable locations/amenities.
- Typical properties (Median) generate around $2,770 per month, representing the average market performance.
- Entry-level properties (Bottom 25%) see earnings around $1,883, often with potential for optimization.
Average Monthly Airbnb Earnings Trend in Reichenbach im Kandertal
Reichenbach im Kandertal Airbnb Occupancy Rate Trends (2026)
Maximize your bookings by understanding the Reichenbach im Kandertal STR occupancy trends. Seasonal demand shifts significantly influence how often properties are booked. Typically, Julysees the highest demand (peak season occupancy), while January experiences the lowest (low season). Effective strategies, like adjusting minimum stays or offering promotions, can boost occupancy during slower periods. Here's how different property tiers perform in Reichenbach im Kandertal:
- Best-in-class properties (Top 10%) achieve 88%+ occupancy, indicating high desirability and potentially optimized availability.
- Strong performing properties (Top 25%) maintain 77% or higher occupancy, suggesting good market fit and guest satisfaction.
- Typical properties (Median) have an occupancy rate around 63%.
- Entry-level properties (Bottom 25%) average 50% occupancy, potentially facing higher vacancy.
Average Monthly Occupancy Rate Trend in Reichenbach im Kandertal
Average Daily Rate (ADR) Airbnb Trends in Reichenbach im Kandertal (2026)
Effective short term rental pricing strategy in Reichenbach im Kandertal involves understanding monthly ADR fluctuations. The Average Daily Rate (ADR) for Airbnb in Reichenbach im Kandertal typically peaks in September and dips lowest during March. Leveraging Airbnb dynamic pricing tools or strategies based on this seasonality can significantly boost revenue. Here's a look at the typical nightly rates achieved:
- Best-in-class properties (Top 10%) command rates of $359+ per night, often due to premium features or locations.
- Strong performing properties (Top 25%) achieve nightly rates of $229 or more.
- Typical properties (Median) charge around $149 per night.
- Entry-level properties (Bottom 25%) earn around $120 per night.
Average Daily Rate (ADR) Trend by Month in Reichenbach im Kandertal
Get Live Reichenbach im Kandertal Market Intelligence 👇
Explore Real-time Analytics
Airbnb Seasonality Analysis & Trends in Reichenbach im Kandertal (2026)
Peak Season (August, July, June)
- Revenue averages $6,449 per month
- Occupancy rates average 85.8%
- Daily rates average $222
Shoulder Season
- Revenue averages $4,080 per month
- Occupancy maintains around 60.7%
- Daily rates hold near $201
Low Season (January, March, November)
- Revenue drops to average $2,640 per month
- Occupancy decreases to average 39.6%
- Daily rates adjust to average $196
Seasonality Insights for Reichenbach im Kandertal
- The Airbnb seasonality in Reichenbach im Kandertal shows highly seasonal trends requiring careful strategy. While the sections above show seasonal averages, it's also insightful to look at the extremes:
- During the high season, the absolute peak month showcases Reichenbach im Kandertal's highest earning potential, with monthly revenues capable of climbing to $6,797, occupancy reaching a high of 88.1%, and ADRs peaking at $233.
- Conversely, the slowest single month of the year, typically falling within the low season, marks the market's lowest point. In this month, revenue might dip to $2,558, occupancy could drop to 31.6%, and ADRs may adjust down to $170.
- Understanding both the seasonal averages and these monthly peaks and troughs in revenue, occupancy, and ADR is crucial for maximizing your Airbnb profit potential in Reichenbach im Kandertal.
Seasonal Strategies for Maximizing Profit
- Peak Season: Maximize revenue through premium pricing and potentially longer minimum stays. Ensure high availability.
- Low Season: Offer competitive pricing, special promotions (e.g., extended stay discounts), and flexible cancellation policies. Target off-season travelers like remote workers or budget-conscious guests.
- Shoulder Seasons: Implement dynamic pricing that balances peak and low rates. Target weekend travelers or specific events. Offer slightly more flexible terms than peak season.
- Regularly analyze your own performance against these Reichenbach im Kandertal seasonality benchmarks and adjust your pricing and availability strategy accordingly.
Best Areas for Airbnb Investment in Reichenbach im Kandertal (2026)
Exploring the top neighborhoods for short-term rentals in Reichenbach im Kandertal? This section highlights key areas, outlining why they are attractive for hosts and guests, along with notable local attractions. Consider these locations based on your target guest profile and investment strategy.
| Neighborhood / Area | Why Host Here? (Target Guests & Appeal) | Key Attractions & Landmarks |
|---|---|---|
| Reichenbach Centre | The heart of Reichenbach, with easy access to local shops, eateries, and amenities. Ideal for guests wanting to experience local culture and convenience. | Kandertal Museum, Local markets, Historic churches, Kander River promenade |
| Kandertal Valley | Scenic valley known for its stunning natural beauty and outdoor activities. Perfect for nature lovers and adventure seekers looking to explore the stunning Swiss landscape. | Hiking trails, Skiing in winter, Kandersteg, Local farms, Gorges of the Kandertal |
| Meiringen | Nearby town famous for its connection to Sherlock Holmes and beautiful natural scenery, providing a unique tourist experience. | Reichenbach Falls, Sherlock Holmes Museum, Adventure park., Local dining options, Attractive hiking routes |
| Hasliberg | A mountain resort area popular for skiing and summer tourism. Attracts visitors year-round for outdoor activities and relaxation. | Ski lifts, Summer hiking trails, Mountain lakes, Spas and wellness centers |
| Brienz | Picturesque lakeside village known for its woodcarving, offering a mix of nature and crafts. | Lake Brienz, Woodcarving workshops, Brienz Rothorn Mountain, Lütschine River |
| Gstaad | A luxury mountain resort destination attracting affluent clientele throughout the year. Offers upscale amenities and leisure activities. | Luxury shops, High-end dining, Ski resorts, Gstaad promenade, Beauvallon Spa |
| Interlaken | Popular tourist destination known for its outdoor activities and breathtaking scenery. High demand for accommodation from adventure seekers. | Jungfrau Region, Lake Thun, Adventure sports, Paragliding, Hiking tours |
| Thun | Historical town with charming old town center, situated by Lake Thun. Popular for weekend getaways and cultural experiences. | Thun Castle, Old Town, Lake Thun cruises, Thun Panorama, Local festivals |
Understanding Airbnb License Requirements & STR Laws in Reichenbach im Kandertal (2026)
While Reichenbach im Kandertal, Bern, Switzerland currently shows low STR regulations, specific Airbnb license requirements might still exist or change. Always verify the latest short term rental regulations and Airbnb license requirements directly with local government authorities for Reichenbach im Kandertal to ensure full compliance before hosting.
(Source: AirROI data, 2026, finding no licensed listings among those analyzed)
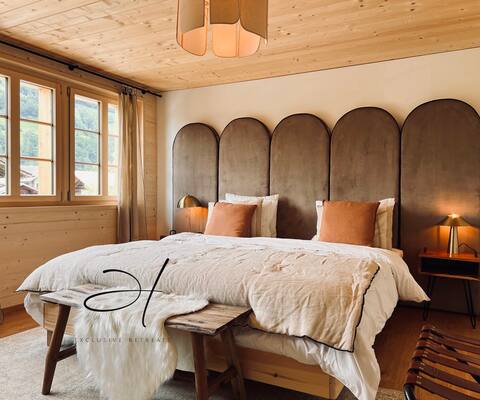
Top Performing Airbnb Properties in Reichenbach im Kandertal (2026)
Benchmark your potential! Explore examples of top-performing Airbnb properties in Reichenbach im Kandertalbased on Trailing Twelve Month (TTM) revenue. Analyze their characteristics, revenue, occupancy rate, and ADR to understand what drives success in this market.
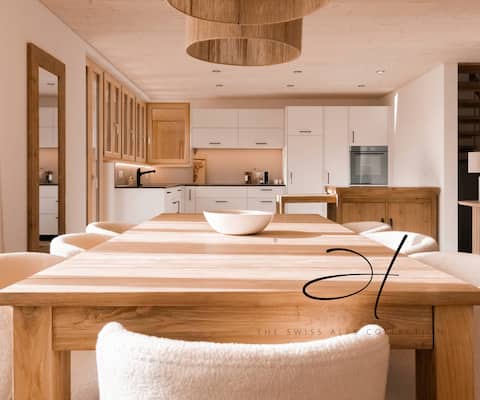
Hidden Retreats | The MountainHut
Entire Place • 5 bedrooms
Hidden Retreats | 1466 Edition
Entire Place • 3 bedrooms

Hidden Retreats | The Lohner
Entire Place • 3 bedrooms

Hidden Retreats | The Niesen
Entire Place • 2 bedrooms

Hidden Retreats | The Eiger
Entire Place • 2 bedrooms

"Ocean Breeze" Oasis to be 20 min to top sights
Entire Place • 3 bedrooms
Note: Performance varies based on location, size, amenities, seasonality, and management quality. Data reflects the past 12 months.
Top Performing Airbnb Hosts in Reichenbach im Kandertal (2026)
Learn from the best! This table showcases top-performing Airbnb hosts in Reichenbach im Kandertal based on the number of properties managed and estimated total revenue over the past year. Analyze their scale and performance metrics.
| Host Name | Properties | Grossing Revenue | Stay Reviews | Avg Rating |
|---|---|---|---|---|
| Hidden Retreats Switzerland | 5 | $933,620 | 522 | 4.93/5.0 |
| Sarah | 1 | $107,859 | 70 | 4.96/5.0 |
| Werner | 2 | $67,596 | 135 | 4.78/5.0 |
| Susanne | 1 | $64,029 | 77 | 4.97/5.0 |
| Montse | 2 | $60,673 | 84 | 4.89/5.0 |
| Erich | 1 | $59,577 | 107 | 4.93/5.0 |
| Astrid | 2 | $57,765 | 209 | 4.93/5.0 |
| Raendy Kevin | 1 | $55,223 | 47 | 4.89/5.0 |
| Michael - Immohost | 1 | $54,869 | 68 | 4.75/5.0 |
| Silvia | 2 | $53,254 | 183 | 4.96/5.0 |
Analyzing the strategies of top hosts, such as their property selection, pricing, and guest communication, can offer valuable lessons for optimizing your own Airbnb operations in Reichenbach im Kandertal.
Dive Deeper: Advanced Reichenbach im Kandertal STR Market Data (2026)
Ready to unlock more insights? AirROI provides access to advanced metrics and comprehensive Airbnb data for Reichenbach im Kandertal. Explore detailed analytics beyond this report to refine your investment strategy, optimize pricing, and maximize your vacation rental profits.
Explore Advanced MetricsReichenbach im Kandertal Short-Term Rental Market Composition (2026): Property & Room Types
Room Type Distribution
Property Type Distribution
Market Composition Insights for Reichenbach im Kandertal
- The Reichenbach im Kandertal Airbnb market composition is heavily skewed towards Entire Home/Apt listings, which make up 93.9% of the 49 active rentals. This indicates strong guest preference for privacy and space.
- Looking at the property type distribution in Reichenbach im Kandertal, Apartment/Condo properties are the most common (67.3%), reflecting the local real estate landscape.
- Houses represent a significant 24.5% portion, catering likely to families or larger groups.
- Smaller segments like hotel/boutique, outdoor/unique (combined 8.2%) offer potential for unique stay experiences.
Reichenbach im Kandertal Airbnb Room Capacity Analysis (2026): Bedroom Distribution
Distribution of Listings by Number of Bedrooms
Room Capacity Insights for Reichenbach im Kandertal
- The dominant room capacity in Reichenbach im Kandertal is 1 bedroom listings, making up 36.7% of the market. This suggests a strong demand for properties suitable for couples or solo travelers.
- Together, 1 bedroom and 2 bedrooms properties represent 71.4% of the active Airbnb listings in Reichenbach im Kandertal, indicating a high concentration in these sizes.
Reichenbach im Kandertal Vacation Rental Guest Capacity Trends (2026)
Distribution of Listings by Guest Capacity
Guest Capacity Insights for Reichenbach im Kandertal
- The most common guest capacity trend in Reichenbach im Kandertal vacation rentals is listings accommodating 4 guests (28.6%). This suggests the primary traveler segment is likely small families or groups.
- Properties designed for 4 guests and 2 guests dominate the Reichenbach im Kandertal STR market, accounting for 51.0% of listings.
- 28.6% of properties accommodate 6+ guests, serving the market segment for larger families or group travel in Reichenbach im Kandertal.
- On average, properties in Reichenbach im Kandertal are equipped to host 4.1 guests.
Reichenbach im Kandertal Airbnb Booking Patterns (2026): Available vs. Booked Days
Available Days Distribution
Booked Days Distribution
Booking Pattern Insights for Reichenbach im Kandertal
- The most common availability pattern in Reichenbach im Kandertal falls within the 91-180 days range, representing 49% of listings. This suggests many properties have significant open periods on their calendars.
- Approximately 32.6% of listings show high availability (181+ days open annually), indicating potential for increased bookings or specific owner usage patterns.
- For booked days, the 181-270 days range is most frequent in Reichenbach im Kandertal (49%), reflecting common guest stay durations or potential owner blocking patterns.
- A notable 67.4% of properties secure long booking periods (181+ days booked per year), highlighting successful long-term rental strategies or significant owner usage.
Reichenbach im Kandertal Airbnb Minimum Stay Requirements Analysis
Distribution of Listings by Minimum Night Requirement
1 Night
4 listings
8.2% of total
2 Nights
7 listings
14.3% of total
3 Nights
4 listings
8.2% of total
4-6 Nights
7 listings
14.3% of total
7-29 Nights
1 listings
2% of total
30+ Nights
26 listings
53.1% of total
Key Insights
- The most prevalent minimum stay requirement in Reichenbach im Kandertal is 30+ Nights, adopted by 53.1% of listings. This highlights the market's preference for longer commitments.
- A significant segment (53.1%) caters to monthly stays (30+ nights) in Reichenbach im Kandertal, pointing to opportunities in the extended-stay market.
Recommendations
- Align with the market by considering a 30+ Nights minimum stay, as 53.1% of Reichenbach im Kandertal hosts use this setting.
- If feasible, allowing 1-night stays, especially midweek or during low season, could capture last-minute bookings, as only 8.2% currently do.
- Explore offering discounts for stays of 30+ nights to attract the 53.1% of the market seeking extended stays.
- Adjust minimum nights based on seasonality – potentially shorter during low season and longer during peak demand periods in Reichenbach im Kandertal.
Reichenbach im Kandertal Airbnb Cancellation Policy Trends Analysis (2026)
Super Strict 30 Days
1 listings
2% of total
Flexible
10 listings
20.4% of total
Moderate
15 listings
30.6% of total
Firm
22 listings
44.9% of total
Strict
1 listings
2% of total
Cancellation Policy Insights for Reichenbach im Kandertal
- The prevailing Airbnb cancellation policy trend in Reichenbach im Kandertal is Firm, used by 44.9% of listings.
- There's a relatively balanced mix between guest-friendly (51.0%) and stricter (46.9%) policies, offering choices for different guest needs.
- Strict cancellation policies are quite rare (2%), potentially making listings with this policy less competitive unless justified by high demand or property type.
Recommendations for Hosts
- Consider adopting a Firm policy to align with the 44.9% market standard in Reichenbach im Kandertal.
- Using a Strict policy might deter some guests, as only 2% of listings use it. Evaluate if potential revenue protection outweighs possible lower booking rates.
- Regularly review your cancellation policy against competitors and market demand shifts in Reichenbach im Kandertal.
Reichenbach im Kandertal STR Booking Lead Time Analysis (2026)
Average Booking Lead Time by Month
Booking Lead Time Insights for Reichenbach im Kandertal
- The overall average booking lead time for vacation rentals in Reichenbach im Kandertal is 82 days.
- Guests book furthest in advance for stays during August (average 133 days), likely coinciding with peak travel demand or local events.
- The shortest booking windows occur for stays in February (average 48 days), indicating more last-minute travel plans during this time.
- Seasonally, Summer (120 days avg.) sees the longest lead times, while Fall (60 days avg.) has the shortest, reflecting typical travel planning cycles.
Recommendations for Hosts
- Use the overall average lead time (82 days) as a baseline for your pricing and availability strategy in Reichenbach im Kandertal.
- For August stays, consider implementing length-of-stay discounts or slightly higher rates for bookings made less than 133 days out to capitalize on advance planning.
- Target marketing efforts for the Summer season well in advance (at least 120 days) to capture early planners.
- Monitor your own booking lead times against these Reichenbach im Kandertal averages to identify opportunities for dynamic pricing adjustments.
Popular & Essential Airbnb Amenities in Reichenbach im Kandertal (2026)
Amenity Prevalence
Amenity Insights for Reichenbach im Kandertal
- Essential amenities in Reichenbach im Kandertal that guests expect include: Free parking on premises, Wifi, Heating. Lacking these (any) could significantly impact bookings.
- Popular amenities like Kitchen, Dishes and silverware, Refrigerator are common but not universal. Offering these can provide a competitive edge.
Recommendations for Hosts
- Ensure your listing includes all essential amenities for Reichenbach im Kandertal: Free parking on premises, Wifi, Heating.
- Prioritize adding missing essentials: Heating.
- Consider adding popular differentiators like Kitchen or Dishes and silverware to increase appeal.
- Highlight unique or less common amenities you offer (e.g., hot tub, dedicated workspace, EV charger) in your listing description and photos.
- Regularly check competitor amenities in Reichenbach im Kandertal to stay competitive.
Reichenbach im Kandertal Airbnb Guest Demographics & Profile Analysis (2026)
Guest Profile Summary for Reichenbach im Kandertal
- The typical guest profile for Airbnb in Reichenbach im Kandertal consists of predominantly international visitors (89%), with top international origins including France, typically belonging to the Post-2000s (Gen Z/Alpha) group (50%), primarily speaking English or French.
- Domestic travelers account for 10.6% of guests.
- Key international markets include United States (17.2%) and France (11.2%).
- Top languages spoken are English (41.7%) followed by French (12.3%).
- A significant demographic segment is the Post-2000s (Gen Z/Alpha) group, representing 50% of guests.
Recommendations for Hosts
- Focus marketing internationally, particularly towards travelers from France.
- Tailor amenities and listing descriptions to appeal to the dominant Post-2000s (Gen Z/Alpha) demographic (e.g., highlight fast WiFi, smart home features, local guides).
- Highlight unique local experiences or amenities relevant to the primary guest profile.
- Consider seasonal promotions aligned with peak travel times for key origin markets.
Nearby Short-Term Rental Market Comparison
How does the Reichenbach im Kandertal Airbnb market stack up against its neighbors? Compare key performance metrics like average monthly revenue, ADR, and occupancy rates in surrounding areas to understand the broader regional STR landscape.
| Market | Active Properties | Monthly Revenue | Daily Rate | Avg. Occupancy |
|---|---|---|---|---|
| Brienzwiler | 11 | $7,335 | $514.27 | 60% |
| Niederried bei Interlaken | 19 | $6,267 | $552.03 | 44% |
| Lauterbrunnen | 552 | $6,108 | $487.83 | 51% |
| Ranco | 12 | $5,691 | $536.46 | 42% |
| Matten bei Interlaken | 64 | $5,607 | $336.51 | 59% |
| Grindelwald | 513 | $5,587 | $396.62 | 56% |
| Les Clefs | 34 | $5,585 | $314.08 | 47% |
| Bassersdorf | 16 | $5,337 | $431.59 | 46% |
| Wengen | 12 | $5,115 | $595.38 | 46% |
| Oberhofen am Thunersee | 25 | $5,051 | $329.28 | 51% |