Schwanden bei Brienz Airbnb Market Analysis 2026: Short Term Rental Data & Vacation Rental Statistics in Bern, Switzerland
Is Airbnb profitable in Schwanden bei Brienz in 2026? Explore comprehensive Airbnb analytics for Schwanden bei Brienz, Bern, Switzerland to uncover income potential. This 2026 STR market report for Schwanden bei Brienz, based on AirROI data from February 2025 to January 2026, reveals key trends in the niche market of 21 active listings.
Whether you're considering an Airbnb investment in Schwanden bei Brienz, optimizing your existing vacation rental, or exploring rental arbitrage opportunities, understanding the Schwanden bei Brienz Airbnb data is crucial. Leveraging the low regulation environment is key to maximizing your short term rental income potential. Let's dive into the specifics.
Key Schwanden bei Brienz Airbnb Performance Metrics Overview
Monthly Airbnb Revenue Variations & Income Potential in Schwanden bei Brienz (2026)
Understanding the monthly revenue variations for Airbnb listings in Schwanden bei Brienz is key to maximizing your short term rental income potential. Seasonality significantly impacts earnings. Our analysis, based on data from the past 12 months, shows that the peak revenue month for STRs in Schwanden bei Brienz is typically August, while January often presents the lowest earnings, highlighting opportunities for strategic pricing adjustments during shoulder and low seasons. Explore the typical Airbnb income in Schwanden bei Brienz across different performance tiers:
- Best-in-class properties (Top 10%) achieve $7,623+ monthly, often utilizing dynamic pricing and superior guest experiences.
- Strong performing properties (Top 25%) earn $6,169 or more, indicating effective management and desirable locations/amenities.
- Typical properties (Median) generate around $4,256 per month, representing the average market performance.
- Entry-level properties (Bottom 25%) see earnings around $2,578, often with potential for optimization.
Average Monthly Airbnb Earnings Trend in Schwanden bei Brienz
Schwanden bei Brienz Airbnb Occupancy Rate Trends (2026)
Maximize your bookings by understanding the Schwanden bei Brienz STR occupancy trends. Seasonal demand shifts significantly influence how often properties are booked. Typically, Augustsees the highest demand (peak season occupancy), while January experiences the lowest (low season). Effective strategies, like adjusting minimum stays or offering promotions, can boost occupancy during slower periods. Here's how different property tiers perform in Schwanden bei Brienz:
- Best-in-class properties (Top 10%) achieve 89%+ occupancy, indicating high desirability and potentially optimized availability.
- Strong performing properties (Top 25%) maintain 77% or higher occupancy, suggesting good market fit and guest satisfaction.
- Typical properties (Median) have an occupancy rate around 61%.
- Entry-level properties (Bottom 25%) average 45% occupancy, potentially facing higher vacancy.
Average Monthly Occupancy Rate Trend in Schwanden bei Brienz
Average Daily Rate (ADR) Airbnb Trends in Schwanden bei Brienz (2026)
Effective short term rental pricing strategy in Schwanden bei Brienz involves understanding monthly ADR fluctuations. The Average Daily Rate (ADR) for Airbnb in Schwanden bei Brienz typically peaks in September and dips lowest during February. Leveraging Airbnb dynamic pricing tools or strategies based on this seasonality can significantly boost revenue. Here's a look at the typical nightly rates achieved:
- Best-in-class properties (Top 10%) command rates of $386+ per night, often due to premium features or locations.
- Strong performing properties (Top 25%) achieve nightly rates of $320 or more.
- Typical properties (Median) charge around $243 per night.
- Entry-level properties (Bottom 25%) earn around $157 per night.
Average Daily Rate (ADR) Trend by Month in Schwanden bei Brienz
Get Live Schwanden bei Brienz Market Intelligence 👇

Explore Real-time Analytics
Airbnb Seasonality Analysis & Trends in Schwanden bei Brienz (2026)
Peak Season (August, July, September)
- Revenue averages $6,839 per month
- Occupancy rates average 81.9%
- Daily rates average $284
Shoulder Season
- Revenue averages $4,447 per month
- Occupancy maintains around 61.4%
- Daily rates hold near $241
Low Season (January, March, November)
- Revenue drops to average $2,317 per month
- Occupancy decreases to average 35.7%
- Daily rates adjust to average $231
Seasonality Insights for Schwanden bei Brienz
- The Airbnb seasonality in Schwanden bei Brienz shows highly seasonal trends requiring careful strategy. While the sections above show seasonal averages, it's also insightful to look at the extremes:
- During the high season, the absolute peak month showcases Schwanden bei Brienz's highest earning potential, with monthly revenues capable of climbing to $7,121, occupancy reaching a high of 85.1%, and ADRs peaking at $291.
- Conversely, the slowest single month of the year, typically falling within the low season, marks the market's lowest point. In this month, revenue might dip to $1,986, occupancy could drop to 30.1%, and ADRs may adjust down to $214.
- Understanding both the seasonal averages and these monthly peaks and troughs in revenue, occupancy, and ADR is crucial for maximizing your Airbnb profit potential in Schwanden bei Brienz.
Seasonal Strategies for Maximizing Profit
- Peak Season: Maximize revenue through premium pricing and potentially longer minimum stays. Ensure high availability.
- Low Season: Offer competitive pricing, special promotions (e.g., extended stay discounts), and flexible cancellation policies. Target off-season travelers like remote workers or budget-conscious guests.
- Shoulder Seasons: Implement dynamic pricing that balances peak and low rates. Target weekend travelers or specific events. Offer slightly more flexible terms than peak season.
- Regularly analyze your own performance against these Schwanden bei Brienz seasonality benchmarks and adjust your pricing and availability strategy accordingly.
Best Areas for Airbnb Investment in Schwanden bei Brienz (2026)
Exploring the top neighborhoods for short-term rentals in Schwanden bei Brienz? This section highlights key areas, outlining why they are attractive for hosts and guests, along with notable local attractions. Consider these locations based on your target guest profile and investment strategy.
| Neighborhood / Area | Why Host Here? (Target Guests & Appeal) | Key Attractions & Landmarks |
|---|---|---|
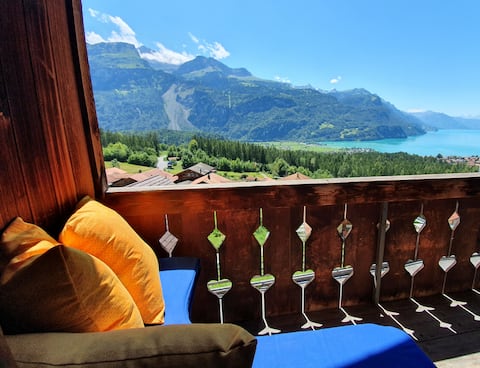
| Brienzersee | Beautiful lake area offering stunning views and numerous outdoor activities. Popular for swimming, hiking, and winter sports, making it a prime destination year-round. | Brienzersee, Lake Brienz cruises, Hiking trails, Water sports, Summer festivals |
| Schwanden village center | Charming village atmosphere with local shops and eateries. Attracts visitors looking for a cozy, authentic Swiss experience while being close to nature and adventure. | Local restaurants, Traditional Swiss architecture, Scenic walking trails, Local markets |
| Giessbach Falls | A breathtaking natural site with waterfalls and a historic hotel. It's a popular spot for tourists who enjoy nature and photography, perfect for Airbnb hosts. | Giessbach Falls, Viewpoints, Hiking trails, Boat tours on Lake Brienz |
| Brienz | A picturesque village known for its wood carving industry and access to multiple hiking paths. Ideal for visitors interested in culture and the outdoors. | Wood carving museums, Hiking paths, Scenic lake views, Cultural events |
| Hasliberg | Well-known mountain resort area that attracts winter sports enthusiasts and summer hikers. Great for year-round tourism, offering both sports and relaxation. | Ski resorts, Hiking paths, Mountain biking, Cable cars |
| Meiringen | Famous for the Reichenbach Falls and connections to Sherlock Holmes. Attracts tourists interested in history and scenic views. | Reichenbach Falls, Sherlock Holmes Museum, Hiking trails, Biking routes |
| Aare Gorge | A natural gorge with walking paths and stunning rock formations. It's a great attraction for tourists who enjoy unique geological formations and nature walks. | Aare Gorge walking paths, Scenic viewpoints, Guided tours |
| Sigriswil | A village providing stunning views of the lake and mountains, popular with hikers and those seeking tranquility away from the more popular tourist spots. | Panorama Bridge, Forest trails, Quiet retreat atmosphere |
Understanding Airbnb License Requirements & STR Laws in Schwanden bei Brienz (2026)
While Schwanden bei Brienz, Bern, Switzerland currently shows low STR regulations, specific Airbnb license requirements might still exist or change. Always verify the latest short term rental regulations and Airbnb license requirements directly with local government authorities for Schwanden bei Brienz to ensure full compliance before hosting.
(Source: AirROI data, 2026, finding no licensed listings among those analyzed)
Top Performing Airbnb Properties in Schwanden bei Brienz (2026)
Benchmark your potential! Explore examples of top-performing Airbnb properties in Schwanden bei Brienzbased on Trailing Twelve Month (TTM) revenue. Analyze their characteristics, revenue, occupancy rate, and ADR to understand what drives success in this market.
• Rose With A View • Free Parking & Lake View •
Entire Place • 1 bedroom
Lake View
Private Room • 3 bedrooms
Superior mountain and lake view
Entire Place • 2 bedrooms
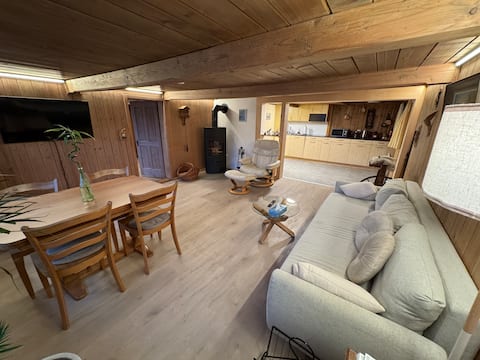
Helen's Appartment
Entire Place • 1 bedroom

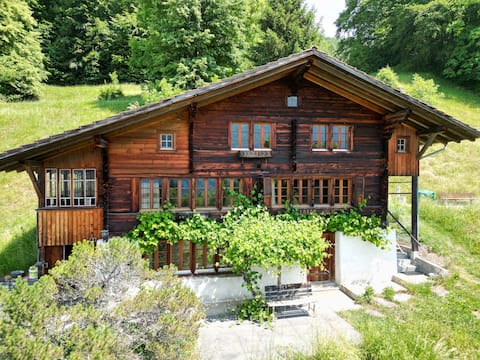
Idyllic house between Rothorn and Lake Brienz
Entire Place • 3 bedrooms

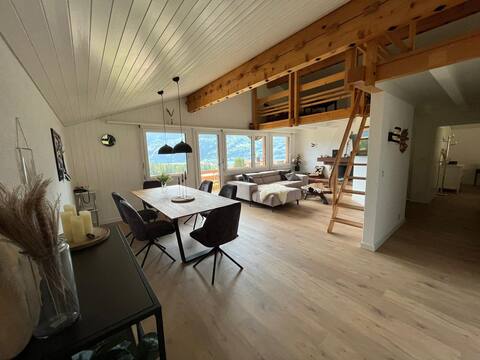
Spacious Chalet with a View
Entire Place • 3 bedrooms
Note: Performance varies based on location, size, amenities, seasonality, and management quality. Data reflects the past 12 months.
Top Performing Airbnb Hosts in Schwanden bei Brienz (2026)
Learn from the best! This table showcases top-performing Airbnb hosts in Schwanden bei Brienz based on the number of properties managed and estimated total revenue over the past year. Analyze their scale and performance metrics.
| Host Name | Properties | Grossing Revenue | Stay Reviews | Avg Rating |
|---|---|---|---|---|
| Anne-Sophie | 3 | $152,003 | 434 | 4.91/5.0 |
| Andreas | 2 | $148,766 | 40 | 5.00/5.0 |
| Marye | 3 | $91,782 | 730 | 4.92/5.0 |
| Tati | 1 | $71,325 | 48 | 5.00/5.0 |
| Vinzent | 1 | $68,877 | 72 | 4.92/5.0 |
| Dunja | 1 | $63,995 | 301 | 4.82/5.0 |
| Salome | 1 | $60,547 | 32 | 4.88/5.0 |
| Christin | 1 | $59,675 | 86 | 5.00/5.0 |
| Jolanda | 1 | $53,425 | 54 | 4.93/5.0 |
| Heidi | 1 | $50,565 | 500 | 4.96/5.0 |
Analyzing the strategies of top hosts, such as their property selection, pricing, and guest communication, can offer valuable lessons for optimizing your own Airbnb operations in Schwanden bei Brienz.
Dive Deeper: Advanced Schwanden bei Brienz STR Market Data (2026)
Ready to unlock more insights? AirROI provides access to advanced metrics and comprehensive Airbnb data for Schwanden bei Brienz. Explore detailed analytics beyond this report to refine your investment strategy, optimize pricing, and maximize your vacation rental profits.
Explore Advanced MetricsSchwanden bei Brienz Short-Term Rental Market Composition (2026): Property & Room Types
Room Type Distribution
Property Type Distribution
Market Composition Insights for Schwanden bei Brienz
- The Schwanden bei Brienz Airbnb market composition is heavily skewed towards Entire Home/Apt listings, which make up 95.2% of the 21 active rentals. This indicates strong guest preference for privacy and space.
- Looking at the property type distribution in Schwanden bei Brienz, Apartment/Condo properties are the most common (85.7%), reflecting the local real estate landscape.
Schwanden bei Brienz Airbnb Room Capacity Analysis (2026): Bedroom Distribution
Distribution of Listings by Number of Bedrooms
Room Capacity Insights for Schwanden bei Brienz
- The dominant room capacity in Schwanden bei Brienz is 1 bedroom listings, making up 57.1% of the market. This suggests a strong demand for properties suitable for couples or solo travelers.
- Together, 1 bedroom and 3 bedrooms properties represent 80.9% of the active Airbnb listings in Schwanden bei Brienz, indicating a high concentration in these sizes.
- With over half the market (57.1%) consisting of studios or 1-bedroom units, Schwanden bei Brienz is particularly well-suited for individuals or couples.
- A significant 23.8% of listings offer 3+ bedrooms, catering to larger groups and families seeking more space in Schwanden bei Brienz.
Schwanden bei Brienz Vacation Rental Guest Capacity Trends (2026)
Distribution of Listings by Guest Capacity
Guest Capacity Insights for Schwanden bei Brienz
- The most common guest capacity trend in Schwanden bei Brienz vacation rentals is listings accommodating 4 guests (38.1%). This suggests the primary traveler segment is likely small families or groups.
- Properties designed for 4 guests and 2 guests dominate the Schwanden bei Brienz STR market, accounting for 61.9% of listings.
- 19.1% of properties accommodate 6+ guests, serving the market segment for larger families or group travel in Schwanden bei Brienz.
- On average, properties in Schwanden bei Brienz are equipped to host 3.8 guests.
Schwanden bei Brienz Airbnb Booking Patterns (2026): Available vs. Booked Days
Available Days Distribution
Booked Days Distribution
Booking Pattern Insights for Schwanden bei Brienz
- The most common availability pattern in Schwanden bei Brienz falls within the 91-180 days range, representing 47.6% of listings. This suggests many properties have significant open periods on their calendars.
- Approximately 42.8% of listings show high availability (181+ days open annually), indicating potential for increased bookings or specific owner usage patterns.
- For booked days, the 181-270 days range is most frequent in Schwanden bei Brienz (42.9%), reflecting common guest stay durations or potential owner blocking patterns.
- A notable 57.2% of properties secure long booking periods (181+ days booked per year), highlighting successful long-term rental strategies or significant owner usage.
Schwanden bei Brienz Airbnb Minimum Stay Requirements Analysis
Distribution of Listings by Minimum Night Requirement
2 Nights
5 listings
23.8% of total
3 Nights
2 listings
9.5% of total
4-6 Nights
1 listings
4.8% of total
30+ Nights
13 listings
61.9% of total
Key Insights
- The most prevalent minimum stay requirement in Schwanden bei Brienz is 30+ Nights, adopted by 61.9% of listings. This highlights the market's preference for longer commitments.
- A significant segment (61.9%) caters to monthly stays (30+ nights) in Schwanden bei Brienz, pointing to opportunities in the extended-stay market.
Recommendations
- Align with the market by considering a 30+ Nights minimum stay, as 61.9% of Schwanden bei Brienz hosts use this setting.
- Explore offering discounts for stays of 30+ nights to attract the 61.9% of the market seeking extended stays.
- Adjust minimum nights based on seasonality – potentially shorter during low season and longer during peak demand periods in Schwanden bei Brienz.
Schwanden bei Brienz Airbnb Cancellation Policy Trends Analysis (2026)
Super Strict 60 Days
1 listings
4.8% of total
Flexible
1 listings
4.8% of total
Moderate
5 listings
23.8% of total
Firm
12 listings
57.1% of total
Strict
2 listings
9.5% of total
Cancellation Policy Insights for Schwanden bei Brienz
- The prevailing Airbnb cancellation policy trend in Schwanden bei Brienz is Firm, used by 57.1% of listings.
- A majority (66.6%) of hosts in Schwanden bei Brienz utilize Firm or Strict policies, indicating a market where hosts prioritize booking security.
- Strict cancellation policies are quite rare (9.5%), potentially making listings with this policy less competitive unless justified by high demand or property type.
Recommendations for Hosts
- Consider adopting a Firm policy to align with the 57.1% market standard in Schwanden bei Brienz.
- Using a Strict policy might deter some guests, as only 9.5% of listings use it. Evaluate if potential revenue protection outweighs possible lower booking rates.
- Regularly review your cancellation policy against competitors and market demand shifts in Schwanden bei Brienz.
Schwanden bei Brienz STR Booking Lead Time Analysis (2026)
Average Booking Lead Time by Month
Booking Lead Time Insights for Schwanden bei Brienz
- The overall average booking lead time for vacation rentals in Schwanden bei Brienz is 82 days.
- Guests book furthest in advance for stays during July (average 119 days), likely coinciding with peak travel demand or local events.
- The shortest booking windows occur for stays in November (average 50 days), indicating more last-minute travel plans during this time.
- Seasonally, Summer (103 days avg.) sees the longest lead times, while Spring (67 days avg.) has the shortest, reflecting typical travel planning cycles.
Recommendations for Hosts
- Use the overall average lead time (82 days) as a baseline for your pricing and availability strategy in Schwanden bei Brienz.
- For July stays, consider implementing length-of-stay discounts or slightly higher rates for bookings made less than 119 days out to capitalize on advance planning.
- Target marketing efforts for the Summer season well in advance (at least 103 days) to capture early planners.
- Monitor your own booking lead times against these Schwanden bei Brienz averages to identify opportunities for dynamic pricing adjustments.
Popular & Essential Airbnb Amenities in Schwanden bei Brienz (2026)
Amenity Prevalence
Amenity Insights for Schwanden bei Brienz
- Essential amenities in Schwanden bei Brienz that guests expect include: Hair dryer, Dishes and silverware, Cooking basics, Wifi, Kitchen, Refrigerator, Heating, Free parking on premises, Stove, Hot water kettle. Lacking these (any) could significantly impact bookings.
Recommendations for Hosts
- Ensure your listing includes all essential amenities for Schwanden bei Brienz: Hair dryer, Dishes and silverware, Cooking basics, Wifi, Kitchen, Refrigerator, Heating, Free parking on premises, Stove, Hot water kettle.
- Prioritize adding missing essentials: Heating, Free parking on premises, Stove, Hot water kettle.
- Highlight unique or less common amenities you offer (e.g., hot tub, dedicated workspace, EV charger) in your listing description and photos.
- Regularly check competitor amenities in Schwanden bei Brienz to stay competitive.
Schwanden bei Brienz Airbnb Guest Demographics & Profile Analysis (2026)
Guest Profile Summary for Schwanden bei Brienz
- The typical guest profile for Airbnb in Schwanden bei Brienz consists of predominantly international visitors (92%), with top international origins including United Kingdom, typically belonging to the Post-2000s (Gen Z/Alpha) group (50%), primarily speaking English or French.
- Domestic travelers account for 8.3% of guests.
- Key international markets include United States (34.3%) and United Kingdom (10.8%).
- Top languages spoken are English (48.3%) followed by French (12.6%).
- A significant demographic segment is the Post-2000s (Gen Z/Alpha) group, representing 50% of guests.
Recommendations for Hosts
- Focus marketing internationally, particularly towards travelers from United Kingdom.
- Tailor amenities and listing descriptions to appeal to the dominant Post-2000s (Gen Z/Alpha) demographic (e.g., highlight fast WiFi, smart home features, local guides).
- Highlight unique local experiences or amenities relevant to the primary guest profile.
- Consider seasonal promotions aligned with peak travel times for key origin markets.
Nearby Short-Term Rental Market Comparison
How does the Schwanden bei Brienz Airbnb market stack up against its neighbors? Compare key performance metrics like average monthly revenue, ADR, and occupancy rates in surrounding areas to understand the broader regional STR landscape.
| Market | Active Properties | Monthly Revenue | Daily Rate | Avg. Occupancy |
|---|---|---|---|---|
| Brienzwiler | 11 | $7,335 | $514.27 | 60% |
| Niederried bei Interlaken | 19 | $6,267 | $552.03 | 44% |
| Lauterbrunnen | 552 | $6,108 | $487.83 | 51% |
| Ranco | 12 | $5,691 | $536.46 | 42% |
| Matten bei Interlaken | 64 | $5,607 | $336.51 | 59% |
| Grindelwald | 513 | $5,587 | $396.62 | 56% |
| Bassersdorf | 16 | $5,337 | $431.59 | 46% |
| Wengen | 12 | $5,115 | $595.38 | 46% |
| Oberhofen am Thunersee | 25 | $5,051 | $329.28 | 51% |
| Zermatt | 792 | $5,017 | $504.14 | 46% |