Thun Airbnb Market Analysis 2026: Short Term Rental Data & Vacation Rental Statistics in Bern, Switzerland
Is Airbnb profitable in Thun in 2026? Explore comprehensive Airbnb analytics for Thun, Bern, Switzerland to uncover income potential. This 2026 STR market report for Thun, based on AirROI data from February 2025 to January 2026, reveals key trends in the niche market of 90 active listings.
Whether you're considering an Airbnb investment in Thun, optimizing your existing vacation rental, or exploring rental arbitrage opportunities, understanding the Thun Airbnb data is crucial. Leveraging the low regulation environment is key to maximizing your short term rental income potential. Let's dive into the specifics.
Key Thun Airbnb Performance Metrics Overview
Monthly Airbnb Revenue Variations & Income Potential in Thun (2026)
Understanding the monthly revenue variations for Airbnb listings in Thun is key to maximizing your short term rental income potential. Seasonality significantly impacts earnings. Our analysis, based on data from the past 12 months, shows that the peak revenue month for STRs in Thun is typically July, while January often presents the lowest earnings, highlighting opportunities for strategic pricing adjustments during shoulder and low seasons. Explore the typical Airbnb income in Thun across different performance tiers:
- Best-in-class properties (Top 10%) achieve $6,780+ monthly, often utilizing dynamic pricing and superior guest experiences.
- Strong performing properties (Top 25%) earn $4,287 or more, indicating effective management and desirable locations/amenities.
- Typical properties (Median) generate around $2,572 per month, representing the average market performance.
- Entry-level properties (Bottom 25%) see earnings around $1,427, often with potential for optimization.
Average Monthly Airbnb Earnings Trend in Thun
Thun Airbnb Occupancy Rate Trends (2026)
Maximize your bookings by understanding the Thun STR occupancy trends. Seasonal demand shifts significantly influence how often properties are booked. Typically, Julysees the highest demand (peak season occupancy), while January experiences the lowest (low season). Effective strategies, like adjusting minimum stays or offering promotions, can boost occupancy during slower periods. Here's how different property tiers perform in Thun:
- Best-in-class properties (Top 10%) achieve 87%+ occupancy, indicating high desirability and potentially optimized availability.
- Strong performing properties (Top 25%) maintain 73% or higher occupancy, suggesting good market fit and guest satisfaction.
- Typical properties (Median) have an occupancy rate around 54%.
- Entry-level properties (Bottom 25%) average 32% occupancy, potentially facing higher vacancy.
Average Monthly Occupancy Rate Trend in Thun
Average Daily Rate (ADR) Airbnb Trends in Thun (2026)
Effective short term rental pricing strategy in Thun involves understanding monthly ADR fluctuations. The Average Daily Rate (ADR) for Airbnb in Thun typically peaks in September and dips lowest during March. Leveraging Airbnb dynamic pricing tools or strategies based on this seasonality can significantly boost revenue. Here's a look at the typical nightly rates achieved:
- Best-in-class properties (Top 10%) command rates of $372+ per night, often due to premium features or locations.
- Strong performing properties (Top 25%) achieve nightly rates of $254 or more.
- Typical properties (Median) charge around $171 per night.
- Entry-level properties (Bottom 25%) earn around $113 per night.
Average Daily Rate (ADR) Trend by Month in Thun
Get Live Thun Market Intelligence 👇

Explore Real-time Analytics
Airbnb Seasonality Analysis & Trends in Thun (2026)
Peak Season (July, August, June)
- Revenue averages $5,068 per month
- Occupancy rates average 70.5%
- Daily rates average $215
Shoulder Season
- Revenue averages $3,134 per month
- Occupancy maintains around 52.4%
- Daily rates hold near $200
Low Season (January, February, November)
- Revenue drops to average $1,783 per month
- Occupancy decreases to average 35.1%
- Daily rates adjust to average $195
Seasonality Insights for Thun
- The Airbnb seasonality in Thun shows highly seasonal trends requiring careful strategy. While the sections above show seasonal averages, it's also insightful to look at the extremes:
- During the high season, the absolute peak month showcases Thun's highest earning potential, with monthly revenues capable of climbing to $5,510, occupancy reaching a high of 73.5%, and ADRs peaking at $230.
- Conversely, the slowest single month of the year, typically falling within the low season, marks the market's lowest point. In this month, revenue might dip to $1,619, occupancy could drop to 27.9%, and ADRs may adjust down to $171.
- Understanding both the seasonal averages and these monthly peaks and troughs in revenue, occupancy, and ADR is crucial for maximizing your Airbnb profit potential in Thun.
Seasonal Strategies for Maximizing Profit
- Peak Season: Maximize revenue through premium pricing and potentially longer minimum stays. Ensure high availability.
- Low Season: Offer competitive pricing, special promotions (e.g., extended stay discounts), and flexible cancellation policies. Target off-season travelers like remote workers or budget-conscious guests.
- Shoulder Seasons: Implement dynamic pricing that balances peak and low rates. Target weekend travelers or specific events. Offer slightly more flexible terms than peak season.
- Regularly analyze your own performance against these Thun seasonality benchmarks and adjust your pricing and availability strategy accordingly.
Best Areas for Airbnb Investment in Thun (2026)
Exploring the top neighborhoods for short-term rentals in Thun? This section highlights key areas, outlining why they are attractive for hosts and guests, along with notable local attractions. Consider these locations based on your target guest profile and investment strategy.
| Neighborhood / Area | Why Host Here? (Target Guests & Appeal) | Key Attractions & Landmarks |
|---|---|---|
| Thun Old Town | Charming medieval core with well-preserved buildings and cobblestone streets. This picturesque area is perfect for tourists wanting to explore history and culture, with plenty of shops and restaurants. | Thun Castle, Aare River Promenade, The Church of St. Mary, Thun Marketplace, Museum of Communication |
| Thun Lake | Scenic waterfront area offering stunning views of the lake and mountains. Ideal for those who enjoy outdoor activities like swimming, hiking, and boating. | Thun Lake, Boat trips, Hiking trails, Water sports, Picnic spots |
| Schwarzsee | A serene and beautiful area close to nature, attracting visitors who appreciate tranquility and outdoor adventures, such as hiking and fishing. | Schwarzsee Lake, Hiking trails, Fishing spots, Picnicking areas, Mountain views |
| Thun Hard | A lively neighborhood known for shopping and dining, making it a popular choice for travelers looking for convenience and local culture. | Thun City Shopping, Cafés and restaurants, Thun Park, Cultural events, Local markets |
| Thunersee Park | This area features parks and green spaces along the lake, providing a relaxing environment for families and those looking to unwind. | Thun Beach, Walking paths, Children's playgrounds, Natural reserves, Picnic areas |
| Hinterstocken | A tranquil residential area that attracts guests looking for a peaceful retreat while still being close to the city's attractions. | Nature trails, Quiet surroundings, Villages nearby, Views of the Alps, Local farms |
| Ballenberg | An open-air museum showcasing Swiss rural life, ideal for families and tourists interested in heritage and history. | Ballenberg Open-Air Museum, Traditional Swiss architecture, Workshops and demonstrations, Cafés, Garden exhibitions |
| Obere Allmend | Home to various local events and festivals, it offers a vibrant community atmosphere, attracting both locals and visitors. | Local festivals, Community events, Market days, Artisan shops, Cultural experiences |
Understanding Airbnb License Requirements & STR Laws in Thun (2026)
While Thun, Bern, Switzerland currently shows low STR regulations, specific Airbnb license requirements might still exist or change. Always verify the latest short term rental regulations and Airbnb license requirements directly with local government authorities for Thun to ensure full compliance before hosting.
(Source: AirROI data, 2026, finding no licensed listings among those analyzed)
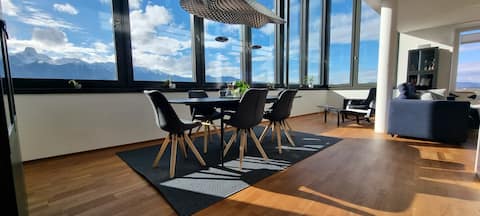
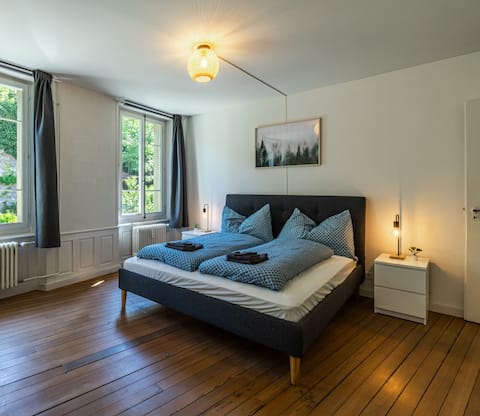
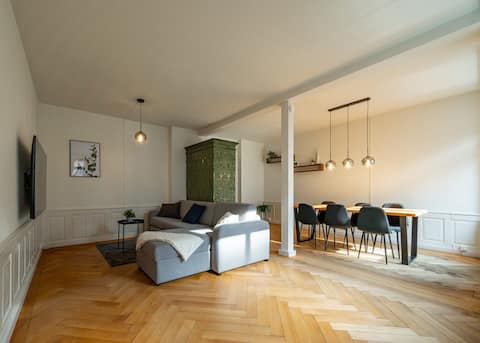
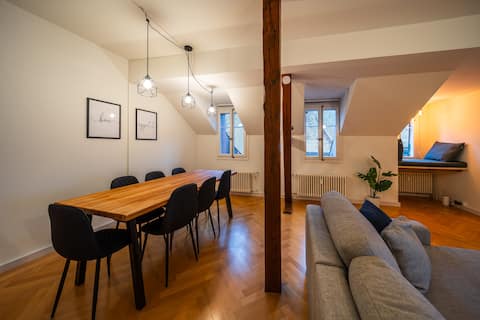
Top Performing Airbnb Properties in Thun (2026)
Benchmark your potential! Explore examples of top-performing Airbnb properties in Thunbased on Trailing Twelve Month (TTM) revenue. Analyze their characteristics, revenue, occupancy rate, and ADR to understand what drives success in this market.

Swiss Chalet stunning Lake & Alpine Mountain View
Entire Place • 5 bedrooms
Exclusive penthouse with pool in the heart of Thun
Entire Place • 2 bedrooms
Historic apartment in the old town of Thun
Entire Place • 2 bedrooms
Jewel in the center of Thun's old Town
Entire Place • 1 bedroom
Old town apt in the heart of Thun with garden
Entire Place • 2 bedrooms

Charming apartment with balcony near Lake Thun
Entire Place • 1 bedroom
Note: Performance varies based on location, size, amenities, seasonality, and management quality. Data reflects the past 12 months.
Top Performing Airbnb Hosts in Thun (2026)
Learn from the best! This table showcases top-performing Airbnb hosts in Thun based on the number of properties managed and estimated total revenue over the past year. Analyze their scale and performance metrics.
| Host Name | Properties | Grossing Revenue | Stay Reviews | Avg Rating |
|---|---|---|---|---|
| Salome | 4 | $357,119 | 352 | 4.95/5.0 |
| Giancarlo | 3 | $266,970 | 236 | 4.89/5.0 |
| Steve | 1 | $151,759 | 120 | 4.88/5.0 |
| Alain | 2 | $139,399 | 192 | 4.93/5.0 |
| Ronny&Mariana | 2 | $129,490 | 207 | 4.89/5.0 |
| Marcos | 2 | $108,857 | 222 | 4.96/5.0 |
| Stefanie | 2 | $83,301 | 166 | 4.81/5.0 |
| Jennifer | 2 | $79,116 | 343 | 4.91/5.0 |
| Jürg | 1 | $78,215 | 78 | 4.82/5.0 |
| Ursula | 4 | $77,837 | 802 | 4.66/5.0 |
Analyzing the strategies of top hosts, such as their property selection, pricing, and guest communication, can offer valuable lessons for optimizing your own Airbnb operations in Thun.
Dive Deeper: Advanced Thun STR Market Data (2026)
Ready to unlock more insights? AirROI provides access to advanced metrics and comprehensive Airbnb data for Thun. Explore detailed analytics beyond this report to refine your investment strategy, optimize pricing, and maximize your vacation rental profits.
Explore Advanced MetricsThun Short-Term Rental Market Composition (2026): Property & Room Types
Room Type Distribution
Property Type Distribution
Market Composition Insights for Thun
- The Thun Airbnb market composition is heavily skewed towards Entire Home/Apt listings, which make up 65.6% of the 90 active rentals. This indicates strong guest preference for privacy and space.
- However, a notable 34.4% share for Private Rooms suggests opportunities for budget-conscious travelers or hosts renting out spare rooms.
- Looking at the property type distribution in Thun, Apartment/Condo properties are the most common (70%), reflecting the local real estate landscape.
- The presence of 11.1% Hotel/Boutique listings indicates integration with traditional hospitality.
- Smaller segments like others (combined 4.4%) offer potential for unique stay experiences.
Thun Airbnb Room Capacity Analysis (2026): Bedroom Distribution
Distribution of Listings by Number of Bedrooms
Room Capacity Insights for Thun
- The dominant room capacity in Thun is 1 bedroom listings, making up 55.6% of the market. This suggests a strong demand for properties suitable for couples or solo travelers.
- Together, 1 bedroom and 2 bedrooms properties represent 68.9% of the active Airbnb listings in Thun, indicating a high concentration in these sizes.
- With over half the market (55.6%) consisting of studios or 1-bedroom units, Thun is particularly well-suited for individuals or couples.
Thun Vacation Rental Guest Capacity Trends (2026)
Distribution of Listings by Guest Capacity
Guest Capacity Insights for Thun
- The most common guest capacity trend in Thun vacation rentals is listings accommodating 2 guests (33.3%). This suggests the primary traveler segment is likely couples or solo travelers.
- Properties designed for 2 guests and 3 guests dominate the Thun STR market, accounting for 46.6% of listings.
- 12.2% of properties accommodate 6+ guests, serving the market segment for larger families or group travel in Thun.
- On average, properties in Thun are equipped to host 2.7 guests.
Thun Airbnb Booking Patterns (2026): Available vs. Booked Days
Available Days Distribution
Booked Days Distribution
Booking Pattern Insights for Thun
- The most common availability pattern in Thun falls within the 91-180 days range, representing 32.2% of listings. This suggests many properties have significant open periods on their calendars.
- Approximately 53.3% of listings show high availability (181+ days open annually), indicating potential for increased bookings or specific owner usage patterns.
- For booked days, the 181-270 days range is most frequent in Thun (35.6%), reflecting common guest stay durations or potential owner blocking patterns.
- A notable 50.0% of properties secure long booking periods (181+ days booked per year), highlighting successful long-term rental strategies or significant owner usage.
Thun Airbnb Minimum Stay Requirements Analysis
Distribution of Listings by Minimum Night Requirement
1 Night
30 listings
33.3% of total
2 Nights
21 listings
23.3% of total
3 Nights
6 listings
6.7% of total
4-6 Nights
3 listings
3.3% of total
30+ Nights
30 listings
33.3% of total
Key Insights
- The most prevalent minimum stay requirement in Thun is 1 Night, adopted by 33.3% of listings. This highlights the market's preference for shorter, flexible bookings.
- A significant segment (33.3%) caters to monthly stays (30+ nights) in Thun, pointing to opportunities in the extended-stay market.
Recommendations
- Align with the market by considering a 1 Night minimum stay, as 33.3% of Thun hosts use this setting.
- Explore offering discounts for stays of 30+ nights to attract the 33.3% of the market seeking extended stays.
- Adjust minimum nights based on seasonality – potentially shorter during low season and longer during peak demand periods in Thun.
Thun Airbnb Cancellation Policy Trends Analysis (2026)
Flexible
24 listings
26.7% of total
Moderate
42 listings
46.7% of total
Firm
21 listings
23.3% of total
Strict
3 listings
3.3% of total
Cancellation Policy Insights for Thun
- The prevailing Airbnb cancellation policy trend in Thun is Moderate, used by 46.7% of listings.
- The market strongly favors guest-friendly terms, with 73.4% of listings offering Flexible or Moderate policies. This suggests guests in Thun may expect booking flexibility.
- Strict cancellation policies are quite rare (3.3%), potentially making listings with this policy less competitive unless justified by high demand or property type.
Recommendations for Hosts
- Consider adopting a Moderate policy to align with the 46.7% market standard in Thun.
- Using a Strict policy might deter some guests, as only 3.3% of listings use it. Evaluate if potential revenue protection outweighs possible lower booking rates.
- Regularly review your cancellation policy against competitors and market demand shifts in Thun.
Thun STR Booking Lead Time Analysis (2026)
Average Booking Lead Time by Month
Booking Lead Time Insights for Thun
- The overall average booking lead time for vacation rentals in Thun is 60 days.
- Guests book furthest in advance for stays during August (average 95 days), likely coinciding with peak travel demand or local events.
- The shortest booking windows occur for stays in February (average 39 days), indicating more last-minute travel plans during this time.
- Seasonally, Summer (78 days avg.) sees the longest lead times, while Winter (47 days avg.) has the shortest, reflecting typical travel planning cycles.
Recommendations for Hosts
- Use the overall average lead time (60 days) as a baseline for your pricing and availability strategy in Thun.
- For August stays, consider implementing length-of-stay discounts or slightly higher rates for bookings made less than 95 days out to capitalize on advance planning.
- Target marketing efforts for the Summer season well in advance (at least 78 days) to capture early planners.
- Monitor your own booking lead times against these Thun averages to identify opportunities for dynamic pricing adjustments.
Popular & Essential Airbnb Amenities in Thun (2026)
Amenity Prevalence
Amenity Insights for Thun
- Essential amenities in Thun that guests expect include: Wifi. Lacking these (this) could significantly impact bookings.
- Popular amenities like Heating, Hair dryer, Hot water are common but not universal. Offering these can provide a competitive edge.
Recommendations for Hosts
- Ensure your listing includes all essential amenities for Thun: Wifi.
- Prioritize adding missing essentials: Wifi.
- Consider adding popular differentiators like Heating or Hair dryer to increase appeal.
- Highlight unique or less common amenities you offer (e.g., hot tub, dedicated workspace, EV charger) in your listing description and photos.
- Regularly check competitor amenities in Thun to stay competitive.
Thun Airbnb Guest Demographics & Profile Analysis (2026)
Guest Profile Summary for Thun
- The typical guest profile for Airbnb in Thun consists of predominantly international visitors (84%), with top international origins including Switzerland, typically belonging to the Post-2000s (Gen Z/Alpha) group (50%), primarily speaking English or German.
- Domestic travelers account for 16.3% of guests.
- Key international markets include United States (22.2%) and Switzerland (16.3%).
- Top languages spoken are English (43.4%) followed by German (13%).
- A significant demographic segment is the Post-2000s (Gen Z/Alpha) group, representing 50% of guests.
Recommendations for Hosts
- Focus marketing internationally, particularly towards travelers from Switzerland.
- Tailor amenities and listing descriptions to appeal to the dominant Post-2000s (Gen Z/Alpha) demographic (e.g., highlight fast WiFi, smart home features, local guides).
- Highlight unique local experiences or amenities relevant to the primary guest profile.
- Consider seasonal promotions aligned with peak travel times for key origin markets.
Nearby Short-Term Rental Market Comparison
How does the Thun Airbnb market stack up against its neighbors? Compare key performance metrics like average monthly revenue, ADR, and occupancy rates in surrounding areas to understand the broader regional STR landscape.
| Market | Active Properties | Monthly Revenue | Daily Rate | Avg. Occupancy |
|---|---|---|---|---|
| Brienzwiler | 11 | $7,335 | $514.27 | 60% |
| Niederried bei Interlaken | 19 | $6,267 | $552.03 | 44% |
| Lauterbrunnen | 552 | $6,108 | $487.83 | 51% |
| Ranco | 12 | $5,691 | $536.46 | 42% |
| Matten bei Interlaken | 64 | $5,607 | $336.51 | 59% |
| Grindelwald | 513 | $5,587 | $396.62 | 56% |
| Les Clefs | 34 | $5,585 | $314.08 | 47% |
| Bassersdorf | 16 | $5,337 | $431.59 | 46% |
| Wengen | 12 | $5,115 | $595.38 | 46% |
| Oberhofen am Thunersee | 25 | $5,051 | $329.28 | 51% |