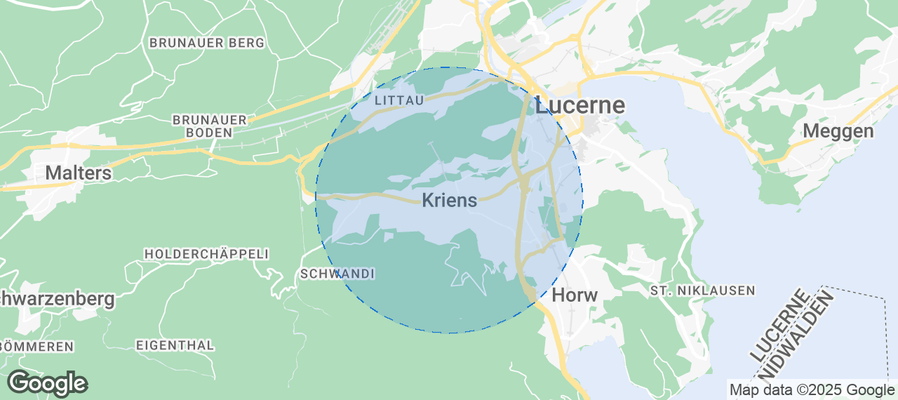
Kriens Airbnb Market Analysis 2026: Short Term Rental Data & Vacation Rental Statistics in Lucerne, Switzerland
Is Airbnb profitable in Kriens in 2026? Explore comprehensive Airbnb analytics for Kriens, Lucerne, Switzerland to uncover income potential. This 2026 STR market report for Kriens, based on AirROI data from February 2025 to January 2026, reveals key trends in the niche market of 54 active listings.
Whether you're considering an Airbnb investment in Kriens, optimizing your existing vacation rental, or exploring rental arbitrage opportunities, understanding the Kriens Airbnb data is crucial. Leveraging the low regulation environment is key to maximizing your short term rental income potential. Let's dive into the specifics.
Key Kriens Airbnb Performance Metrics Overview
Monthly Airbnb Revenue Variations & Income Potential in Kriens (2026)
Understanding the monthly revenue variations for Airbnb listings in Kriens is key to maximizing your short term rental income potential. Seasonality significantly impacts earnings. Our analysis, based on data from the past 12 months, shows that the peak revenue month for STRs in Kriens is typically August, while January often presents the lowest earnings, highlighting opportunities for strategic pricing adjustments during shoulder and low seasons. Explore the typical Airbnb income in Kriens across different performance tiers:
- Best-in-class properties (Top 10%) achieve $6,028+ monthly, often utilizing dynamic pricing and superior guest experiences.
- Strong performing properties (Top 25%) earn $4,462 or more, indicating effective management and desirable locations/amenities.
- Typical properties (Median) generate around $2,660 per month, representing the average market performance.
- Entry-level properties (Bottom 25%) see earnings around $1,412, often with potential for optimization.
Average Monthly Airbnb Earnings Trend in Kriens
Kriens Airbnb Occupancy Rate Trends (2026)
Maximize your bookings by understanding the Kriens STR occupancy trends. Seasonal demand shifts significantly influence how often properties are booked. Typically, Junesees the highest demand (peak season occupancy), while January experiences the lowest (low season). Effective strategies, like adjusting minimum stays or offering promotions, can boost occupancy during slower periods. Here's how different property tiers perform in Kriens:
- Best-in-class properties (Top 10%) achieve 89%+ occupancy, indicating high desirability and potentially optimized availability.
- Strong performing properties (Top 25%) maintain 76% or higher occupancy, suggesting good market fit and guest satisfaction.
- Typical properties (Median) have an occupancy rate around 53%.
- Entry-level properties (Bottom 25%) average 28% occupancy, potentially facing higher vacancy.
Average Monthly Occupancy Rate Trend in Kriens
Average Daily Rate (ADR) Airbnb Trends in Kriens (2026)
Effective short term rental pricing strategy in Kriens involves understanding monthly ADR fluctuations. The Average Daily Rate (ADR) for Airbnb in Kriens typically peaks in September and dips lowest during March. Leveraging Airbnb dynamic pricing tools or strategies based on this seasonality can significantly boost revenue. Here's a look at the typical nightly rates achieved:
- Best-in-class properties (Top 10%) command rates of $313+ per night, often due to premium features or locations.
- Strong performing properties (Top 25%) achieve nightly rates of $256 or more.
- Typical properties (Median) charge around $169 per night.
- Entry-level properties (Bottom 25%) earn around $100 per night.
Average Daily Rate (ADR) Trend by Month in Kriens
Get Live Kriens Market Intelligence 👇
Explore Real-time Analytics
Airbnb Seasonality Analysis & Trends in Kriens (2026)
Peak Season (August, June, July)
- Revenue averages $4,306 per month
- Occupancy rates average 65.3%
- Daily rates average $189
Shoulder Season
- Revenue averages $3,075 per month
- Occupancy maintains around 51.8%
- Daily rates hold near $194
Low Season (January, February, March)
- Revenue drops to average $2,088 per month
- Occupancy decreases to average 37.7%
- Daily rates adjust to average $173
Seasonality Insights for Kriens
- The Airbnb seasonality in Kriens shows highly seasonal trends requiring careful strategy. While the sections above show seasonal averages, it's also insightful to look at the extremes:
- During the high season, the absolute peak month showcases Kriens's highest earning potential, with monthly revenues capable of climbing to $4,329, occupancy reaching a high of 66.3%, and ADRs peaking at $220.
- Conversely, the slowest single month of the year, typically falling within the low season, marks the market's lowest point. In this month, revenue might dip to $1,852, occupancy could drop to 29.1%, and ADRs may adjust down to $158.
- Understanding both the seasonal averages and these monthly peaks and troughs in revenue, occupancy, and ADR is crucial for maximizing your Airbnb profit potential in Kriens.
Seasonal Strategies for Maximizing Profit
- Peak Season: Maximize revenue through premium pricing and potentially longer minimum stays. Ensure high availability.
- Low Season: Offer competitive pricing, special promotions (e.g., extended stay discounts), and flexible cancellation policies. Target off-season travelers like remote workers or budget-conscious guests.
- Shoulder Seasons: Implement dynamic pricing that balances peak and low rates. Target weekend travelers or specific events. Offer slightly more flexible terms than peak season.
- Regularly analyze your own performance against these Kriens seasonality benchmarks and adjust your pricing and availability strategy accordingly.
Best Areas for Airbnb Investment in Kriens (2026)
Exploring the top neighborhoods for short-term rentals in Kriens? This section highlights key areas, outlining why they are attractive for hosts and guests, along with notable local attractions. Consider these locations based on your target guest profile and investment strategy.
| Neighborhood / Area | Why Host Here? (Target Guests & Appeal) | Key Attractions & Landmarks |
|---|---|---|
| Kriens Center | Central area with easy access to public transport and shopping, making it convenient for guests to explore Lucerne and surrounding regions. | Kriens Shopping Center, Pilatus, Luzern Culture and Congress Center, Local restaurants, Public transport access |
| Pilatusbahn | Home to the famous cogwheel railway leading to Mount Pilatus, a popular spot for hiking and panoramic views. Attracts nature lovers and adventure seekers. | Mount Pilatus, Pilatus Aerial Cableway, Hiking trails, Scenic views, Alpine sports activities |
| Rengg | Quiet residential area that offers stunning views of Lake Lucerne and the mountains. Ideal for guests looking for a peaceful retreat. | Lake Lucerne, Hiking paths, Scenic viewpoints, Nature parks, Relaxing atmosphere |
| Kriens-Matthaus | A vibrant neighborhood with local culture and community events. Great for those wanting to experience the local lifestyle. | Local markets, Cafes, Community parks, Cultural events, Art exhibitions |
| Lakefront | Proximity to Lake Lucerne provides numerous recreational activities such as boating and swimming, perfect for summer tourism. | Lake Lucerne, Boat rentals, Swimming spots, Lakeside walks, Picnic areas |
| Eichhof | Emerging area known for the Eichhof Brewery, attracting guests interested in local food and drink experiences. A unique draw for culinary tourists. | Eichhof Brewery tours, Local dining options, Historical landmarks, Breweries, Artisan shops |
| Kriens-Lehmentweg | This area offers a mix of residential charm and accessibility to both nature and city life, appealing to diverse traveler types. | Hiking trails, Public parks, Connection to transport links, Local dining, Community events |
| Kriens Castle | Historically significant area with a popular castle, appealing to tourists interested in history and culture. | Kriens Castle, Historical tours, Cultural festivals, Walking paths, Scenic history |
Understanding Airbnb License Requirements & STR Laws in Kriens (2026)
While Kriens, Lucerne, Switzerland currently shows low STR regulations, specific Airbnb license requirements might still exist or change. Always verify the latest short term rental regulations and Airbnb license requirements directly with local government authorities for Kriens to ensure full compliance before hosting.
(Source: AirROI data, 2026, finding no licensed listings among those analyzed)
Top Performing Airbnb Properties in Kriens (2026)
Benchmark your potential! Explore examples of top-performing Airbnb properties in Kriensbased on Trailing Twelve Month (TTM) revenue. Analyze their characteristics, revenue, occupancy rate, and ADR to understand what drives success in this market.

Modern 2-Bedroom Apartment with Mountain View
Entire Place • 2 bedrooms

Apartment city limits Lucerne
Entire Place • 4 bedrooms

House Sonnenberg
Entire Place • 4 bedrooms

LABEA-Stay / Idyllic I romantic I View I Nature
Entire Place • 1 bedroom

Bohemian Apartment Pilatus View Sophias Dreamland
Entire Place • 2 bedrooms

House with big garten and space
Entire Place • 2 bedrooms
Note: Performance varies based on location, size, amenities, seasonality, and management quality. Data reflects the past 12 months.
Top Performing Airbnb Hosts in Kriens (2026)
Learn from the best! This table showcases top-performing Airbnb hosts in Kriens based on the number of properties managed and estimated total revenue over the past year. Analyze their scale and performance metrics.
| Host Name | Properties | Grossing Revenue | Stay Reviews | Avg Rating |
|---|---|---|---|---|
| Beatrice | 4 | $196,868 | 304 | 4.79/5.0 |
| Yi-Tai | 5 | $140,918 | 120 | 4.92/5.0 |
| Gästehaus Im Rank Marcel & Du | 5 | $136,953 | 1284 | 4.88/5.0 |
| Lukas | 2 | $133,165 | 152 | 4.50/5.0 |
| Martin | 3 | $81,418 | 73 | 4.81/5.0 |
| Sven | 2 | $80,682 | 57 | 4.97/5.0 |
| Renate | 1 | $78,577 | 22 | 4.91/5.0 |
| Ray | 6 | $74,525 | 894 | 4.94/5.0 |
| Bettina | 1 | $68,862 | 48 | 4.79/5.0 |
| Larissa | 1 | $68,189 | 96 | 5.00/5.0 |
Analyzing the strategies of top hosts, such as their property selection, pricing, and guest communication, can offer valuable lessons for optimizing your own Airbnb operations in Kriens.
Dive Deeper: Advanced Kriens STR Market Data (2026)
Ready to unlock more insights? AirROI provides access to advanced metrics and comprehensive Airbnb data for Kriens. Explore detailed analytics beyond this report to refine your investment strategy, optimize pricing, and maximize your vacation rental profits.
Explore Advanced MetricsKriens Short-Term Rental Market Composition (2026): Property & Room Types
Room Type Distribution
Property Type Distribution
Market Composition Insights for Kriens
- The Kriens Airbnb market composition is heavily skewed towards Entire Home/Apt listings, which make up 64.8% of the 54 active rentals. This indicates strong guest preference for privacy and space.
- However, a notable 31.5% share for Private Rooms suggests opportunities for budget-conscious travelers or hosts renting out spare rooms.
- Looking at the property type distribution in Kriens, Apartment/Condo properties are the most common (59.3%), reflecting the local real estate landscape.
- Houses represent a significant 31.5% portion, catering likely to families or larger groups.
- Smaller segments like hotel/boutique, unique stays, outdoor/unique (combined 9.3%) offer potential for unique stay experiences.
Kriens Airbnb Room Capacity Analysis (2026): Bedroom Distribution
Distribution of Listings by Number of Bedrooms
Room Capacity Insights for Kriens
- The dominant room capacity in Kriens is 1 bedroom listings, making up 33.3% of the market. This suggests a strong demand for properties suitable for couples or solo travelers.
- Together, 1 bedroom and 2 bedrooms properties represent 53.7% of the active Airbnb listings in Kriens, indicating a high concentration in these sizes.
Kriens Vacation Rental Guest Capacity Trends (2026)
Distribution of Listings by Guest Capacity
Guest Capacity Insights for Kriens
- The most common guest capacity trend in Kriens vacation rentals is listings accommodating 4 guests (25.9%). This suggests the primary traveler segment is likely small families or groups.
- Properties designed for 4 guests and 2 guests dominate the Kriens STR market, accounting for 44.4% of listings.
- 11.2% of properties accommodate 6+ guests, serving the market segment for larger families or group travel in Kriens.
- On average, properties in Kriens are equipped to host 2.8 guests.
Kriens Airbnb Booking Patterns (2026): Available vs. Booked Days
Available Days Distribution
Booked Days Distribution
Booking Pattern Insights for Kriens
- The most common availability pattern in Kriens falls within the 181-270 days range, representing 38.9% of listings. This suggests many properties have significant open periods on their calendars.
- Approximately 66.7% of listings show high availability (181+ days open annually), indicating potential for increased bookings or specific owner usage patterns.
- For booked days, the 91-180 days range is most frequent in Kriens (40.7%), reflecting common guest stay durations or potential owner blocking patterns.
- A notable 33.4% of properties secure long booking periods (181+ days booked per year), highlighting successful long-term rental strategies or significant owner usage.
Kriens Airbnb Minimum Stay Requirements Analysis
Distribution of Listings by Minimum Night Requirement
1 Night
11 listings
20.4% of total
2 Nights
14 listings
25.9% of total
3 Nights
6 listings
11.1% of total
4-6 Nights
4 listings
7.4% of total
7-29 Nights
2 listings
3.7% of total
30+ Nights
17 listings
31.5% of total
Key Insights
- The most prevalent minimum stay requirement in Kriens is 30+ Nights, adopted by 31.5% of listings. This highlights the market's preference for longer commitments.
- A significant segment (31.5%) caters to monthly stays (30+ nights) in Kriens, pointing to opportunities in the extended-stay market.
Recommendations
- Align with the market by considering a 30+ Nights minimum stay, as 31.5% of Kriens hosts use this setting.
- If feasible, allowing 1-night stays, especially midweek or during low season, could capture last-minute bookings, as only 20.4% currently do.
- Explore offering discounts for stays of 30+ nights to attract the 31.5% of the market seeking extended stays.
- Adjust minimum nights based on seasonality – potentially shorter during low season and longer during peak demand periods in Kriens.
Kriens Airbnb Cancellation Policy Trends Analysis (2026)
Flexible
15 listings
27.8% of total
Moderate
10 listings
18.5% of total
Firm
20 listings
37% of total
Strict
9 listings
16.7% of total
Cancellation Policy Insights for Kriens
- The prevailing Airbnb cancellation policy trend in Kriens is Firm, used by 37% of listings.
- A majority (53.7%) of hosts in Kriens utilize Firm or Strict policies, indicating a market where hosts prioritize booking security.
Recommendations for Hosts
- Consider adopting a Firm policy to align with the 37% market standard in Kriens.
- Regularly review your cancellation policy against competitors and market demand shifts in Kriens.
Kriens STR Booking Lead Time Analysis (2026)
Average Booking Lead Time by Month
Booking Lead Time Insights for Kriens
- The overall average booking lead time for vacation rentals in Kriens is 51 days.
- Guests book furthest in advance for stays during July (average 74 days), likely coinciding with peak travel demand or local events.
- The shortest booking windows occur for stays in March (average 24 days), indicating more last-minute travel plans during this time.
- Seasonally, Summer (70 days avg.) sees the longest lead times, while Winter (39 days avg.) has the shortest, reflecting typical travel planning cycles.
Recommendations for Hosts
- Use the overall average lead time (51 days) as a baseline for your pricing and availability strategy in Kriens.
- For July stays, consider implementing length-of-stay discounts or slightly higher rates for bookings made less than 74 days out to capitalize on advance planning.
- Target marketing efforts for the Summer season well in advance (at least 70 days) to capture early planners.
- Monitor your own booking lead times against these Kriens averages to identify opportunities for dynamic pricing adjustments.
Popular & Essential Airbnb Amenities in Kriens (2026)
Amenity Prevalence
Amenity Insights for Kriens
- Essential amenities in Kriens that guests expect include: Hair dryer, Dishes and silverware, Bed linens. Lacking these (any) could significantly impact bookings.
- Popular amenities like Hot water, Kitchen, Wifi are common but not universal. Offering these can provide a competitive edge.
- Warning: Wifi is not universally provided but is considered essential globally. Ensure reliable Wifi is offered.
Recommendations for Hosts
- Ensure your listing includes all essential amenities for Kriens: Hair dryer, Dishes and silverware, Bed linens.
- Prioritize adding missing essentials: Hair dryer, Dishes and silverware, Bed linens.
- Consider adding popular differentiators like Hot water or Kitchen to increase appeal.
- Highlight unique or less common amenities you offer (e.g., hot tub, dedicated workspace, EV charger) in your listing description and photos.
- Regularly check competitor amenities in Kriens to stay competitive.
Kriens Airbnb Guest Demographics & Profile Analysis (2026)
Guest Profile Summary for Kriens
- The typical guest profile for Airbnb in Kriens consists of predominantly international visitors (96%), with top international origins including United Kingdom, typically belonging to the Post-2000s (Gen Z/Alpha) group (50%), primarily speaking English or German.
- Domestic travelers account for 4.4% of guests.
- Key international markets include United States (30.4%) and United Kingdom (9.8%).
- Top languages spoken are English (46.3%) followed by German (10.9%).
- A significant demographic segment is the Post-2000s (Gen Z/Alpha) group, representing 50% of guests.
Recommendations for Hosts
- Focus marketing internationally, particularly towards travelers from United Kingdom.
- Tailor amenities and listing descriptions to appeal to the dominant Post-2000s (Gen Z/Alpha) demographic (e.g., highlight fast WiFi, smart home features, local guides).
- Highlight unique local experiences or amenities relevant to the primary guest profile.
- Consider seasonal promotions aligned with peak travel times for key origin markets.
Nearby Short-Term Rental Market Comparison
How does the Kriens Airbnb market stack up against its neighbors? Compare key performance metrics like average monthly revenue, ADR, and occupancy rates in surrounding areas to understand the broader regional STR landscape.
| Market | Active Properties | Monthly Revenue | Daily Rate | Avg. Occupancy |
|---|---|---|---|---|
| Brienzwiler | 11 | $7,335 | $514.27 | 60% |
| Ittenheim | 20 | $6,532 | $404.34 | 42% |
| Niederried bei Interlaken | 19 | $6,267 | $552.03 | 44% |
| Lauterbrunnen | 552 | $6,108 | $487.83 | 51% |
| Furdenheim | 14 | $6,054 | $470.22 | 50% |
| Matten bei Interlaken | 64 | $5,607 | $336.51 | 59% |
| Grindelwald | 513 | $5,587 | $396.62 | 56% |
| Bassersdorf | 16 | $5,337 | $431.59 | 46% |
| Wengen | 12 | $5,115 | $595.38 | 46% |
| Oberhofen am Thunersee | 25 | $5,051 | $329.28 | 51% |