Flums Airbnb Market Analysis 2026: Short Term Rental Data & Vacation Rental Statistics in St. Gallen, Switzerland
Is Airbnb profitable in Flums in 2026? Explore comprehensive Airbnb analytics for Flums, St. Gallen, Switzerland to uncover income potential. This 2026 STR market report for Flums, based on AirROI data from February 2025 to January 2026, reveals key trends in the niche market of 69 active listings.
Whether you're considering an Airbnb investment in Flums, optimizing your existing vacation rental, or exploring rental arbitrage opportunities, understanding the Flums Airbnb data is crucial. Leveraging the low regulation environment is key to maximizing your short term rental income potential. Let's dive into the specifics.
Key Flums Airbnb Performance Metrics Overview
Monthly Airbnb Revenue Variations & Income Potential in Flums (2026)
Understanding the monthly revenue variations for Airbnb listings in Flums is key to maximizing your short term rental income potential. Seasonality significantly impacts earnings. Our analysis, based on data from the past 12 months, shows that the peak revenue month for STRs in Flums is typically February, while September often presents the lowest earnings, highlighting opportunities for strategic pricing adjustments during shoulder and low seasons. Explore the typical Airbnb income in Flums across different performance tiers:
- Best-in-class properties (Top 10%) achieve $5,314+ monthly, often utilizing dynamic pricing and superior guest experiences.
- Strong performing properties (Top 25%) earn $3,817 or more, indicating effective management and desirable locations/amenities.
- Typical properties (Median) generate around $2,119 per month, representing the average market performance.
- Entry-level properties (Bottom 25%) see earnings around $1,157, often with potential for optimization.
Average Monthly Airbnb Earnings Trend in Flums
Flums Airbnb Occupancy Rate Trends (2026)
Maximize your bookings by understanding the Flums STR occupancy trends. Seasonal demand shifts significantly influence how often properties are booked. Typically, Februarysees the highest demand (peak season occupancy), while November experiences the lowest (low season). Effective strategies, like adjusting minimum stays or offering promotions, can boost occupancy during slower periods. Here's how different property tiers perform in Flums:
- Best-in-class properties (Top 10%) achieve 67%+ occupancy, indicating high desirability and potentially optimized availability.
- Strong performing properties (Top 25%) maintain 52% or higher occupancy, suggesting good market fit and guest satisfaction.
- Typical properties (Median) have an occupancy rate around 30%.
- Entry-level properties (Bottom 25%) average 18% occupancy, potentially facing higher vacancy.
Average Monthly Occupancy Rate Trend in Flums
Average Daily Rate (ADR) Airbnb Trends in Flums (2026)
Effective short term rental pricing strategy in Flums involves understanding monthly ADR fluctuations. The Average Daily Rate (ADR) for Airbnb in Flums typically peaks in December and dips lowest during April. Leveraging Airbnb dynamic pricing tools or strategies based on this seasonality can significantly boost revenue. Here's a look at the typical nightly rates achieved:
- Best-in-class properties (Top 10%) command rates of $422+ per night, often due to premium features or locations.
- Strong performing properties (Top 25%) achieve nightly rates of $345 or more.
- Typical properties (Median) charge around $210 per night.
- Entry-level properties (Bottom 25%) earn around $140 per night.
Average Daily Rate (ADR) Trend by Month in Flums
Get Live Flums Market Intelligence 👇

Explore Real-time Analytics
Airbnb Seasonality Analysis & Trends in Flums (2026)
Peak Season (February, March, July)
- Revenue averages $4,245 per month
- Occupancy rates average 53.5%
- Daily rates average $246
Shoulder Season
- Revenue averages $2,429 per month
- Occupancy maintains around 32.3%
- Daily rates hold near $250
Low Season (May, September, November)
- Revenue drops to average $1,733 per month
- Occupancy decreases to average 24.5%
- Daily rates adjust to average $247
Seasonality Insights for Flums
- The Airbnb seasonality in Flums shows highly seasonal trends requiring careful strategy. While the sections above show seasonal averages, it's also insightful to look at the extremes:
- During the high season, the absolute peak month showcases Flums's highest earning potential, with monthly revenues capable of climbing to $5,515, occupancy reaching a high of 69.4%, and ADRs peaking at $265.
- Conversely, the slowest single month of the year, typically falling within the low season, marks the market's lowest point. In this month, revenue might dip to $1,640, occupancy could drop to 21.5%, and ADRs may adjust down to $234.
- Understanding both the seasonal averages and these monthly peaks and troughs in revenue, occupancy, and ADR is crucial for maximizing your Airbnb profit potential in Flums.
Seasonal Strategies for Maximizing Profit
- Peak Season: Maximize revenue through premium pricing and potentially longer minimum stays. Ensure high availability.
- Low Season: Offer competitive pricing, special promotions (e.g., extended stay discounts), and flexible cancellation policies. Target off-season travelers like remote workers or budget-conscious guests.
- Shoulder Seasons: Implement dynamic pricing that balances peak and low rates. Target weekend travelers or specific events. Offer slightly more flexible terms than peak season.
- Regularly analyze your own performance against these Flums seasonality benchmarks and adjust your pricing and availability strategy accordingly.
Best Areas for Airbnb Investment in Flums (2026)
Exploring the top neighborhoods for short-term rentals in Flums? This section highlights key areas, outlining why they are attractive for hosts and guests, along with notable local attractions. Consider these locations based on your target guest profile and investment strategy.
| Neighborhood / Area | Why Host Here? (Target Guests & Appeal) | Key Attractions & Landmarks |
|---|---|---|
| Flumserberg | A popular ski resort area with beautiful mountains and great skiing opportunities. It's perfect for attracting winter sports enthusiasts and summer hikers alike. | Flumserberg Ski Resort, Lake Walensee, Tannenboden Alpine Coaster, Hiking trails, Mountain biking routes, Panoramic views from the mountains |
| Flums Town Center | The charming town center offers a mix of quaint shops, local restaurants, and easy access to transportation. It's ideal for guests looking for both convenience and local culture. | Flums Historical Museum, Local markets, Cafés and restaurants, Shopping streets, Proximity to public transport |
| Toggenburg Valley | An area known for its stunning landscape and outdoor activities. Ideal for nature lovers and those seeking a peaceful retreat while still being close to amenities. | Toggenburg Ski Area, Hiking paths, Cross-country skiing trails, Wildlife watching, Scenic landscapes, Local farms and cheese makers |
| Walensee Lakeside | The beautiful lakeside location offers stunning views and various water activities, making it perfect for summer stays and outdoor relaxation. | Walensee, Water sports, Hiking trails around the lake, Restaurants with lake views, Beach areas, Boat trips |
| Zürichsee (Lake Zurich) | A bit farther but offers a connection to the city of Zurich. It's an attractive spot for those looking to be near a larger urban area while enjoying nature. | Lake Zurich boat tours, Cafés along the lake, Cycling paths, Proximity to Zurich city, Scenic views, Parks and recreational areas |
| Rotmonten | A residential area with a local charm, appealing to those who prefer a quieter stay while still being close to Flums attractions. | Local parks, Residential vibe, Community events, Access to local shops, Close to trails |
| Mels | A nearby town that offers a mix of both urban and rural experiences, providing a gateway to the scenic beauty of the region. | Mels Castle, Access to hiking trails, Local dining options, Cultural festivals, Market events |
| Sargans | Known for its historical sites and beautiful surroundings, it's attractive for history buffs and those wanting to explore the region's culture. | Sargans Castle, Historical museums, Cultural sites, Hiking opportunities, Mountain trails |
Understanding Airbnb License Requirements & STR Laws in Flums (2026)
While Flums, St. Gallen, Switzerland currently shows low STR regulations, specific Airbnb license requirements might still exist or change. Always verify the latest short term rental regulations and Airbnb license requirements directly with local government authorities for Flums to ensure full compliance before hosting.
(Source: AirROI data, 2026, based on 1% licensed listings)
Top Performing Airbnb Properties in Flums (2026)
Benchmark your potential! Explore examples of top-performing Airbnb properties in Flumsbased on Trailing Twelve Month (TTM) revenue. Analyze their characteristics, revenue, occupancy rate, and ADR to understand what drives success in this market.
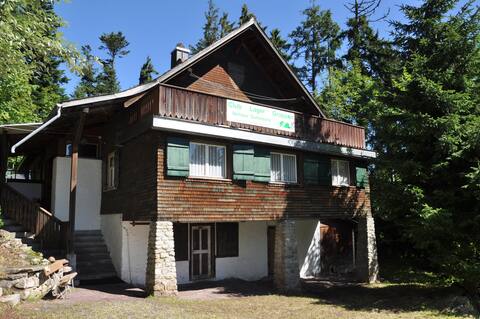
Entire house - cozy - Flumserberg - Tannenheim
Entire Place • 4 bedrooms

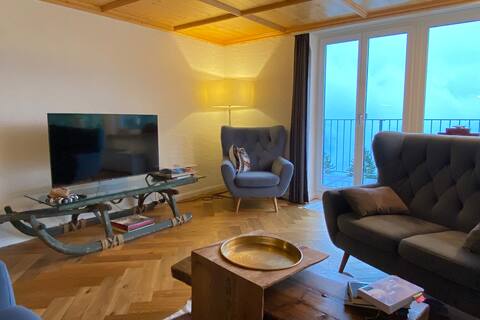
My Swiss Ski Chalet, the largest on the mountain
Entire Place • 5 bedrooms
Churfirsten Panorama - CharmingStay
Entire Place • 3 bedrooms

Sunnähof
Entire Place • 5 bedrooms

Chalet Wiesehöckli - Charming Stay
Entire Place • 2 bedrooms

My Swiss Ski Chalet
Entire Place • 4 bedrooms
Note: Performance varies based on location, size, amenities, seasonality, and management quality. Data reflects the past 12 months.
Top Performing Airbnb Hosts in Flums (2026)
Learn from the best! This table showcases top-performing Airbnb hosts in Flums based on the number of properties managed and estimated total revenue over the past year. Analyze their scale and performance metrics.
| Host Name | Properties | Grossing Revenue | Stay Reviews | Avg Rating |
|---|---|---|---|---|
| CharmingStay | 20 | $510,740 | 48 | 4.53/5.0 |
| Gary Robert Owen | 3 | $147,027 | 114 | 4.68/5.0 |
| Gabriel | 4 | $128,155 | 195 | 4.79/5.0 |
| Heidi | 2 | $90,136 | 292 | 4.96/5.0 |
| Nadja | 1 | $89,744 | 78 | 4.94/5.0 |
| Susanne | 2 | $55,901 | 39 | 4.95/5.0 |
| Fabian | 2 | $49,270 | 106 | 4.93/5.0 |
| Franco | 1 | $42,043 | 56 | 4.77/5.0 |
| Marzia | 2 | $36,304 | 74 | 4.96/5.0 |
| Claudia | 1 | $36,273 | 23 | 4.91/5.0 |
Analyzing the strategies of top hosts, such as their property selection, pricing, and guest communication, can offer valuable lessons for optimizing your own Airbnb operations in Flums.
Dive Deeper: Advanced Flums STR Market Data (2026)
Ready to unlock more insights? AirROI provides access to advanced metrics and comprehensive Airbnb data for Flums. Explore detailed analytics beyond this report to refine your investment strategy, optimize pricing, and maximize your vacation rental profits.
Explore Advanced MetricsFlums Short-Term Rental Market Composition (2026): Property & Room Types
Room Type Distribution
Property Type Distribution
Market Composition Insights for Flums
- The Flums Airbnb market composition is heavily skewed towards Entire Home/Apt listings, which make up 94.2% of the 69 active rentals. This indicates strong guest preference for privacy and space.
- Looking at the property type distribution in Flums, Apartment/Condo properties are the most common (63.8%), reflecting the local real estate landscape.
- Houses represent a significant 31.9% portion, catering likely to families or larger groups.
- Smaller segments like unique stays, outdoor/unique (combined 4.3%) offer potential for unique stay experiences.
Flums Airbnb Room Capacity Analysis (2026): Bedroom Distribution
Distribution of Listings by Number of Bedrooms
Room Capacity Insights for Flums
- The dominant room capacity in Flums is 1 bedroom listings, making up 34.8% of the market. This suggests a strong demand for properties suitable for couples or solo travelers.
- Together, 1 bedroom and 2 bedrooms properties represent 62.3% of the active Airbnb listings in Flums, indicating a high concentration in these sizes.
- A significant 24.6% of listings offer 3+ bedrooms, catering to larger groups and families seeking more space in Flums.
Flums Vacation Rental Guest Capacity Trends (2026)
Distribution of Listings by Guest Capacity
Guest Capacity Insights for Flums
- The most common guest capacity trend in Flums vacation rentals is listings accommodating 4 guests (39.1%). This suggests the primary traveler segment is likely small families or groups.
- Properties designed for 4 guests and 8+ guests dominate the Flums STR market, accounting for 53.6% of listings.
- 33.3% of properties accommodate 6+ guests, serving the market segment for larger families or group travel in Flums.
- On average, properties in Flums are equipped to host 4.7 guests.
Flums Airbnb Booking Patterns (2026): Available vs. Booked Days
Available Days Distribution
Booked Days Distribution
Booking Pattern Insights for Flums
- The most common availability pattern in Flums falls within the 271-366 days range, representing 58% of listings. This suggests many properties have significant open periods on their calendars.
- Approximately 88.4% of listings show high availability (181+ days open annually), indicating potential for increased bookings or specific owner usage patterns.
- For booked days, the 31-90 days range is most frequent in Flums (40.6%), reflecting common guest stay durations or potential owner blocking patterns.
- A notable 11.6% of properties secure long booking periods (181+ days booked per year), highlighting successful long-term rental strategies or significant owner usage.
Flums Airbnb Minimum Stay Requirements Analysis
Distribution of Listings by Minimum Night Requirement
1 Night
10 listings
14.5% of total
2 Nights
28 listings
40.6% of total
3 Nights
5 listings
7.2% of total
4-6 Nights
7 listings
10.1% of total
7-29 Nights
2 listings
2.9% of total
30+ Nights
17 listings
24.6% of total
Key Insights
- The most prevalent minimum stay requirement in Flums is 2 Nights, adopted by 40.6% of listings. This highlights the market's preference for shorter, flexible bookings.
- A significant segment (24.6%) caters to monthly stays (30+ nights) in Flums, pointing to opportunities in the extended-stay market.
Recommendations
- Align with the market by considering a 2 Nights minimum stay, as 40.6% of Flums hosts use this setting.
- If feasible, allowing 1-night stays, especially midweek or during low season, could capture last-minute bookings, as only 14.5% currently do.
- A 2-night minimum appears standard (40.6%). Consider this for weekends or peak periods.
- Explore offering discounts for stays of 30+ nights to attract the 24.6% of the market seeking extended stays.
- Adjust minimum nights based on seasonality – potentially shorter during low season and longer during peak demand periods in Flums.
Flums Airbnb Cancellation Policy Trends Analysis (2026)
Flexible
7 listings
10.1% of total
Moderate
11 listings
15.9% of total
Firm
22 listings
31.9% of total
Strict
29 listings
42% of total
Cancellation Policy Insights for Flums
- The prevailing Airbnb cancellation policy trend in Flums is Strict, used by 42% of listings.
- A majority (73.9%) of hosts in Flums utilize Firm or Strict policies, indicating a market where hosts prioritize booking security.
Recommendations for Hosts
- Consider adopting a Strict policy to align with the 42% market standard in Flums.
- With 42% using Strict terms, this is a viable option in Flums, particularly for high-value properties or during peak demand periods.
- Regularly review your cancellation policy against competitors and market demand shifts in Flums.
Flums STR Booking Lead Time Analysis (2026)
Average Booking Lead Time by Month
Booking Lead Time Insights for Flums
- The overall average booking lead time for vacation rentals in Flums is 79 days.
- Guests book furthest in advance for stays during January (average 138 days), likely coinciding with peak travel demand or local events.
- The shortest booking windows occur for stays in November (average 16 days), indicating more last-minute travel plans during this time.
- Seasonally, Winter (111 days avg.) sees the longest lead times, while Fall (35 days avg.) has the shortest, reflecting typical travel planning cycles.
Recommendations for Hosts
- Use the overall average lead time (79 days) as a baseline for your pricing and availability strategy in Flums.
- For January stays, consider implementing length-of-stay discounts or slightly higher rates for bookings made less than 138 days out to capitalize on advance planning.
- Target marketing efforts for the Winter season well in advance (at least 111 days) to capture early planners.
- Monitor your own booking lead times against these Flums averages to identify opportunities for dynamic pricing adjustments.
Popular & Essential Airbnb Amenities in Flums (2026)
Amenity Prevalence
Amenity Insights for Flums
- Essential amenities in Flums that guests expect include: Free parking on premises, Hot water. Lacking these (any) could significantly impact bookings.
- Popular amenities like Heating, Kitchen, Refrigerator are common but not universal. Offering these can provide a competitive edge.
- Warning: Wifi is not universally provided but is considered essential globally. Ensure reliable Wifi is offered.
Recommendations for Hosts
- Ensure your listing includes all essential amenities for Flums: Free parking on premises, Hot water.
- Prioritize adding missing essentials: Free parking on premises, Hot water.
- Consider adding popular differentiators like Heating or Kitchen to increase appeal.
- Highlight unique or less common amenities you offer (e.g., hot tub, dedicated workspace, EV charger) in your listing description and photos.
- Regularly check competitor amenities in Flums to stay competitive.
Flums Airbnb Guest Demographics & Profile Analysis (2026)
Guest Profile Summary for Flums
- The typical guest profile for Airbnb in Flums consists of a mix of domestic (53%) and international guests, often arriving from nearby Zürich, typically belonging to the Post-2000s (Gen Z/Alpha) group (50%), primarily speaking English or German.
- Domestic travelers account for 53.0% of guests.
- Key international markets include Switzerland (53%) and Germany (14.7%).
- Top languages spoken are English (35.2%) followed by German (26.2%).
- A significant demographic segment is the Post-2000s (Gen Z/Alpha) group, representing 50% of guests.
Recommendations for Hosts
- Balance marketing efforts between domestic and international channels based on the guest mix.
- Tailor amenities and listing descriptions to appeal to the dominant Post-2000s (Gen Z/Alpha) demographic (e.g., highlight fast WiFi, smart home features, local guides).
- Highlight unique local experiences or amenities relevant to the primary guest profile.
- Consider seasonal promotions aligned with peak travel times for key origin markets.
Nearby Short-Term Rental Market Comparison
How does the Flums Airbnb market stack up against its neighbors? Compare key performance metrics like average monthly revenue, ADR, and occupancy rates in surrounding areas to understand the broader regional STR landscape.
| Market | Active Properties | Monthly Revenue | Daily Rate | Avg. Occupancy |
|---|---|---|---|---|
| Brienzwiler | 11 | $7,335 | $514.27 | 60% |
| Grindelwald | 513 | $5,587 | $396.62 | 56% |
| Bassersdorf | 16 | $5,337 | $431.59 | 46% |
| Balderschwang | 10 | $5,253 | $304.03 | 58% |
| Vitznau | 31 | $4,688 | $425.43 | 45% |
| Lucerne | 329 | $4,288 | $310.00 | 53% |
| Ingenbohl | 14 | $4,251 | $219.49 | 63% |
| Brienz (BE) | 157 | $4,232 | $331.88 | 50% |
| Flüelen | 11 | $3,911 | $313.02 | 57% |
| Schwanden bei Brienz | 21 | $3,891 | $254.22 | 63% |