Verzasca Airbnb Market Analysis 2026: Short Term Rental Data & Vacation Rental Statistics in Ticino, Switzerland
Is Airbnb profitable in Verzasca in 2026? Explore comprehensive Airbnb analytics for Verzasca, Ticino, Switzerland to uncover income potential. This 2026 STR market report for Verzasca, based on AirROI data from February 2025 to January 2026, reveals key trends in the niche market of 75 active listings.
Whether you're considering an Airbnb investment in Verzasca, optimizing your existing vacation rental, or exploring rental arbitrage opportunities, understanding the Verzasca Airbnb data is crucial. Navigating the high regulation landscape is key to maximizing your short term rental income potential. Let's dive into the specifics.
Key Verzasca Airbnb Performance Metrics Overview
Monthly Airbnb Revenue Variations & Income Potential in Verzasca (2026)
Understanding the monthly revenue variations for Airbnb listings in Verzasca is key to maximizing your short term rental income potential. Seasonality significantly impacts earnings. Our analysis, based on data from the past 12 months, shows that the peak revenue month for STRs in Verzasca is typically July, while December often presents the lowest earnings, highlighting opportunities for strategic pricing adjustments during shoulder and low seasons. Explore the typical Airbnb income in Verzasca across different performance tiers:
- Best-in-class properties (Top 10%) achieve $5,862+ monthly, often utilizing dynamic pricing and superior guest experiences.
- Strong performing properties (Top 25%) earn $3,920 or more, indicating effective management and desirable locations/amenities.
- Typical properties (Median) generate around $2,368 per month, representing the average market performance.
- Entry-level properties (Bottom 25%) see earnings around $1,187, often with potential for optimization.
Average Monthly Airbnb Earnings Trend in Verzasca
Verzasca Airbnb Occupancy Rate Trends (2026)
Maximize your bookings by understanding the Verzasca STR occupancy trends. Seasonal demand shifts significantly influence how often properties are booked. Typically, Julysees the highest demand (peak season occupancy), while December experiences the lowest (low season). Effective strategies, like adjusting minimum stays or offering promotions, can boost occupancy during slower periods. Here's how different property tiers perform in Verzasca:
- Best-in-class properties (Top 10%) achieve 76%+ occupancy, indicating high desirability and potentially optimized availability.
- Strong performing properties (Top 25%) maintain 60% or higher occupancy, suggesting good market fit and guest satisfaction.
- Typical properties (Median) have an occupancy rate around 38%.
- Entry-level properties (Bottom 25%) average 21% occupancy, potentially facing higher vacancy.
Average Monthly Occupancy Rate Trend in Verzasca
Average Daily Rate (ADR) Airbnb Trends in Verzasca (2026)
Effective short term rental pricing strategy in Verzasca involves understanding monthly ADR fluctuations. The Average Daily Rate (ADR) for Airbnb in Verzasca typically peaks in August and dips lowest during February. Leveraging Airbnb dynamic pricing tools or strategies based on this seasonality can significantly boost revenue. Here's a look at the typical nightly rates achieved:
- Best-in-class properties (Top 10%) command rates of $329+ per night, often due to premium features or locations.
- Strong performing properties (Top 25%) achieve nightly rates of $247 or more.
- Typical properties (Median) charge around $193 per night.
- Entry-level properties (Bottom 25%) earn around $150 per night.
Average Daily Rate (ADR) Trend by Month in Verzasca
Get Live Verzasca Market Intelligence 👇

Explore Real-time Analytics
Airbnb Seasonality Analysis & Trends in Verzasca (2026)
Peak Season (July, August, April)
- Revenue averages $4,288 per month
- Occupancy rates average 56.9%
- Daily rates average $219
Shoulder Season
- Revenue averages $2,746 per month
- Occupancy maintains around 40.3%
- Daily rates hold near $211
Low Season (January, May, December)
- Revenue drops to average $1,916 per month
- Occupancy decreases to average 28.2%
- Daily rates adjust to average $215
Seasonality Insights for Verzasca
- The Airbnb seasonality in Verzasca shows highly seasonal trends requiring careful strategy. While the sections above show seasonal averages, it's also insightful to look at the extremes:
- During the high season, the absolute peak month showcases Verzasca's highest earning potential, with monthly revenues capable of climbing to $5,002, occupancy reaching a high of 63.2%, and ADRs peaking at $227.
- Conversely, the slowest single month of the year, typically falling within the low season, marks the market's lowest point. In this month, revenue might dip to $1,766, occupancy could drop to 24.0%, and ADRs may adjust down to $193.
- Understanding both the seasonal averages and these monthly peaks and troughs in revenue, occupancy, and ADR is crucial for maximizing your Airbnb profit potential in Verzasca.
Seasonal Strategies for Maximizing Profit
- Peak Season: Maximize revenue through premium pricing and potentially longer minimum stays. Ensure high availability.
- Low Season: Offer competitive pricing, special promotions (e.g., extended stay discounts), and flexible cancellation policies. Target off-season travelers like remote workers or budget-conscious guests.
- Shoulder Seasons: Implement dynamic pricing that balances peak and low rates. Target weekend travelers or specific events. Offer slightly more flexible terms than peak season.
- Regularly analyze your own performance against these Verzasca seasonality benchmarks and adjust your pricing and availability strategy accordingly.
Best Areas for Airbnb Investment in Verzasca (2026)
Exploring the top neighborhoods for short-term rentals in Verzasca? This section highlights key areas, outlining why they are attractive for hosts and guests, along with notable local attractions. Consider these locations based on your target guest profile and investment strategy.
| Neighborhood / Area | Why Host Here? (Target Guests & Appeal) | Key Attractions & Landmarks |
|---|---|---|
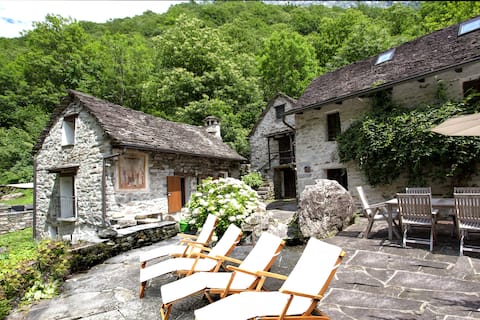
| Verzasca Valley | A stunningly beautiful valley known for its turquoise river and picturesque villages, making it a popular destination for nature lovers and hikers. | Verzasca River, Lavertezzo, The Roman Bridge, Gordola, Sonogno, Verzasca Dam |
| Sonogno | A charming village with traditional stone houses and surrounded by impressive mountain scenery, ideal for those looking for tranquility and nature. | Sonogno Village, Valle Verzasca Museum, Hiking Trails |
| Lavertezzo | Famous for its scenic beauty and the beautiful double-arched stone bridge, it's a hit with photographers and visitors looking for stunning views. | Ponte dei Salti, Verzasca River beach, Hiking Trails |
| Giubiasco | A convenient base for exploring the entire Verzasca region with good transport links and access to various outdoor activities. | Outdoor Activities, Lakes and Parks |
| Locarno | A charming lakeside town known for its mild climate and annual film festival, perfect for tourists and vacationers seeking entertainment and leisure. | Locarno Film Festival, Piazza Grande, Castle of Locarno, Lakeside Promenade |
| Ascona | Known for its Mediterranean-style old town and beautiful lakefront, it attracts tourists looking for a stylish and relaxing getaway. | Ascona Old Town, Lake Maggiore, Museums and Galleries |
| Trevano | A peaceful village in the mountains with easy access to hiking trails and breathtaking views, ideal for those seeking solitude and nature. | Hiking Trails, Mountain Views |
| Brissago Islands | A set of islands in Lake Maggiore, known for their botanical gardens and stunning scenery, attracting nature lovers and tourists. | Brissago Botanical Gardens, Lake Activities, Scenic Views |
Understanding Airbnb License Requirements & STR Laws in Verzasca (2026)
Yes, Verzasca, Ticino, Switzerland enforces high STR regulations. Obtaining a license and ensuring compliance is almost certainly required according to current 2026 STR laws. Always verify the latest short term rental regulations and Airbnb license requirements directly with local government authorities for Verzasca to ensure full compliance before hosting.
(Source: AirROI data, 2026, based on 59% licensed listings)
Top Performing Airbnb Properties in Verzasca (2026)
Benchmark your potential! Explore examples of top-performing Airbnb properties in Verzascabased on Trailing Twelve Month (TTM) revenue. Analyze their characteristics, revenue, occupancy rate, and ADR to understand what drives success in this market.

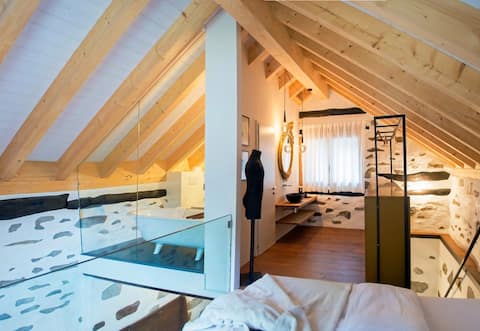
Verzasca Lodge Matilde - Hidden paradise!
Entire Place • 2 bedrooms
Verzasca Lodge Ofelia - Direct access to the river!
Entire Place • 3 bedrooms
Private vacation village with a view, 2 Rustici
Entire Place • 3 bedrooms

Typical house in the heart of beautiful Verzasca Valley
Entire Place • 6 bedrooms

Verzasca Lodge Cassiopea - Amazing View!
Entire Place • 3 bedrooms

Verzasca Lodge Carlotta - Timeless Home
Entire Place • 3 bedrooms
Note: Performance varies based on location, size, amenities, seasonality, and management quality. Data reflects the past 12 months.
Top Performing Airbnb Hosts in Verzasca (2026)
Learn from the best! This table showcases top-performing Airbnb hosts in Verzasca based on the number of properties managed and estimated total revenue over the past year. Analyze their scale and performance metrics.
| Host Name | Properties | Grossing Revenue | Stay Reviews | Avg Rating |
|---|---|---|---|---|
| Giulio | 6 | $385,045 | 180 | 4.94/5.0 |
| Christian | 8 | $144,762 | 42 | 4.52/5.0 |
| Davide | 4 | $125,634 | 231 | 4.82/5.0 |
| Rosolino | 2 | $81,907 | 56 | 4.67/5.0 |
| Philippe | 1 | $74,444 | 101 | 4.97/5.0 |
| Quokka Team | 3 | $60,214 | 59 | 4.47/5.0 |
| Claudia - Interhome | 4 | $54,839 | 33 | 4.91/5.0 |
| Giordano | 1 | $49,194 | 154 | 4.83/5.0 |
| Roberta- | 1 | $47,675 | 32 | 4.94/5.0 |
| Alicja | 1 | $45,673 | 110 | 4.26/5.0 |
Analyzing the strategies of top hosts, such as their property selection, pricing, and guest communication, can offer valuable lessons for optimizing your own Airbnb operations in Verzasca.
Dive Deeper: Advanced Verzasca STR Market Data (2026)
Ready to unlock more insights? AirROI provides access to advanced metrics and comprehensive Airbnb data for Verzasca. Explore detailed analytics beyond this report to refine your investment strategy, optimize pricing, and maximize your vacation rental profits.
Explore Advanced MetricsVerzasca Short-Term Rental Market Composition (2026): Property & Room Types
Room Type Distribution
Property Type Distribution
Market Composition Insights for Verzasca
- The Verzasca Airbnb market composition is heavily skewed towards Entire Home/Apt listings, which make up 90.7% of the 75 active rentals. This indicates strong guest preference for privacy and space.
- Looking at the property type distribution in Verzasca, House properties are the most common (73.3%), reflecting the local real estate landscape.
- Houses represent a significant 73.3% portion, catering likely to families or larger groups.
- The presence of 6.7% Hotel/Boutique listings indicates integration with traditional hospitality.
Verzasca Airbnb Room Capacity Analysis (2026): Bedroom Distribution
Distribution of Listings by Number of Bedrooms
Room Capacity Insights for Verzasca
- The dominant room capacity in Verzasca is 2 bedrooms listings, making up 37.3% of the market. This suggests a strong demand for properties suitable for couples or solo travelers.
- Together, 2 bedrooms and 3 bedrooms properties represent 66.6% of the active Airbnb listings in Verzasca, indicating a high concentration in these sizes.
- A significant 34.6% of listings offer 3+ bedrooms, catering to larger groups and families seeking more space in Verzasca.
Verzasca Vacation Rental Guest Capacity Trends (2026)
Distribution of Listings by Guest Capacity
Guest Capacity Insights for Verzasca
- The most common guest capacity trend in Verzasca vacation rentals is listings accommodating 4 guests (33.3%). This suggests the primary traveler segment is likely small families or groups.
- Properties designed for 4 guests and 6 guests dominate the Verzasca STR market, accounting for 56.0% of listings.
- 30.7% of properties accommodate 6+ guests, serving the market segment for larger families or group travel in Verzasca.
- On average, properties in Verzasca are equipped to host 4.5 guests.
Verzasca Airbnb Booking Patterns (2026): Available vs. Booked Days
Available Days Distribution
Booked Days Distribution
Booking Pattern Insights for Verzasca
- The most common availability pattern in Verzasca falls within the 271-366 days range, representing 45.3% of listings. This suggests many properties have significant open periods on their calendars.
- Approximately 85.3% of listings show high availability (181+ days open annually), indicating potential for increased bookings or specific owner usage patterns.
- For booked days, the 91-180 days range is most frequent in Verzasca (40%), reflecting common guest stay durations or potential owner blocking patterns.
- A notable 16.0% of properties secure long booking periods (181+ days booked per year), highlighting successful long-term rental strategies or significant owner usage.
Verzasca Airbnb Minimum Stay Requirements Analysis
Distribution of Listings by Minimum Night Requirement
1 Night
9 listings
12% of total
2 Nights
10 listings
13.3% of total
3 Nights
12 listings
16% of total
4-6 Nights
14 listings
18.7% of total
30+ Nights
30 listings
40% of total
Key Insights
- The most prevalent minimum stay requirement in Verzasca is 30+ Nights, adopted by 40% of listings. This highlights the market's preference for longer commitments.
- A significant segment (40%) caters to monthly stays (30+ nights) in Verzasca, pointing to opportunities in the extended-stay market.
Recommendations
- Align with the market by considering a 30+ Nights minimum stay, as 40% of Verzasca hosts use this setting.
- If feasible, allowing 1-night stays, especially midweek or during low season, could capture last-minute bookings, as only 12% currently do.
- Explore offering discounts for stays of 30+ nights to attract the 40% of the market seeking extended stays.
- Adjust minimum nights based on seasonality – potentially shorter during low season and longer during peak demand periods in Verzasca.
Verzasca Airbnb Cancellation Policy Trends Analysis (2026)
Super Strict 30 Days
1 listings
1.3% of total
Super Strict 60 Days
2 listings
2.7% of total
Limited
3 listings
4% of total
Flexible
10 listings
13.3% of total
Moderate
31 listings
41.3% of total
Firm
25 listings
33.3% of total
Strict
3 listings
4% of total
Cancellation Policy Insights for Verzasca
- The prevailing Airbnb cancellation policy trend in Verzasca is Moderate, used by 41.3% of listings.
- There's a relatively balanced mix between guest-friendly (54.6%) and stricter (37.3%) policies, offering choices for different guest needs.
- Strict cancellation policies are quite rare (4%), potentially making listings with this policy less competitive unless justified by high demand or property type.
Recommendations for Hosts
- Consider adopting a Moderate policy to align with the 41.3% market standard in Verzasca.
- Using a Strict policy might deter some guests, as only 4% of listings use it. Evaluate if potential revenue protection outweighs possible lower booking rates.
- Regularly review your cancellation policy against competitors and market demand shifts in Verzasca.
Verzasca STR Booking Lead Time Analysis (2026)
Average Booking Lead Time by Month
Booking Lead Time Insights for Verzasca
- The overall average booking lead time for vacation rentals in Verzasca is 72 days.
- Guests book furthest in advance for stays during July (average 90 days), likely coinciding with peak travel demand or local events.
- The shortest booking windows occur for stays in January (average 22 days), indicating more last-minute travel plans during this time.
- Seasonally, Summer (84 days avg.) sees the longest lead times, while Winter (52 days avg.) has the shortest, reflecting typical travel planning cycles.
Recommendations for Hosts
- Use the overall average lead time (72 days) as a baseline for your pricing and availability strategy in Verzasca.
- For July stays, consider implementing length-of-stay discounts or slightly higher rates for bookings made less than 90 days out to capitalize on advance planning.
- Target marketing efforts for the Summer season well in advance (at least 84 days) to capture early planners.
- Monitor your own booking lead times against these Verzasca averages to identify opportunities for dynamic pricing adjustments.
Popular & Essential Airbnb Amenities in Verzasca (2026)
Amenity Prevalence
Amenity Insights for Verzasca
- Essential amenities in Verzasca that guests expect include: Hot water. Lacking these (this) could significantly impact bookings.
- Popular amenities like Bed linens, Kitchen, Dishes and silverware are common but not universal. Offering these can provide a competitive edge.
Recommendations for Hosts
- Ensure your listing includes all essential amenities for Verzasca: Hot water.
- Prioritize adding missing essentials: Hot water.
- Consider adding popular differentiators like Bed linens or Kitchen to increase appeal.
- Highlight unique or less common amenities you offer (e.g., hot tub, dedicated workspace, EV charger) in your listing description and photos.
- Regularly check competitor amenities in Verzasca to stay competitive.
Verzasca Airbnb Guest Demographics & Profile Analysis (2026)
Guest Profile Summary for Verzasca
- The typical guest profile for Airbnb in Verzasca consists of a mix of domestic (54%) and international guests, often arriving from nearby Zürich, typically belonging to the Post-2000s (Gen Z/Alpha) group (50%), primarily speaking English or German.
- Domestic travelers account for 54.2% of guests.
- Key international markets include Switzerland (54.2%) and Germany (16.5%).
- Top languages spoken are English (34.4%) followed by German (27.5%).
- A significant demographic segment is the Post-2000s (Gen Z/Alpha) group, representing 50% of guests.
Recommendations for Hosts
- Balance marketing efforts between domestic and international channels based on the guest mix.
- Tailor amenities and listing descriptions to appeal to the dominant Post-2000s (Gen Z/Alpha) demographic (e.g., highlight fast WiFi, smart home features, local guides).
- Highlight unique local experiences or amenities relevant to the primary guest profile.
- Consider seasonal promotions aligned with peak travel times for key origin markets.
Nearby Short-Term Rental Market Comparison
How does the Verzasca Airbnb market stack up against its neighbors? Compare key performance metrics like average monthly revenue, ADR, and occupancy rates in surrounding areas to understand the broader regional STR landscape.
| Market | Active Properties | Monthly Revenue | Daily Rate | Avg. Occupancy |
|---|---|---|---|---|
| Brienzwiler | 11 | $7,335 | $514.27 | 60% |
| Niederried bei Interlaken | 19 | $6,267 | $552.03 | 44% |
| Lauterbrunnen | 552 | $6,108 | $487.83 | 51% |
| Ranco | 12 | $5,691 | $536.46 | 42% |
| Matten bei Interlaken | 64 | $5,607 | $336.51 | 59% |
| Grindelwald | 513 | $5,587 | $396.62 | 56% |
| Bassersdorf | 16 | $5,337 | $431.59 | 46% |
| Wengen | 12 | $5,115 | $595.38 | 46% |
| Oberhofen am Thunersee | 25 | $5,051 | $329.28 | 51% |
| Zermatt | 792 | $5,017 | $504.14 | 46% |