Finhaut Airbnb Market Analysis 2026: Short Term Rental Data & Vacation Rental Statistics in Wallis, Switzerland
Is Airbnb profitable in Finhaut in 2026? Explore comprehensive Airbnb analytics for Finhaut, Wallis, Switzerland to uncover income potential. This 2026 STR market report for Finhaut, based on AirROI data from June 2024 to May 2025, reveals key trends in the niche market of 18 active listings.
Whether you're considering an Airbnb investment in Finhaut, optimizing your existing vacation rental, or exploring rental arbitrage opportunities, understanding the Finhaut Airbnb data is crucial. Leveraging the low regulation environment is key to maximizing your short term rental income potential. Let's dive into the specifics.
Key Finhaut Airbnb Performance Metrics Overview
Monthly Airbnb Revenue Variations & Income Potential in Finhaut (2026)
Understanding the monthly revenue variations for Airbnb listings in Finhaut is key to maximizing your short term rental income potential. Seasonality significantly impacts earnings. Our analysis, based on data from the past 12 months, shows that the peak revenue month for STRs in Finhaut is typically December, while April often presents the lowest earnings, highlighting opportunities for strategic pricing adjustments during shoulder and low seasons. Explore the typical Airbnb income in Finhaut across different performance tiers:
- Best-in-class properties (Top 10%) achieve $2,688+ monthly, often utilizing dynamic pricing and superior guest experiences.
- Strong performing properties (Top 25%) earn $2,128 or more, indicating effective management and desirable locations/amenities.
- Typical properties (Median) generate around $1,150 per month, representing the average market performance.
- Entry-level properties (Bottom 25%) see earnings around $597, often with potential for optimization.
Average Monthly Airbnb Earnings Trend in Finhaut
Finhaut Airbnb Occupancy Rate Trends (2026)
Maximize your bookings by understanding the Finhaut STR occupancy trends. Seasonal demand shifts significantly influence how often properties are booked. Typically, Decembersees the highest demand (peak season occupancy), while April experiences the lowest (low season). Effective strategies, like adjusting minimum stays or offering promotions, can boost occupancy during slower periods. Here's how different property tiers perform in Finhaut:
- Best-in-class properties (Top 10%) achieve 68%+ occupancy, indicating high desirability and potentially optimized availability.
- Strong performing properties (Top 25%) maintain 49% or higher occupancy, suggesting good market fit and guest satisfaction.
- Typical properties (Median) have an occupancy rate around 28%.
- Entry-level properties (Bottom 25%) average 18% occupancy, potentially facing higher vacancy.
Average Monthly Occupancy Rate Trend in Finhaut
Average Daily Rate (ADR) Airbnb Trends in Finhaut (2026)
Effective short term rental pricing strategy in Finhaut involves understanding monthly ADR fluctuations. The Average Daily Rate (ADR) for Airbnb in Finhaut typically peaks in May and dips lowest during November. Leveraging Airbnb dynamic pricing tools or strategies based on this seasonality can significantly boost revenue. Here's a look at the typical nightly rates achieved:
- Best-in-class properties (Top 10%) command rates of $220+ per night, often due to premium features or locations.
- Strong performing properties (Top 25%) achieve nightly rates of $166 or more.
- Typical properties (Median) charge around $111 per night.
- Entry-level properties (Bottom 25%) earn around $91 per night.
Average Daily Rate (ADR) Trend by Month in Finhaut
Get Live Finhaut Market Intelligence 👇

Explore Real-time Analytics
Airbnb Seasonality Analysis & Trends in Finhaut (2025)
Peak Season (December, August, June)
- Revenue averages $1,778 per month
- Occupancy rates average 44.9%
- Daily rates average $124
Shoulder Season
- Revenue averages $1,401 per month
- Occupancy maintains around 34.1%
- Daily rates hold near $136
Low Season (April, October, November)
- Revenue drops to average $1,203 per month
- Occupancy decreases to average 29.2%
- Daily rates adjust to average $128
Seasonality Insights for Finhaut
- The Airbnb seasonality in Finhaut shows moderate seasonality with distinct peak and low periods. While the sections above show seasonal averages, it's also insightful to look at the extremes:
- During the high season, the absolute peak month showcases Finhaut's highest earning potential, with monthly revenues capable of climbing to $2,085, occupancy reaching a high of 46.2%, and ADRs peaking at $147.
- Conversely, the slowest single month of the year, typically falling within the low season, marks the market's lowest point. In this month, revenue might dip to $1,129, occupancy could drop to 26.7%, and ADRs may adjust down to $122.
- Understanding both the seasonal averages and these monthly peaks and troughs in revenue, occupancy, and ADR is crucial for maximizing your Airbnb profit potential in Finhaut.
Seasonal Strategies for Maximizing Profit
- Peak Season: Maximize revenue through premium pricing and potentially longer minimum stays. Ensure high availability.
- Low Season: Offer competitive pricing, special promotions (e.g., extended stay discounts), and flexible cancellation policies. Target off-season travelers like remote workers or budget-conscious guests.
- Shoulder Seasons: Implement dynamic pricing that balances peak and low rates. Target weekend travelers or specific events. Offer slightly more flexible terms than peak season.
- Regularly analyze your own performance against these Finhaut seasonality benchmarks and adjust your pricing and availability strategy accordingly.
Best Areas for Airbnb Investment in Finhaut (2026)
Exploring the top neighborhoods for short-term rentals in Finhaut? This section highlights key areas, outlining why they are attractive for hosts and guests, along with notable local attractions. Consider these locations based on your target guest profile and investment strategy.
| Neighborhood / Area | Why Host Here? (Target Guests & Appeal) | Key Attractions & Landmarks |
|---|---|---|
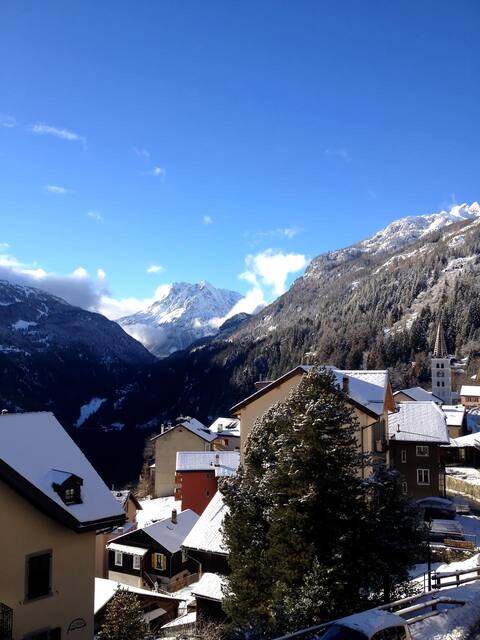
| Finhaut Center | The central area of Finhaut provides convenient access to local amenities and stunning views of the surrounding landscape. It's ideal for tourists looking for a village feel with easy access to nature. | Finhaut village, Scenic hiking trails, Nearby ski resorts, Restaurant La Crete, St. Michael's Church |
| Gietroz | A charming area known for its beautiful natural surroundings and tranquility. Perfect for nature lovers and those looking to escape into the Swiss Alps. | Gietroz waterfall, Hiking paths, Alpine views, Traditional Swiss chalets |
| Le Châtelard | A picturesque hillside area with breathtaking views of the Alps, ideal for visitors seeking adventure sports year-round, especially skiing and hiking. | Ski lifts, Hiking routes, Mountain biking trails, Farms and local food experiences |
| Valais | The greater Valais region offers diverse landscapes and activities, attracting tourists year-round for skiing, hiking, and wine tasting. | Aletsch Glacier, Wine routes, Thermal spas, Several ski resorts |
| Emosson Dam | Famous for its impressive dam and panoramic views, this area attracts tourists for both its engineering marvel and outdoor activities. | Emosson reservoir, Hiking trails, Aerial tramway, Scenic viewpoints |
| Mont Blanc Massif | The Mont Blanc Massif attracts outdoor enthusiasts and climbers from around the world, offering unparalleled beauty and adventure. | Mont Blanc, Mountain climbing, Hiking routes, Alpine flora and fauna |
| Chamonix | While just across the border in France, Chamonix is a major tourism hub for adventurers and skiers, significantly impacting the Finhaut area with shared tourist activities. | Aiguille du Midi, Chamonix ski area, Mer de Glace, Montenvers railway |
| Geneva Lake | The picturesque lake region attracts visitors for relaxation and cultural experiences, making it a great addition for Airbnb in the wider area. | Lake Geneva boat trips, Château de Chillon, Lavaux vineyards, Local festivals |
Understanding Airbnb License Requirements & STR Laws in Finhaut (2026)
While Finhaut, Wallis, Switzerland currently shows low STR regulations, specific Airbnb license requirements might still exist or change. Always verify the latest short term rental regulations and Airbnb license requirements directly with local government authorities for Finhaut to ensure full compliance before hosting.
(Source: AirROI data, 2026, finding no licensed listings among those analyzed)
Top Performing Airbnb Properties in Finhaut (2026)
Benchmark your potential! Explore examples of top-performing Airbnb properties in Finhautbased on Trailing Twelve Month (TTM) revenue. Analyze their characteristics, revenue, occupancy rate, and ADR to understand what drives success in this market.
Apartment in the center of the village of Finhaut
Entire Place • 3 bedrooms

Pink top floor house - Pink house top floor
Entire Place • 2 bedrooms

Bright apartment with nice view of the glacier
Entire Place • 2 bedrooms
Appartement de rêve pour famille
Entire Place • 2 bedrooms
House pink road level - Pink house road floor
Entire Place • 1 bedroom

Bekker Chalet - apartment with hottub & sauna
Entire Place • 2 bedrooms
Note: Performance varies based on location, size, amenities, seasonality, and management quality. Data reflects the past 12 months.
Top Performing Airbnb Hosts in Finhaut (2026)
Learn from the best! This table showcases top-performing Airbnb hosts in Finhaut based on the number of properties managed and estimated total revenue over the past year. Analyze their scale and performance metrics.
| Host Name | Properties | Grossing Revenue | Stay Reviews | Avg Rating |
|---|---|---|---|---|
| Joël | 2 | $43,320 | 107 | 4.71/5.0 |
| Fabio | 1 | $26,262 | 20 | 5.00/5.0 |
| Sandrine Et Olivier | 1 | $20,100 | 31 | 4.77/5.0 |
| Host #9933711 | 1 | $19,907 | 0 | Not Rated |
| Ilse | 1 | $17,247 | 263 | 4.83/5.0 |
| Marlene | 1 | $15,388 | 26 | 4.88/5.0 |
| Jacques | 1 | $14,216 | 18 | 4.94/5.0 |
| Floriane | 1 | $12,206 | 0 | Not Rated |
| Karin & Bjørn | 1 | $10,403 | 56 | 4.88/5.0 |
| Host #16676730 | 7 | $9,421 | 1 | Not Rated |
Analyzing the strategies of top hosts, such as their property selection, pricing, and guest communication, can offer valuable lessons for optimizing your own Airbnb operations in Finhaut.
Dive Deeper: Advanced Finhaut STR Market Data (2026)
Ready to unlock more insights? AirROI provides access to advanced metrics and comprehensive Airbnb data for Finhaut. Explore detailed analytics beyond this report to refine your investment strategy, optimize pricing, and maximize your vacation rental profits.
Explore Advanced MetricsFinhaut Short-Term Rental Market Composition (2026): Property & Room Types
Room Type Distribution
Property Type Distribution
Market Composition Insights for Finhaut
- The Finhaut Airbnb market composition is heavily skewed towards Entire Home/Apt listings, which make up 77.8% of the 18 active rentals. This indicates strong guest preference for privacy and space.
- Looking at the property type distribution in Finhaut, Apartment/Condo properties are the most common (66.7%), reflecting the local real estate landscape.
- The presence of 22.2% Hotel/Boutique listings indicates integration with traditional hospitality.
Finhaut Airbnb Room Capacity Analysis (2026): Bedroom Distribution
Distribution of Listings by Number of Bedrooms
Room Capacity Insights for Finhaut
- The dominant room capacity in Finhaut is 2 bedrooms listings, making up 50% of the market. This suggests a strong demand for properties suitable for couples or solo travelers.
- Together, 2 bedrooms and 1 bedroom properties represent 83.3% of the active Airbnb listings in Finhaut, indicating a high concentration in these sizes.
Finhaut Vacation Rental Guest Capacity Trends (2026)
Distribution of Listings by Guest Capacity
Guest Capacity Insights for Finhaut
- The most common guest capacity trend in Finhaut vacation rentals is listings accommodating 4 guests (33.3%). This suggests the primary traveler segment is likely small families or groups.
- Properties designed for 4 guests and 2 guests dominate the Finhaut STR market, accounting for 61.1% of listings.
- 22.3% of properties accommodate 6+ guests, serving the market segment for larger families or group travel in Finhaut.
- On average, properties in Finhaut are equipped to host 3.8 guests.
Finhaut Airbnb Booking Patterns (2026): Available vs. Booked Days
Available Days Distribution
Booked Days Distribution
Booking Pattern Insights for Finhaut
- The most common availability pattern in Finhaut falls within the 271-366 days range, representing 55.6% of listings. This suggests many properties have significant open periods on their calendars.
- Approximately 94.5% of listings show high availability (181+ days open annually), indicating potential for increased bookings or specific owner usage patterns.
- For booked days, the 1-30 days range is most frequent in Finhaut (44.4%), reflecting common guest stay durations or potential owner blocking patterns.
- A notable 11.1% of properties secure long booking periods (181+ days booked per year), highlighting successful long-term rental strategies or significant owner usage.
Finhaut Airbnb Minimum Stay Requirements Analysis
Distribution of Listings by Minimum Night Requirement
1 Night
3 listings
25% of total
2 Nights
2 listings
16.7% of total
3 Nights
1 listings
8.3% of total
4-6 Nights
2 listings
16.7% of total
7-29 Nights
2 listings
16.7% of total
30+ Nights
2 listings
16.7% of total
Key Insights
- The most prevalent minimum stay requirement in Finhaut is 1 Night, adopted by 25% of listings. This highlights the market's preference for shorter, flexible bookings.
- A significant segment (16.7%) caters to monthly stays (30+ nights) in Finhaut, pointing to opportunities in the extended-stay market.
Recommendations
- Align with the market by considering a 1 Night minimum stay, as 25% of Finhaut hosts use this setting.
- If feasible, allowing 1-night stays, especially midweek or during low season, could capture last-minute bookings, as only 25% currently do.
- Explore offering discounts for stays of 30+ nights to attract the 16.7% of the market seeking extended stays.
- Adjust minimum nights based on seasonality – potentially shorter during low season and longer during peak demand periods in Finhaut.
Finhaut Airbnb Cancellation Policy Trends Analysis (2026)
Flexible
2 listings
20% of total
Moderate
6 listings
60% of total
Strict
2 listings
20% of total
Cancellation Policy Insights for Finhaut
- The prevailing Airbnb cancellation policy trend in Finhaut is Moderate, used by 60% of listings.
- The market strongly favors guest-friendly terms, with 80.0% of listings offering Flexible or Moderate policies. This suggests guests in Finhaut may expect booking flexibility.
Recommendations for Hosts
- Consider adopting a Moderate policy to align with the 60% market standard in Finhaut.
- Regularly review your cancellation policy against competitors and market demand shifts in Finhaut.
Finhaut STR Booking Lead Time Analysis (2026)
Average Booking Lead Time by Month
Booking Lead Time Insights for Finhaut
- The overall average booking lead time for vacation rentals in Finhaut is 34 days.
- Guests book furthest in advance for stays during June (average 68 days), likely coinciding with peak travel demand or local events.
- The shortest booking windows occur for stays in April (average 14 days), indicating more last-minute travel plans during this time.
- Seasonally, Summer (51 days avg.) sees the longest lead times, while Fall (34 days avg.) has the shortest, reflecting typical travel planning cycles.
Recommendations for Hosts
- Use the overall average lead time (34 days) as a baseline for your pricing and availability strategy in Finhaut.
- For June stays, consider implementing length-of-stay discounts or slightly higher rates for bookings made less than 68 days out to capitalize on advance planning.
- During April, focus on last-minute booking availability and promotions, as guests book with very short notice (14 days avg.).
- Target marketing efforts for the Summer season well in advance (at least 51 days) to capture early planners.
- Monitor your own booking lead times against these Finhaut averages to identify opportunities for dynamic pricing adjustments.
Popular & Essential Airbnb Amenities in Finhaut (2026)
Amenity Prevalence
Amenity Insights for Finhaut
- Essential amenities in Finhaut that guests expect include: Essentials, Kitchen. Lacking these (any) could significantly impact bookings.
- Popular amenities like Heating, Hot water, Wifi are common but not universal. Offering these can provide a competitive edge.
- Warning: Wifi is not universally provided but is considered essential globally. Ensure reliable Wifi is offered.
Recommendations for Hosts
- Ensure your listing includes all essential amenities for Finhaut: Essentials, Kitchen.
- Consider adding popular differentiators like Heating or Hot water to increase appeal.
- Highlight unique or less common amenities you offer (e.g., hot tub, dedicated workspace, EV charger) in your listing description and photos.
- Regularly check competitor amenities in Finhaut to stay competitive.
Finhaut Airbnb Guest Demographics & Profile Analysis (2026)
Guest Profile Summary for Finhaut
- The typical guest profile for Airbnb in Finhaut consists of a mix of domestic (38%) and international guests, with top international origins including France, typically belonging to the Post-2000s (Gen Z/Alpha) group (50%), primarily speaking English or French.
- Domestic travelers account for 38.2% of guests.
- Key international markets include Switzerland (38.2%) and France (30.3%).
- Top languages spoken are English (39.1%) followed by French (26.4%).
- A significant demographic segment is the Post-2000s (Gen Z/Alpha) group, representing 50% of guests.
Recommendations for Hosts
- Focus marketing internationally, particularly towards travelers from France.
- Tailor amenities and listing descriptions to appeal to the dominant Post-2000s (Gen Z/Alpha) demographic (e.g., highlight fast WiFi, smart home features, local guides).
- Highlight unique local experiences or amenities relevant to the primary guest profile.
- Consider seasonal promotions aligned with peak travel times for key origin markets.
Nearby Short-Term Rental Market Comparison
How does the Finhaut Airbnb market stack up against its neighbors? Compare key performance metrics like average monthly revenue, ADR, and occupancy rates in surrounding areas to understand the broader regional STR landscape.
| Market | Active Properties | Monthly Revenue | Daily Rate | Avg. Occupancy |
|---|---|---|---|---|
| La Rivière-Enverse | 16 | $6,903 | $667.87 | 40% |
| Lauterbrunnen | 532 | $6,565 | $539.43 | 53% |
| Les Clefs | 30 | $5,385 | $320.80 | 42% |
| Habkern | 13 | $5,060 | $351.78 | 46% |
| Zermatt | 745 | $4,917 | $483.84 | 47% |
| Matten bei Interlaken | 57 | $4,695 | $307.57 | 58% |
| Interlaken | 303 | $4,480 | $314.40 | 54% |
| Iseltwald | 18 | $4,374 | $337.31 | 51% |
| Bönigen | 31 | $4,009 | $256.42 | 63% |
| Manigod | 198 | $3,992 | $438.15 | 40% |