Liddes Airbnb Market Analysis 2026: Short Term Rental Data & Vacation Rental Statistics in Wallis, Switzerland
Is Airbnb profitable in Liddes in 2026? Explore comprehensive Airbnb analytics for Liddes, Wallis, Switzerland to uncover income potential. This 2026 STR market report for Liddes, based on AirROI data from July 2024 to June 2025, reveals key trends in the niche market of 18 active listings.
Whether you're considering an Airbnb investment in Liddes, optimizing your existing vacation rental, or exploring rental arbitrage opportunities, understanding the Liddes Airbnb data is crucial. Leveraging the low regulation environment is key to maximizing your short term rental income potential. Let's dive into the specifics.
Key Liddes Airbnb Performance Metrics Overview
Monthly Airbnb Revenue Variations & Income Potential in Liddes (2026)
Understanding the monthly revenue variations for Airbnb listings in Liddes is key to maximizing your short term rental income potential. Seasonality significantly impacts earnings. Our analysis, based on data from the past 12 months, shows that the peak revenue month for STRs in Liddes is typically August, while November often presents the lowest earnings, highlighting opportunities for strategic pricing adjustments during shoulder and low seasons. Explore the typical Airbnb income in Liddes across different performance tiers:
- Best-in-class properties (Top 10%) achieve $2,597+ monthly, often utilizing dynamic pricing and superior guest experiences.
- Strong performing properties (Top 25%) earn $2,040 or more, indicating effective management and desirable locations/amenities.
- Typical properties (Median) generate around $1,202 per month, representing the average market performance.
- Entry-level properties (Bottom 25%) see earnings around $741, often with potential for optimization.
Average Monthly Airbnb Earnings Trend in Liddes
Liddes Airbnb Occupancy Rate Trends (2026)
Maximize your bookings by understanding the Liddes STR occupancy trends. Seasonal demand shifts significantly influence how often properties are booked. Typically, Augustsees the highest demand (peak season occupancy), while November experiences the lowest (low season). Effective strategies, like adjusting minimum stays or offering promotions, can boost occupancy during slower periods. Here's how different property tiers perform in Liddes:
- Best-in-class properties (Top 10%) achieve 74%+ occupancy, indicating high desirability and potentially optimized availability.
- Strong performing properties (Top 25%) maintain 60% or higher occupancy, suggesting good market fit and guest satisfaction.
- Typical properties (Median) have an occupancy rate around 37%.
- Entry-level properties (Bottom 25%) average 18% occupancy, potentially facing higher vacancy.
Average Monthly Occupancy Rate Trend in Liddes
Average Daily Rate (ADR) Airbnb Trends in Liddes (2026)
Effective short term rental pricing strategy in Liddes involves understanding monthly ADR fluctuations. The Average Daily Rate (ADR) for Airbnb in Liddes typically peaks in June and dips lowest during July. Leveraging Airbnb dynamic pricing tools or strategies based on this seasonality can significantly boost revenue. Here's a look at the typical nightly rates achieved:
- Best-in-class properties (Top 10%) command rates of $286+ per night, often due to premium features or locations.
- Strong performing properties (Top 25%) achieve nightly rates of $198 or more.
- Typical properties (Median) charge around $120 per night.
- Entry-level properties (Bottom 25%) earn around $106 per night.
Average Daily Rate (ADR) Trend by Month in Liddes
Get Live Liddes Market Intelligence 👇
Explore Real-time Analytics
Airbnb Seasonality Analysis & Trends in Liddes (2025)
Peak Season (August, July, February)
- Revenue averages $2,076 per month
- Occupancy rates average 57.3%
- Daily rates average $177
Shoulder Season
- Revenue averages $1,390 per month
- Occupancy maintains around 38.7%
- Daily rates hold near $186
Low Season (April, May, November)
- Revenue drops to average $862 per month
- Occupancy decreases to average 26.7%
- Daily rates adjust to average $191
Seasonality Insights for Liddes
- The Airbnb seasonality in Liddes shows highly seasonal trends requiring careful strategy. While the sections above show seasonal averages, it's also insightful to look at the extremes:
- During the high season, the absolute peak month showcases Liddes's highest earning potential, with monthly revenues capable of climbing to $2,238, occupancy reaching a high of 62.2%, and ADRs peaking at $217.
- Conversely, the slowest single month of the year, typically falling within the low season, marks the market's lowest point. In this month, revenue might dip to $445, occupancy could drop to 14.4%, and ADRs may adjust down to $161.
- Understanding both the seasonal averages and these monthly peaks and troughs in revenue, occupancy, and ADR is crucial for maximizing your Airbnb profit potential in Liddes.
Seasonal Strategies for Maximizing Profit
- Peak Season: Maximize revenue through premium pricing and potentially longer minimum stays. Ensure high availability.
- Low Season: Offer competitive pricing, special promotions (e.g., extended stay discounts), and flexible cancellation policies. Target off-season travelers like remote workers or budget-conscious guests.
- Shoulder Seasons: Implement dynamic pricing that balances peak and low rates. Target weekend travelers or specific events. Offer slightly more flexible terms than peak season.
- Regularly analyze your own performance against these Liddes seasonality benchmarks and adjust your pricing and availability strategy accordingly.
Best Areas for Airbnb Investment in Liddes (2026)
Exploring the top neighborhoods for short-term rentals in Liddes? This section highlights key areas, outlining why they are attractive for hosts and guests, along with notable local attractions. Consider these locations based on your target guest profile and investment strategy.
| Neighborhood / Area | Why Host Here? (Target Guests & Appeal) | Key Attractions & Landmarks |
|---|---|---|
| Liddes Center | The central area of Liddes offers easy access to local amenities, restaurants, and shops. It is ideal for guests looking for a blend of convenience and charm in the Swiss Alps. | Liddes village center, Local alpine cuisine restaurants, Scenic mountain views, Hiking trails nearby |
| Chamonix-Liddes Trail | This area is famous for its breathtaking trails and nature excursions. Ideal for outdoor enthusiasts looking for adventure and natural beauty. | Chamonix hiking trails, Alpine scenery, Breathtaking views of Mont Blanc, Trail running paths |
| Thermal Baths of Lavey | Proximity to the renowned thermal baths of Lavey which attract wellness tourists and those seeking relaxation and spa experiences. | Thermal baths, Spa treatments, Wellness activities, Relaxing natural surroundings |
| Val d'Hérens | Known for its stunning landscapes and historical villages, this valley attracts guests interested in culture and nature. | Historical villages, Cultural festivals, Hiking routes, Scenic viewpoints |
| Les Haudères | A picturesque village that is a gateway for hiking and outdoor activities. Popular with visitors looking for a tranquil setting in nature. | Traditional chalets, Hiking paths, Local artisan shops, Mountain biking trails |
| Ovronnaz | A popular ski and wellness resort area close to Liddes, attracting winter sports lovers and spa-goers alike. | Ski slopes, Thermal baths, Winter sports activities, Mountain lodges |
| Beauregard | Known for its scenic outlooks and panoramic views, Beauregard is perfect for guests looking for a peaceful retreat with nature. | Stunning views of the Alps, Hiking trails, Quiet picnic spots, Birdwatching opportunities |
| Les Collons | A vibrant ski resort known for its family-friendly atmosphere, attracting tourists year-round for skiing and hiking. | Skiing and snowboarding, Family-friendly amenities, Summer hiking trails, Scenic cable car rides |
Understanding Airbnb License Requirements & STR Laws in Liddes (2026)
While Liddes, Wallis, Switzerland currently shows low STR regulations, specific Airbnb license requirements might still exist or change. Always verify the latest short term rental regulations and Airbnb license requirements directly with local government authorities for Liddes to ensure full compliance before hosting.
(Source: AirROI data, 2026, finding no licensed listings among those analyzed)
Top Performing Airbnb Properties in Liddes (2026)
Benchmark your potential! Explore examples of top-performing Airbnb properties in Liddesbased on Trailing Twelve Month (TTM) revenue. Analyze their characteristics, revenue, occupancy rate, and ADR to understand what drives success in this market.
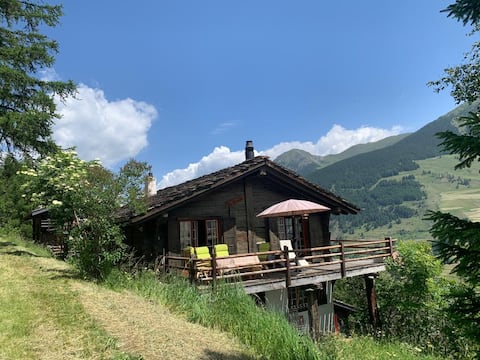
Chalet le Moulin - quiet, nature, fireplace, view
Entire Place • 3 bedrooms

The White House
Entire Place • 2 bedrooms

Welcome to Paradise
Entire Place • 1 bedroom

Little love nest in Liddes
Entire Place • 1 bedroom

Charming 2 room apartment plus kitchen
Entire Place • 2 bedrooms

Large and old authentic charming cottage
Entire Place • 3 bedrooms
Note: Performance varies based on location, size, amenities, seasonality, and management quality. Data reflects the past 12 months.
Top Performing Airbnb Hosts in Liddes (2026)
Learn from the best! This table showcases top-performing Airbnb hosts in Liddes based on the number of properties managed and estimated total revenue over the past year. Analyze their scale and performance metrics.
| Host Name | Properties | Grossing Revenue | Stay Reviews | Avg Rating |
|---|---|---|---|---|
| Christine | 2 | $24,447 | 142 | 4.92/5.0 |
| Joanna | 1 | $23,485 | 20 | 4.80/5.0 |
| Romain | 1 | $20,135 | 62 | 4.94/5.0 |
| Marc | 1 | $20,132 | 28 | 5.00/5.0 |
| Georges-André | 1 | $17,493 | 318 | 4.93/5.0 |
| Michel | 1 | $16,286 | 12 | 4.92/5.0 |
| Laurence Et Olivier | 1 | $13,289 | 57 | 4.89/5.0 |
| Serge | 1 | $13,006 | 2 | Not Rated |
| Rachel | 2 | $12,973 | 75 | 4.92/5.0 |
| Myriam | 2 | $10,599 | 19 | 4.61/5.0 |
Analyzing the strategies of top hosts, such as their property selection, pricing, and guest communication, can offer valuable lessons for optimizing your own Airbnb operations in Liddes.
Dive Deeper: Advanced Liddes STR Market Data (2026)
Ready to unlock more insights? AirROI provides access to advanced metrics and comprehensive Airbnb data for Liddes. Explore detailed analytics beyond this report to refine your investment strategy, optimize pricing, and maximize your vacation rental profits.
Explore Advanced MetricsLiddes Short-Term Rental Market Composition (2026): Property & Room Types
Room Type Distribution
Property Type Distribution
Market Composition Insights for Liddes
- The Liddes Airbnb market composition is heavily skewed towards Entire Home/Apt listings, which make up 66.7% of the 18 active rentals. This indicates strong guest preference for privacy and space.
- However, a notable 33.3% share for Private Rooms suggests opportunities for budget-conscious travelers or hosts renting out spare rooms.
- Looking at the property type distribution in Liddes, House properties are the most common (61.1%), reflecting the local real estate landscape.
- Houses represent a significant 61.1% portion, catering likely to families or larger groups.
- The presence of 11.1% Hotel/Boutique listings indicates integration with traditional hospitality.
Liddes Airbnb Room Capacity Analysis (2026): Bedroom Distribution
Distribution of Listings by Number of Bedrooms
Room Capacity Insights for Liddes
- The dominant room capacity in Liddes is 3 bedrooms listings, making up 27.8% of the market. This suggests a strong demand for properties suitable for families or small groups.
- Together, 3 bedrooms and 2 bedrooms properties represent 55.6% of the active Airbnb listings in Liddes, indicating a high concentration in these sizes.
- A significant 44.5% of listings offer 3+ bedrooms, catering to larger groups and families seeking more space in Liddes.
Liddes Vacation Rental Guest Capacity Trends (2026)
Distribution of Listings by Guest Capacity
Guest Capacity Insights for Liddes
- The most common guest capacity trend in Liddes vacation rentals is listings accommodating 8+ guests (22.2%). This suggests the primary traveler segment is likely larger groups.
- Properties designed for 8+ guests and 4 guests dominate the Liddes STR market, accounting for 44.4% of listings.
- 38.9% of properties accommodate 6+ guests, serving the market segment for larger families or group travel in Liddes.
- On average, properties in Liddes are equipped to host 4.5 guests.
Liddes Airbnb Booking Patterns (2026): Available vs. Booked Days
Available Days Distribution
Booked Days Distribution
Booking Pattern Insights for Liddes
- The most common availability pattern in Liddes falls within the 271-366 days range, representing 61.1% of listings. This suggests many properties have significant open periods on their calendars.
- Approximately 83.3% of listings show high availability (181+ days open annually), indicating potential for increased bookings or specific owner usage patterns.
- For booked days, the 31-90 days range is most frequent in Liddes (33.3%), reflecting common guest stay durations or potential owner blocking patterns.
- A notable 27.8% of properties secure long booking periods (181+ days booked per year), highlighting successful long-term rental strategies or significant owner usage.
Liddes Airbnb Minimum Stay Requirements Analysis
Distribution of Listings by Minimum Night Requirement
1 Night
3 listings
18.8% of total
2 Nights
5 listings
31.3% of total
3 Nights
2 listings
12.5% of total
4-6 Nights
5 listings
31.3% of total
30+ Nights
1 listings
6.3% of total
Key Insights
- The most prevalent minimum stay requirement in Liddes is 2 Nights, adopted by 31.3% of listings. This highlights the market's preference for shorter, flexible bookings.
Recommendations
- Align with the market by considering a 2 Nights minimum stay, as 31.3% of Liddes hosts use this setting.
- If feasible, allowing 1-night stays, especially midweek or during low season, could capture last-minute bookings, as only 18.8% currently do.
- A 2-night minimum appears standard (31.3%). Consider this for weekends or peak periods.
- Explore offering discounts for stays of 30+ nights to attract the 6.3% of the market seeking extended stays.
- Adjust minimum nights based on seasonality – potentially shorter during low season and longer during peak demand periods in Liddes.
Liddes Airbnb Cancellation Policy Trends Analysis (2026)
Flexible
4 listings
22.2% of total
Moderate
1 listings
5.6% of total
Firm
2 listings
11.1% of total
Strict
11 listings
61.1% of total
Cancellation Policy Insights for Liddes
- The prevailing Airbnb cancellation policy trend in Liddes is Strict, used by 61.1% of listings.
- A majority (72.2%) of hosts in Liddes utilize Firm or Strict policies, indicating a market where hosts prioritize booking security.
Recommendations for Hosts
- Consider adopting a Strict policy to align with the 61.1% market standard in Liddes.
- With 61.1% using Strict terms, this is a viable option in Liddes, particularly for high-value properties or during peak demand periods.
- Regularly review your cancellation policy against competitors and market demand shifts in Liddes.
Liddes STR Booking Lead Time Analysis (2026)
Average Booking Lead Time by Month
Booking Lead Time Insights for Liddes
- The overall average booking lead time for vacation rentals in Liddes is 46 days.
- Guests book furthest in advance for stays during July (average 100 days), likely coinciding with peak travel demand or local events.
- The shortest booking windows occur for stays in October (average 22 days), indicating more last-minute travel plans during this time.
- Seasonally, Summer (76 days avg.) sees the longest lead times, while Fall (33 days avg.) has the shortest, reflecting typical travel planning cycles.
Recommendations for Hosts
- Use the overall average lead time (46 days) as a baseline for your pricing and availability strategy in Liddes.
- For July stays, consider implementing length-of-stay discounts or slightly higher rates for bookings made less than 100 days out to capitalize on advance planning.
- Target marketing efforts for the Summer season well in advance (at least 76 days) to capture early planners.
- Monitor your own booking lead times against these Liddes averages to identify opportunities for dynamic pricing adjustments.
Popular & Essential Airbnb Amenities in Liddes (2026)
Amenity data is currently unavailable for Liddes.
Liddes Airbnb Guest Demographics & Profile Analysis (2026)
Guest Profile Summary for Liddes
- The typical guest profile for Airbnb in Liddes consists of predominantly international visitors (82%), with top international origins including Switzerland, typically belonging to the Post-2000s (Gen Z/Alpha) group (50%), primarily speaking English or French.
- Domestic travelers account for 17.7% of guests.
- Key international markets include France (27.8%) and Switzerland (17.7%).
- Top languages spoken are English (34.8%) followed by French (23.9%).
- A significant demographic segment is the Post-2000s (Gen Z/Alpha) group, representing 50% of guests.
Recommendations for Hosts
- Focus marketing internationally, particularly towards travelers from Switzerland.
- Tailor amenities and listing descriptions to appeal to the dominant Post-2000s (Gen Z/Alpha) demographic (e.g., highlight fast WiFi, smart home features, local guides).
- Highlight unique local experiences or amenities relevant to the primary guest profile.
- Consider seasonal promotions aligned with peak travel times for key origin markets.
Nearby Short-Term Rental Market Comparison
How does the Liddes Airbnb market stack up against its neighbors? Compare key performance metrics like average monthly revenue, ADR, and occupancy rates in surrounding areas to understand the broader regional STR landscape.
| Market | Active Properties | Monthly Revenue | Daily Rate | Avg. Occupancy |
|---|---|---|---|---|
| La Rivière-Enverse | 16 | $7,229 | $675.94 | 40% |
| Lauterbrunnen | 542 | $6,449 | $542.38 | 51% |
| Les Clefs | 33 | $5,625 | $310.75 | 44% |
| Habkern | 13 | $5,289 | $358.22 | 47% |
| Grindelwald | 502 | $5,008 | $365.18 | 56% |
| Zermatt | 798 | $4,969 | $491.58 | 46% |
| Matten bei Interlaken | 59 | $4,947 | $324.40 | 59% |
| Monteu Roero | 11 | $4,837 | $405.38 | 42% |
| Interlaken | 313 | $4,633 | $382.80 | 53% |
| Iseltwald | 23 | $4,178 | $373.83 | 49% |