Naters Airbnb Market Analysis 2026: Short Term Rental Data & Vacation Rental Statistics in Wallis, Switzerland
Is Airbnb profitable in Naters in 2026? Explore comprehensive Airbnb analytics for Naters, Wallis, Switzerland to uncover income potential. This 2026 STR market report for Naters, based on AirROI data from February 2025 to January 2026, reveals key trends in the niche market of 92 active listings.
Whether you're considering an Airbnb investment in Naters, optimizing your existing vacation rental, or exploring rental arbitrage opportunities, understanding the Naters Airbnb data is crucial. Leveraging the low regulation environment is key to maximizing your short term rental income potential. Let's dive into the specifics.
Key Naters Airbnb Performance Metrics Overview
Monthly Airbnb Revenue Variations & Income Potential in Naters (2026)
Understanding the monthly revenue variations for Airbnb listings in Naters is key to maximizing your short term rental income potential. Seasonality significantly impacts earnings. Our analysis, based on data from the past 12 months, shows that the peak revenue month for STRs in Naters is typically February, while November often presents the lowest earnings, highlighting opportunities for strategic pricing adjustments during shoulder and low seasons. Explore the typical Airbnb income in Naters across different performance tiers:
- Best-in-class properties (Top 10%) achieve $4,307+ monthly, often utilizing dynamic pricing and superior guest experiences.
- Strong performing properties (Top 25%) earn $2,932 or more, indicating effective management and desirable locations/amenities.
- Typical properties (Median) generate around $1,804 per month, representing the average market performance.
- Entry-level properties (Bottom 25%) see earnings around $852, often with potential for optimization.
Average Monthly Airbnb Earnings Trend in Naters
Naters Airbnb Occupancy Rate Trends (2026)
Maximize your bookings by understanding the Naters STR occupancy trends. Seasonal demand shifts significantly influence how often properties are booked. Typically, Februarysees the highest demand (peak season occupancy), while November experiences the lowest (low season). Effective strategies, like adjusting minimum stays or offering promotions, can boost occupancy during slower periods. Here's how different property tiers perform in Naters:
- Best-in-class properties (Top 10%) achieve 74%+ occupancy, indicating high desirability and potentially optimized availability.
- Strong performing properties (Top 25%) maintain 55% or higher occupancy, suggesting good market fit and guest satisfaction.
- Typical properties (Median) have an occupancy rate around 31%.
- Entry-level properties (Bottom 25%) average 15% occupancy, potentially facing higher vacancy.
Average Monthly Occupancy Rate Trend in Naters
Average Daily Rate (ADR) Airbnb Trends in Naters (2026)
Effective short term rental pricing strategy in Naters involves understanding monthly ADR fluctuations. The Average Daily Rate (ADR) for Airbnb in Naters typically peaks in January and dips lowest during April. Leveraging Airbnb dynamic pricing tools or strategies based on this seasonality can significantly boost revenue. Here's a look at the typical nightly rates achieved:
- Best-in-class properties (Top 10%) command rates of $306+ per night, often due to premium features or locations.
- Strong performing properties (Top 25%) achieve nightly rates of $253 or more.
- Typical properties (Median) charge around $191 per night.
- Entry-level properties (Bottom 25%) earn around $130 per night.
Average Daily Rate (ADR) Trend by Month in Naters
Get Live Naters Market Intelligence 👇

Explore Real-time Analytics
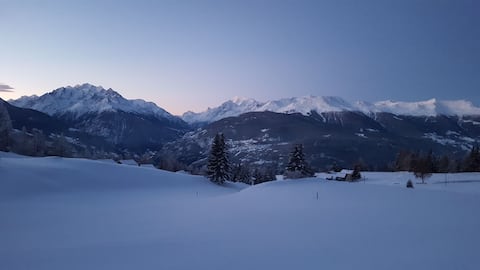
Airbnb Seasonality Analysis & Trends in Naters (2026)
Peak Season (February, July, August)
- Revenue averages $2,957 per month
- Occupancy rates average 46.8%
- Daily rates average $196
Shoulder Season
- Revenue averages $2,056 per month
- Occupancy maintains around 34.2%
- Daily rates hold near $204
Low Season (April, June, November)
- Revenue drops to average $1,528 per month
- Occupancy decreases to average 30.9%
- Daily rates adjust to average $197
Seasonality Insights for Naters
- The Airbnb seasonality in Naters shows highly seasonal trends requiring careful strategy. While the sections above show seasonal averages, it's also insightful to look at the extremes:
- During the high season, the absolute peak month showcases Naters's highest earning potential, with monthly revenues capable of climbing to $3,646, occupancy reaching a high of 55.1%, and ADRs peaking at $215.
- Conversely, the slowest single month of the year, typically falling within the low season, marks the market's lowest point. In this month, revenue might dip to $1,280, occupancy could drop to 25.7%, and ADRs may adjust down to $186.
- Understanding both the seasonal averages and these monthly peaks and troughs in revenue, occupancy, and ADR is crucial for maximizing your Airbnb profit potential in Naters.
Seasonal Strategies for Maximizing Profit
- Peak Season: Maximize revenue through premium pricing and potentially longer minimum stays. Ensure high availability.
- Low Season: Offer competitive pricing, special promotions (e.g., extended stay discounts), and flexible cancellation policies. Target off-season travelers like remote workers or budget-conscious guests.
- Shoulder Seasons: Implement dynamic pricing that balances peak and low rates. Target weekend travelers or specific events. Offer slightly more flexible terms than peak season.
- Regularly analyze your own performance against these Naters seasonality benchmarks and adjust your pricing and availability strategy accordingly.
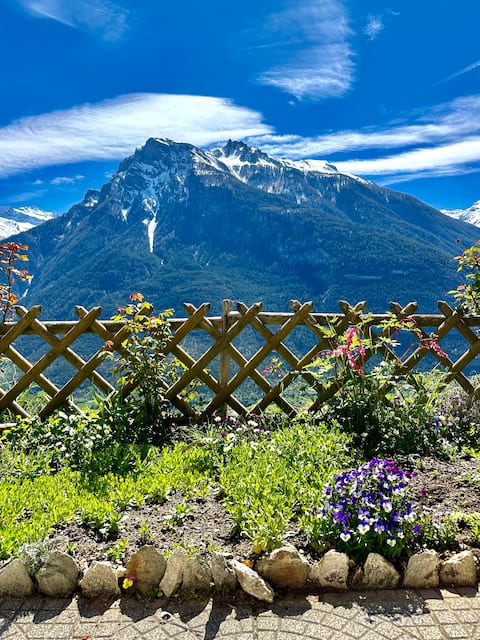
Best Areas for Airbnb Investment in Naters (2026)
Exploring the top neighborhoods for short-term rentals in Naters? This section highlights key areas, outlining why they are attractive for hosts and guests, along with notable local attractions. Consider these locations based on your target guest profile and investment strategy.
| Neighborhood / Area | Why Host Here? (Target Guests & Appeal) | Key Attractions & Landmarks |
|---|---|---|
| Naters Stadtzentrum | The central area of Naters offers convenient access to local shops, restaurants, and public transport. It is a vibrant neighborhood that attracts visitors looking for a local experience close to amenities. | Naters Church, Albinen Waterfall, Shopping Street, Public Library, Local Restaurants |
| Visp River Park | A peaceful area next to the Visp River, perfect for nature lovers. It features walking and biking paths and is popular for outdoor activities. | Visp River, Nature trails, Picnic areas, Bird watching, Scenic views |
| Fiescheralp | A stunning mountain resort area ideal for tourists during both winter and summer. Known for skiing, hiking, and breathtaking mountain views, it attracts outdoor enthusiasts. | Aletsch Glacier, Fiescheralp Ski Resort, Mountain hiking trails, Cable cars, Scenic viewpoints |
| Aletsch Arena | A UNESCO World Heritage site known for its amazing glaciers and hiking routes. It's a prime destination for tourists looking for natural beauty and adventure activities. | Aletsch Glacier, Hiking trails, Cable cars, Mountain restaurants, Breathtaking viewpoints |
| Oberwallis | A traditional region rich in culture and history, Oberwallis offers a unique charm with its ancient architecture and local festivals, attracting visitors interested in Swiss heritage. | Old Towns, Cultural festivals, Museums, Local craft shops, Historical landmarks |
| Riederalp | Another popular resort area for winter sports and summer hiking, offering a mix of activities and stunning landscapes, ideal for family vacations. | Riederalp Ski Area, Hiking paths, Local shops, Gastronomic experiences, Panoramic views |
| Grächen | A family-friendly destination known for its ski slopes and child-friendly activities. It appeals to families and adventure seekers alike. | Grächen Ski Resort, Family-friendly trails, Adventure parks, Local restaurants, Events and festivals |
| Schwarzsee | A serene lake area that attracts tourists looking for relaxation and nature walks. Ideal for summer swims and winter hikes, providing a peaceful retreat. | Schwarzsee Lake, Nature trails, Fishing areas, Restaurant with local cuisine, Picnic spots |
Understanding Airbnb License Requirements & STR Laws in Naters (2026)
While Naters, Wallis, Switzerland currently shows low STR regulations, specific Airbnb license requirements might still exist or change. Always verify the latest short term rental regulations and Airbnb license requirements directly with local government authorities for Naters to ensure full compliance before hosting.
(Source: AirROI data, 2026, finding no licensed listings among those analyzed)
Top Performing Airbnb Properties in Naters (2026)
Benchmark your potential! Explore examples of top-performing Airbnb properties in Natersbased on Trailing Twelve Month (TTM) revenue. Analyze their characteristics, revenue, occupancy rate, and ADR to understand what drives success in this market.
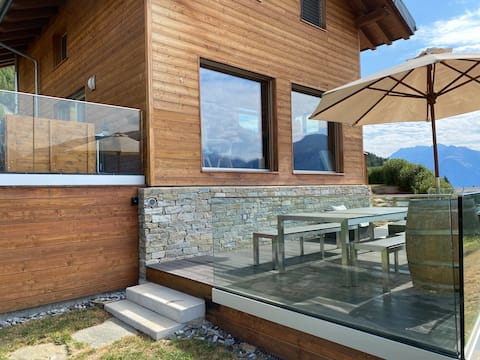
Chalet "ZUM SCHNÜFU" in the Salwald
Entire Place • 1 bedroom

Chalet Geimen: nostalgic and modern style!
Entire Place • 1 bedroom
Peaceful sunny chalet
Entire Place • 3 bedrooms
Modern studio with spectacular view
Entire Place • 1 bedroom

Nice and large 5 1/2 room apartment in Naters
Entire Place • 4 bedrooms

Chalet Aletschi, Blatten near Naters
Entire Place • 2 bedrooms
Note: Performance varies based on location, size, amenities, seasonality, and management quality. Data reflects the past 12 months.
Top Performing Airbnb Hosts in Naters (2026)
Learn from the best! This table showcases top-performing Airbnb hosts in Naters based on the number of properties managed and estimated total revenue over the past year. Analyze their scale and performance metrics.
| Host Name | Properties | Grossing Revenue | Stay Reviews | Avg Rating |
|---|---|---|---|---|
| Beltour | 28 | $272,413 | 60 | 4.70/5.0 |
| David | 1 | $77,062 | 56 | 5.00/5.0 |
| Basri | 3 | $76,317 | 129 | 4.70/5.0 |
| Andreas | 2 | $62,024 | 112 | 5.00/5.0 |
| Reto | 1 | $46,141 | 258 | 4.97/5.0 |
| Rebecca | 1 | $45,568 | 39 | 5.00/5.0 |
| Eva-Tamara | 5 | $45,530 | 77 | 4.42/5.0 |
| Rafaela | 1 | $42,510 | 67 | 5.00/5.0 |
| Matthias | 1 | $38,731 | 27 | 4.85/5.0 |
| Christine | 1 | $36,986 | 29 | 4.97/5.0 |
Analyzing the strategies of top hosts, such as their property selection, pricing, and guest communication, can offer valuable lessons for optimizing your own Airbnb operations in Naters.
Dive Deeper: Advanced Naters STR Market Data (2026)
Ready to unlock more insights? AirROI provides access to advanced metrics and comprehensive Airbnb data for Naters. Explore detailed analytics beyond this report to refine your investment strategy, optimize pricing, and maximize your vacation rental profits.
Explore Advanced MetricsNaters Short-Term Rental Market Composition (2026): Property & Room Types
Room Type Distribution
Property Type Distribution
Market Composition Insights for Naters
- The Naters Airbnb market composition is heavily skewed towards Entire Home/Apt listings, which make up 89.1% of the 92 active rentals. This indicates strong guest preference for privacy and space.
- Looking at the property type distribution in Naters, Apartment/Condo properties are the most common (80.4%), reflecting the local real estate landscape.
- Houses represent a significant 18.5% portion, catering likely to families or larger groups.
- Smaller segments like outdoor/unique (combined 1.1%) offer potential for unique stay experiences.
Naters Airbnb Room Capacity Analysis (2026): Bedroom Distribution
Distribution of Listings by Number of Bedrooms
Room Capacity Insights for Naters
- The dominant room capacity in Naters is 1 bedroom listings, making up 30.4% of the market. This suggests a strong demand for properties suitable for couples or solo travelers.
- Together, 1 bedroom and 3 bedrooms properties represent 54.3% of the active Airbnb listings in Naters, indicating a high concentration in these sizes.
- A significant 37.0% of listings offer 3+ bedrooms, catering to larger groups and families seeking more space in Naters.
Naters Vacation Rental Guest Capacity Trends (2026)
Distribution of Listings by Guest Capacity
Guest Capacity Insights for Naters
- The most common guest capacity trend in Naters vacation rentals is listings accommodating 5 guests (21.7%). This suggests the primary traveler segment is likely larger groups.
- Properties designed for 5 guests and 4 guests dominate the Naters STR market, accounting for 42.4% of listings.
- 23.9% of properties accommodate 6+ guests, serving the market segment for larger families or group travel in Naters.
- On average, properties in Naters are equipped to host 3.9 guests.
Naters Airbnb Booking Patterns (2026): Available vs. Booked Days
Available Days Distribution
Booked Days Distribution
Booking Pattern Insights for Naters
- The most common availability pattern in Naters falls within the 271-366 days range, representing 68.5% of listings. This suggests many properties have significant open periods on their calendars.
- Approximately 88.1% of listings show high availability (181+ days open annually), indicating potential for increased bookings or specific owner usage patterns.
- For booked days, the 31-90 days range is most frequent in Naters (42.4%), reflecting common guest stay durations or potential owner blocking patterns.
- A notable 12.0% of properties secure long booking periods (181+ days booked per year), highlighting successful long-term rental strategies or significant owner usage.
Naters Airbnb Minimum Stay Requirements Analysis
Distribution of Listings by Minimum Night Requirement
1 Night
9 listings
9.8% of total
2 Nights
7 listings
7.6% of total
3 Nights
5 listings
5.4% of total
4-6 Nights
21 listings
22.8% of total
7-29 Nights
5 listings
5.4% of total
30+ Nights
45 listings
48.9% of total
Key Insights
- The most prevalent minimum stay requirement in Naters is 30+ Nights, adopted by 48.9% of listings. This highlights the market's preference for longer commitments.
- Very short stays (1-2 nights) are less common (17.4%), suggesting hosts prefer slightly longer bookings to optimize turnover.
- A significant segment (48.9%) caters to monthly stays (30+ nights) in Naters, pointing to opportunities in the extended-stay market.
Recommendations
- Align with the market by considering a 30+ Nights minimum stay, as 48.9% of Naters hosts use this setting.
- If feasible, allowing 1-night stays, especially midweek or during low season, could capture last-minute bookings, as only 9.8% currently do.
- Explore offering discounts for stays of 30+ nights to attract the 48.9% of the market seeking extended stays.
- Adjust minimum nights based on seasonality – potentially shorter during low season and longer during peak demand periods in Naters.
Naters Airbnb Cancellation Policy Trends Analysis (2026)
Super Strict 30 Days
2 listings
2.2% of total
Limited
3 listings
3.3% of total
Flexible
19 listings
20.7% of total
Moderate
31 listings
33.7% of total
Firm
27 listings
29.3% of total
Strict
10 listings
10.9% of total
Cancellation Policy Insights for Naters
- The prevailing Airbnb cancellation policy trend in Naters is Moderate, used by 33.7% of listings.
- There's a relatively balanced mix between guest-friendly (54.4%) and stricter (40.2%) policies, offering choices for different guest needs.
Recommendations for Hosts
- Consider adopting a Moderate policy to align with the 33.7% market standard in Naters.
- Using a Strict policy might deter some guests, as only 10.9% of listings use it. Evaluate if potential revenue protection outweighs possible lower booking rates.
- Regularly review your cancellation policy against competitors and market demand shifts in Naters.
Naters STR Booking Lead Time Analysis (2026)
Average Booking Lead Time by Month
Booking Lead Time Insights for Naters
- The overall average booking lead time for vacation rentals in Naters is 94 days.
- Guests book furthest in advance for stays during January (average 162 days), likely coinciding with peak travel demand or local events.
- The shortest booking windows occur for stays in June (average 33 days), indicating more last-minute travel plans during this time.
- Seasonally, Winter (131 days avg.) sees the longest lead times, while Fall (50 days avg.) has the shortest, reflecting typical travel planning cycles.
Recommendations for Hosts
- Use the overall average lead time (94 days) as a baseline for your pricing and availability strategy in Naters.
- For January stays, consider implementing length-of-stay discounts or slightly higher rates for bookings made less than 162 days out to capitalize on advance planning.
- Target marketing efforts for the Winter season well in advance (at least 131 days) to capture early planners.
- Monitor your own booking lead times against these Naters averages to identify opportunities for dynamic pricing adjustments.
Popular & Essential Airbnb Amenities in Naters (2026)
Amenity Prevalence
Amenity Insights for Naters
- Popular amenities like Kitchen, Heating, Dishes and silverware are common but not universal. Offering these can provide a competitive edge.
- Warning: Wifi is not universally provided but is considered essential globally. Ensure reliable Wifi is offered.
Recommendations for Hosts
- Consider adding popular differentiators like Kitchen or Heating to increase appeal.
- Highlight unique or less common amenities you offer (e.g., hot tub, dedicated workspace, EV charger) in your listing description and photos.
- Regularly check competitor amenities in Naters to stay competitive.
Naters Airbnb Guest Demographics & Profile Analysis (2026)
Guest Profile Summary for Naters
- The typical guest profile for Airbnb in Naters consists of predominantly international visitors (65%), with top international origins including Germany, typically belonging to the Post-2000s (Gen Z/Alpha) group (50%), primarily speaking English or German.
- Domestic travelers account for 34.8% of guests.
- Key international markets include Switzerland (34.8%) and Germany (15.9%).
- Top languages spoken are English (37.1%) followed by German (21.6%).
- A significant demographic segment is the Post-2000s (Gen Z/Alpha) group, representing 50% of guests.
Recommendations for Hosts
- Focus marketing internationally, particularly towards travelers from Germany.
- Tailor amenities and listing descriptions to appeal to the dominant Post-2000s (Gen Z/Alpha) demographic (e.g., highlight fast WiFi, smart home features, local guides).
- Highlight unique local experiences or amenities relevant to the primary guest profile.
- Consider seasonal promotions aligned with peak travel times for key origin markets.
Nearby Short-Term Rental Market Comparison
How does the Naters Airbnb market stack up against its neighbors? Compare key performance metrics like average monthly revenue, ADR, and occupancy rates in surrounding areas to understand the broader regional STR landscape.
| Market | Active Properties | Monthly Revenue | Daily Rate | Avg. Occupancy |
|---|---|---|---|---|
| Brienzwiler | 11 | $7,335 | $514.27 | 60% |
| Niederried bei Interlaken | 19 | $6,267 | $552.03 | 44% |
| Lauterbrunnen | 552 | $6,108 | $487.83 | 51% |
| Ranco | 12 | $5,691 | $536.46 | 42% |
| Matten bei Interlaken | 64 | $5,607 | $336.51 | 59% |
| Grindelwald | 513 | $5,587 | $396.62 | 56% |
| Les Clefs | 34 | $5,585 | $314.08 | 47% |
| Bassersdorf | 16 | $5,337 | $431.59 | 46% |
| Wengen | 12 | $5,115 | $595.38 | 46% |
| Oberhofen am Thunersee | 25 | $5,051 | $329.28 | 51% |