Zurich Airbnb Market Analysis 2026: Short Term Rental Data & Vacation Rental Statistics in Zurich, Switzerland
Is Airbnb profitable in Zurich in 2026? Explore comprehensive Airbnb analytics for Zurich, Zurich, Switzerland to uncover income potential. This 2026 STR market report for Zurich, based on AirROI data from February 2025 to January 2026, reveals key trends in the bustling market of 1,679 active listings.
Whether you're considering an Airbnb investment in Zurich, optimizing your existing vacation rental, or exploring rental arbitrage opportunities, understanding the Zurich Airbnb data is crucial. Leveraging the low regulation environment is key to maximizing your short term rental income potential. Let's dive into the specifics.
Key Zurich Airbnb Performance Metrics Overview
Monthly Airbnb Revenue Variations & Income Potential in Zurich (2026)
Understanding the monthly revenue variations for Airbnb listings in Zurich is key to maximizing your short term rental income potential. Seasonality significantly impacts earnings. Our analysis, based on data from the past 12 months, shows that the peak revenue month for STRs in Zurich is typically July, while January often presents the lowest earnings, highlighting opportunities for strategic pricing adjustments during shoulder and low seasons. Explore the typical Airbnb income in Zurich across different performance tiers:
- Best-in-class properties (Top 10%) achieve $7,447+ monthly, often utilizing dynamic pricing and superior guest experiences.
- Strong performing properties (Top 25%) earn $4,905 or more, indicating effective management and desirable locations/amenities.
- Typical properties (Median) generate around $2,874 per month, representing the average market performance.
- Entry-level properties (Bottom 25%) see earnings around $1,365, often with potential for optimization.
Average Monthly Airbnb Earnings Trend in Zurich
Zurich Airbnb Occupancy Rate Trends (2026)
Maximize your bookings by understanding the Zurich STR occupancy trends. Seasonal demand shifts significantly influence how often properties are booked. Typically, Julysees the highest demand (peak season occupancy), while January experiences the lowest (low season). Effective strategies, like adjusting minimum stays or offering promotions, can boost occupancy during slower periods. Here's how different property tiers perform in Zurich:
- Best-in-class properties (Top 10%) achieve 87%+ occupancy, indicating high desirability and potentially optimized availability.
- Strong performing properties (Top 25%) maintain 74% or higher occupancy, suggesting good market fit and guest satisfaction.
- Typical properties (Median) have an occupancy rate around 51%.
- Entry-level properties (Bottom 25%) average 23% occupancy, potentially facing higher vacancy.
Average Monthly Occupancy Rate Trend in Zurich
Average Daily Rate (ADR) Airbnb Trends in Zurich (2026)
Effective short term rental pricing strategy in Zurich involves understanding monthly ADR fluctuations. The Average Daily Rate (ADR) for Airbnb in Zurich typically peaks in September and dips lowest during February. Leveraging Airbnb dynamic pricing tools or strategies based on this seasonality can significantly boost revenue. Here's a look at the typical nightly rates achieved:
- Best-in-class properties (Top 10%) command rates of $380+ per night, often due to premium features or locations.
- Strong performing properties (Top 25%) achieve nightly rates of $270 or more.
- Typical properties (Median) charge around $187 per night.
- Entry-level properties (Bottom 25%) earn around $130 per night.
Average Daily Rate (ADR) Trend by Month in Zurich
Get Live Zurich Market Intelligence 👇

Explore Real-time Analytics
Airbnb Seasonality Analysis & Trends in Zurich (2026)
Peak Season (July, August, June)
- Revenue averages $4,681 per month
- Occupancy rates average 56.0%
- Daily rates average $238
Shoulder Season
- Revenue averages $3,678 per month
- Occupancy maintains around 49.8%
- Daily rates hold near $231
Low Season (January, February, March)
- Revenue drops to average $2,632 per month
- Occupancy decreases to average 42.4%
- Daily rates adjust to average $208
Seasonality Insights for Zurich
- The Airbnb seasonality in Zurich shows highly seasonal trends requiring careful strategy. While the sections above show seasonal averages, it's also insightful to look at the extremes:
- During the high season, the absolute peak month showcases Zurich's highest earning potential, with monthly revenues capable of climbing to $4,880, occupancy reaching a high of 56.7%, and ADRs peaking at $252.
- Conversely, the slowest single month of the year, typically falling within the low season, marks the market's lowest point. In this month, revenue might dip to $2,287, occupancy could drop to 32.2%, and ADRs may adjust down to $198.
- Understanding both the seasonal averages and these monthly peaks and troughs in revenue, occupancy, and ADR is crucial for maximizing your Airbnb profit potential in Zurich.
Seasonal Strategies for Maximizing Profit
- Peak Season: Maximize revenue through premium pricing and potentially longer minimum stays. Ensure high availability.
- Low Season: Offer competitive pricing, special promotions (e.g., extended stay discounts), and flexible cancellation policies. Target off-season travelers like remote workers or budget-conscious guests.
- Shoulder Seasons: Implement dynamic pricing that balances peak and low rates. Target weekend travelers or specific events. Offer slightly more flexible terms than peak season.
- Regularly analyze your own performance against these Zurich seasonality benchmarks and adjust your pricing and availability strategy accordingly.
Best Areas for Airbnb Investment in Zurich (2026)
Exploring the top neighborhoods for short-term rentals in Zurich? This section highlights key areas, outlining why they are attractive for hosts and guests, along with notable local attractions. Consider these locations based on your target guest profile and investment strategy.
| Neighborhood / Area | Why Host Here? (Target Guests & Appeal) | Key Attractions & Landmarks |
|---|---|---|
| Old Town (Altstadt) | Historic district filled with medieval buildings, charming streets, and vibrant cultural life. A prime destination for tourists looking to experience the rich history and culture of Zurich. | Grossmünster, Fraumünster, Niederdorf, Rathaus Zurich, Swiss National Museum, Lindenhof |
| City Centre (Zentrum) | The heart of Zurich with access to shopping, dining, and entertainment. Ideal for tourists and business travelers alike, with easy access to public transport. | Bahnhofstrasse, Lake Zurich, Zurich Opera House, Zurich Tower, Swiss Federal Institute of Technology (ETH Zurich), Wasserkirche |
| Zürich-West | A trendy area that has seen significant development and offers a mix of modern culture, restaurants, and nightlife. Popular with younger crowds and urban dwellers. | Viadukt, Frau Gerolds Garten, Zurich Design Museum, Cabaret Voltaire, Les Halles, Rote Fabrik |
| Enge | A peaceful neighborhood near Lake Zurich, offering beautiful parks and green spaces, as well as close proximity to the city center. Attractive for families and tourists looking for a serene environment. | Zurich Botanical Garden, Lake Zurich Promenade, Museum Rietberg, Friedhof Enge, Uetliberg Mountain |
| Seefeld | A picturesque lakeside neighborhood that attracts tourists for its scenic views and vibrant atmosphere. Perfect for those looking to enjoy outdoor activities and relaxation by the lake. | Lake Zurich, Mythenquai Beach, Zurich Opera House, Bellerive Museum, Rietberg Park |
| Oerlikon | A rapidly growing district known for its mix of residential and commercial spaces, making it a great option for Airbnb hosts. It's close to the airport and has many cultural venues. | Stadion Letzigrund, Oerlikon market, Hall of Zürich-Oerlikon, Kraftwerk Stadt Zurich, Zurich Hauptbahnhof |
| Wollishofen | A popular residential area located by the lake, known for its relaxed atmosphere and access to nature, making it attractive for tourists who want a quiet yet convenient location. | Lake Zurich, Uetliberg Mountain trails, local cafes and restaurants, Wollishofen Beach, Höngg Nature Reserve |
| Hardbrücke | An upcoming area with a mix of modern living spaces and cultural hotspots. Perfect for those looking for a unique urban experience close to central Zurich. | Kunsthaus Zurich, Im Viadukt shopping area, Pulse of Zurich festival, Hardplatz art scene, local breweries |
Understanding Airbnb License Requirements & STR Laws in Zurich (2026)
While Zurich, Zurich, Switzerland currently shows low STR regulations, specific Airbnb license requirements might still exist or change. Always verify the latest short term rental regulations and Airbnb license requirements directly with local government authorities for Zurich to ensure full compliance before hosting.
(Source: AirROI data, 2026, based on 1% licensed listings)
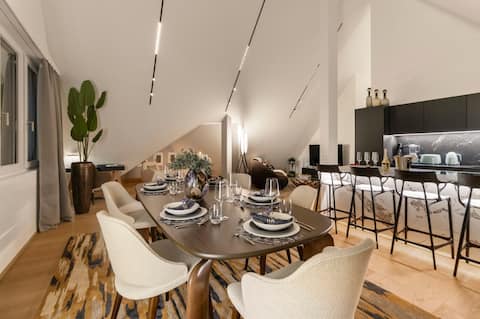
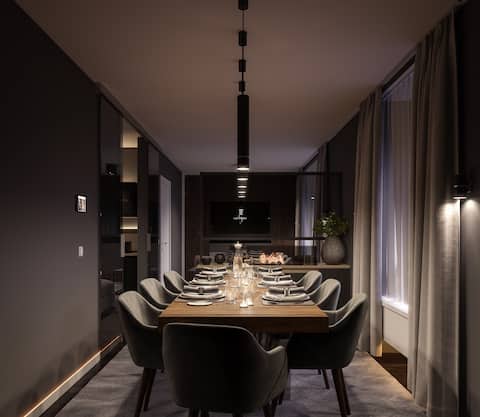
Top Performing Airbnb Properties in Zurich (2026)
Benchmark your potential! Explore examples of top-performing Airbnb properties in Zurichbased on Trailing Twelve Month (TTM) revenue. Analyze their characteristics, revenue, occupancy rate, and ADR to understand what drives success in this market.
AAALuxuryComfortRooftopFreeParkingACFullyEquipped
Entire Place • 3 bedrooms

Luxury Downtown Penthouse Duplex Apartment
Entire Place • 5 bedrooms

The Bahnhofstrasse / Paradeplatz LB18A Jewel
Entire Place • 2 bedrooms
Le Bijou Lintheschergasse / Zurich HB 3rd floor
Entire Place • 2 bedrooms
200m2 City Chic
Entire Place • 4 bedrooms

BestValueForMoney|AC|FreeParking|TopLocation
Entire Place • 4 bedrooms
Note: Performance varies based on location, size, amenities, seasonality, and management quality. Data reflects the past 12 months.
Top Performing Airbnb Hosts in Zurich (2026)
Learn from the best! This table showcases top-performing Airbnb hosts in Zurich based on the number of properties managed and estimated total revenue over the past year. Analyze their scale and performance metrics.
| Host Name | Properties | Grossing Revenue | Stay Reviews | Avg Rating |
|---|---|---|---|---|
| Dimiter | 99 | $4,578,557 | 9094 | 4.79/5.0 |
| Alexandros | 76 | $3,250,458 | 1968 | 4.28/5.0 |
| Stephanie | 62 | $2,397,546 | 1856 | 4.66/5.0 |
| Giancarlo | 62 | $1,989,955 | 1334 | 4.78/5.0 |
| Stefani | 29 | $1,973,794 | 544 | 4.74/5.0 |
| Delta Apartments | 39 | $1,745,384 | 1186 | 4.34/5.0 |
| James | 13 | $1,733,327 | 1450 | 4.88/5.0 |
| Residence Services Apartments | 41 | $1,393,343 | 5476 | 4.70/5.0 |
| Nora | 8 | $1,268,000 | 373 | 4.97/5.0 |
| Cher. | 16 | $1,223,940 | 4086 | 4.86/5.0 |
Analyzing the strategies of top hosts, such as their property selection, pricing, and guest communication, can offer valuable lessons for optimizing your own Airbnb operations in Zurich.
Dive Deeper: Advanced Zurich STR Market Data (2026)
Ready to unlock more insights? AirROI provides access to advanced metrics and comprehensive Airbnb data for Zurich. Explore detailed analytics beyond this report to refine your investment strategy, optimize pricing, and maximize your vacation rental profits.
Explore Advanced MetricsZurich Short-Term Rental Market Composition (2026): Property & Room Types
Room Type Distribution
Property Type Distribution
Market Composition Insights for Zurich
- The Zurich Airbnb market composition is heavily skewed towards Entire Home/Apt listings, which make up 80.1% of the 1,679 active rentals. This indicates strong guest preference for privacy and space.
- Looking at the property type distribution in Zurich, Apartment/Condo properties are the most common (94.1%), reflecting the local real estate landscape.
- Smaller segments like house, hotel/boutique, others, outdoor/unique, unique stays (combined 5.9%) offer potential for unique stay experiences.
Zurich Airbnb Room Capacity Analysis (2026): Bedroom Distribution
Distribution of Listings by Number of Bedrooms
Room Capacity Insights for Zurich
- The dominant room capacity in Zurich is 1 bedroom listings, making up 50.3% of the market. This suggests a strong demand for properties suitable for couples or solo travelers.
- Together, 1 bedroom and 2 bedrooms properties represent 68.3% of the active Airbnb listings in Zurich, indicating a high concentration in these sizes.
- With over half the market (50.3%) consisting of studios or 1-bedroom units, Zurich is particularly well-suited for individuals or couples.
- Listings with 3+ bedrooms (7.0%) represent a smaller niche, potentially indicating an underserved market for larger group accommodations in Zurich.
Zurich Vacation Rental Guest Capacity Trends (2026)
Distribution of Listings by Guest Capacity
Guest Capacity Insights for Zurich
- The most common guest capacity trend in Zurich vacation rentals is listings accommodating 2 guests (35.3%). This suggests the primary traveler segment is likely couples or solo travelers.
- Properties designed for 2 guests and 4 guests dominate the Zurich STR market, accounting for 55.0% of listings.
- 10.9% of properties accommodate 6+ guests, serving the market segment for larger families or group travel in Zurich.
- On average, properties in Zurich are equipped to host 2.8 guests.
Zurich Airbnb Booking Patterns (2026): Available vs. Booked Days
Available Days Distribution
Booked Days Distribution
Booking Pattern Insights for Zurich
- The most common availability pattern in Zurich falls within the 271-366 days range, representing 41.8% of listings. This suggests many properties have significant open periods on their calendars.
- Approximately 72.1% of listings show high availability (181+ days open annually), indicating potential for increased bookings or specific owner usage patterns.
- For booked days, the 91-180 days range is most frequent in Zurich (29.8%), reflecting common guest stay durations or potential owner blocking patterns.
- A notable 29.4% of properties secure long booking periods (181+ days booked per year), highlighting successful long-term rental strategies or significant owner usage.
Zurich Airbnb Minimum Stay Requirements Analysis
Distribution of Listings by Minimum Night Requirement
1 Night
415 listings
24.7% of total
2 Nights
218 listings
13% of total
3 Nights
88 listings
5.2% of total
4-6 Nights
144 listings
8.6% of total
7-29 Nights
182 listings
10.8% of total
30+ Nights
631 listings
37.6% of total
Key Insights
- The most prevalent minimum stay requirement in Zurich is 30+ Nights, adopted by 37.6% of listings. This highlights the market's preference for longer commitments.
- A significant segment (37.6%) caters to monthly stays (30+ nights) in Zurich, pointing to opportunities in the extended-stay market.
Recommendations
- Align with the market by considering a 30+ Nights minimum stay, as 37.6% of Zurich hosts use this setting.
- If feasible, allowing 1-night stays, especially midweek or during low season, could capture last-minute bookings, as only 24.7% currently do.
- Explore offering discounts for stays of 30+ nights to attract the 37.6% of the market seeking extended stays.
- Adjust minimum nights based on seasonality – potentially shorter during low season and longer during peak demand periods in Zurich.
Zurich Airbnb Cancellation Policy Trends Analysis (2026)
Limited
8 listings
0.5% of total
Super Strict 30 Days
30 listings
1.8% of total
Super Strict 60 Days
6 listings
0.4% of total
Flexible
258 listings
15.4% of total
Moderate
483 listings
28.9% of total
Firm
618 listings
37% of total
Strict
267 listings
16% of total
Cancellation Policy Insights for Zurich
- The prevailing Airbnb cancellation policy trend in Zurich is Firm, used by 37% of listings.
- A majority (53.0%) of hosts in Zurich utilize Firm or Strict policies, indicating a market where hosts prioritize booking security.
Recommendations for Hosts
- Consider adopting a Firm policy to align with the 37% market standard in Zurich.
- Regularly review your cancellation policy against competitors and market demand shifts in Zurich.
Zurich STR Booking Lead Time Analysis (2026)
Average Booking Lead Time by Month
Booking Lead Time Insights for Zurich
- The overall average booking lead time for vacation rentals in Zurich is 41 days.
- Guests book furthest in advance for stays during August (average 53 days), likely coinciding with peak travel demand or local events.
- The shortest booking windows occur for stays in February (average 26 days), indicating more last-minute travel plans during this time.
- Seasonally, Summer (49 days avg.) sees the longest lead times, while Winter (36 days avg.) has the shortest, reflecting typical travel planning cycles.
Recommendations for Hosts
- Use the overall average lead time (41 days) as a baseline for your pricing and availability strategy in Zurich.
- For August stays, consider implementing length-of-stay discounts or slightly higher rates for bookings made less than 53 days out to capitalize on advance planning.
- Target marketing efforts for the Summer season well in advance (at least 49 days) to capture early planners.
- Monitor your own booking lead times against these Zurich averages to identify opportunities for dynamic pricing adjustments.
Popular & Essential Airbnb Amenities in Zurich (2026)
Amenity Prevalence
Amenity Insights for Zurich
- Essential amenities in Zurich that guests expect include: Wifi. Lacking these (this) could significantly impact bookings.
- Popular amenities like Heating, Kitchen, Hot water are common but not universal. Offering these can provide a competitive edge.
Recommendations for Hosts
- Ensure your listing includes all essential amenities for Zurich: Wifi.
- Prioritize adding missing essentials: Wifi.
- Consider adding popular differentiators like Heating or Kitchen to increase appeal.
- Highlight unique or less common amenities you offer (e.g., hot tub, dedicated workspace, EV charger) in your listing description and photos.
- Regularly check competitor amenities in Zurich to stay competitive.
Zurich Airbnb Guest Demographics & Profile Analysis (2026)
Guest Profile Summary for Zurich
- The typical guest profile for Airbnb in Zurich consists of predominantly international visitors (92%), with top international origins including United Kingdom, typically belonging to the Post-2000s (Gen Z/Alpha) group (50%), primarily speaking English or Spanish.
- Domestic travelers account for 7.8% of guests.
- Key international markets include United States (34.4%) and United Kingdom (8.8%).
- Top languages spoken are English (44.3%) followed by Spanish (11.3%).
- A significant demographic segment is the Post-2000s (Gen Z/Alpha) group, representing 50% of guests.
Recommendations for Hosts
- Focus marketing internationally, particularly towards travelers from United Kingdom.
- Tailor amenities and listing descriptions to appeal to the dominant Post-2000s (Gen Z/Alpha) demographic (e.g., highlight fast WiFi, smart home features, local guides).
- Highlight unique local experiences or amenities relevant to the primary guest profile.
- Consider seasonal promotions aligned with peak travel times for key origin markets.
Nearby Short-Term Rental Market Comparison
How does the Zurich Airbnb market stack up against its neighbors? Compare key performance metrics like average monthly revenue, ADR, and occupancy rates in surrounding areas to understand the broader regional STR landscape.
| Market | Active Properties | Monthly Revenue | Daily Rate | Avg. Occupancy |
|---|---|---|---|---|
| Brienzwiler | 11 | $7,335 | $514.27 | 60% |
| Ittenheim | 20 | $6,532 | $404.34 | 42% |
| Niederried bei Interlaken | 19 | $6,267 | $552.03 | 44% |
| Lauterbrunnen | 552 | $6,108 | $487.83 | 51% |
| Furdenheim | 14 | $6,054 | $470.22 | 50% |
| Matten bei Interlaken | 64 | $5,607 | $336.51 | 59% |
| Grindelwald | 513 | $5,587 | $396.62 | 56% |
| Bassersdorf | 16 | $5,337 | $431.59 | 46% |
| Wengen | 12 | $5,115 | $595.38 | 46% |
| Oberhofen am Thunersee | 25 | $5,051 | $329.28 | 51% |