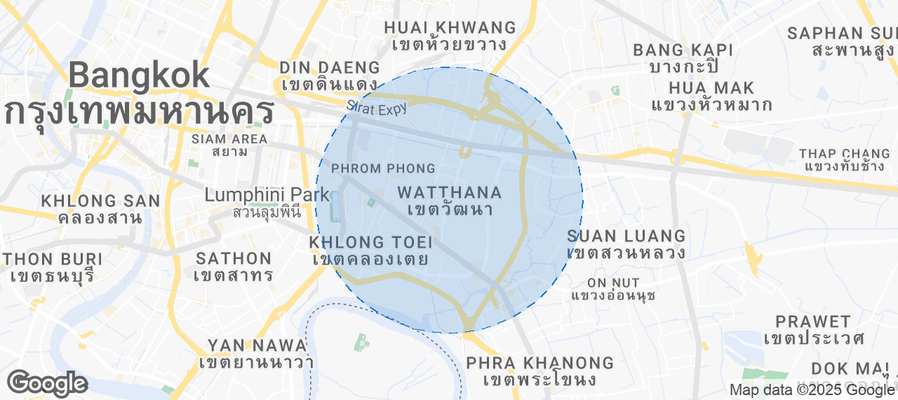
Watthana Airbnb Market Analysis 2026: Short Term Rental Data & Vacation Rental Statistics in Bangkok, Thailand
Is Airbnb profitable in Watthana in 2026? Explore comprehensive Airbnb analytics for Watthana, Bangkok, Thailand to uncover income potential. This 2026 STR market report for Watthana, based on AirROI data from February 2025 to January 2026, reveals key trends in the market of 309 active listings.
Whether you're considering an Airbnb investment in Watthana, optimizing your existing vacation rental, or exploring rental arbitrage opportunities, understanding the Watthana Airbnb data is crucial. Leveraging the low regulation environment is key to maximizing your short term rental income potential. Let's dive into the specifics.
Key Watthana Airbnb Performance Metrics Overview
Monthly Airbnb Revenue Variations & Income Potential in Watthana (2026)
Understanding the monthly revenue variations for Airbnb listings in Watthana is key to maximizing your short term rental income potential. Seasonality significantly impacts earnings. Our analysis, based on data from the past 12 months, shows that the peak revenue month for STRs in Watthana is typically December, while May often presents the lowest earnings, highlighting opportunities for strategic pricing adjustments during shoulder and low seasons. Explore the typical Airbnb income in Watthana across different performance tiers:
- Best-in-class properties (Top 10%) achieve $2,700+ monthly, often utilizing dynamic pricing and superior guest experiences.
- Strong performing properties (Top 25%) earn $1,515 or more, indicating effective management and desirable locations/amenities.
- Typical properties (Median) generate around $892 per month, representing the average market performance.
- Entry-level properties (Bottom 25%) see earnings around $430, often with potential for optimization.
Average Monthly Airbnb Earnings Trend in Watthana
Watthana Airbnb Occupancy Rate Trends (2026)
Maximize your bookings by understanding the Watthana STR occupancy trends. Seasonal demand shifts significantly influence how often properties are booked. Typically, Decembersees the highest demand (peak season occupancy), while May experiences the lowest (low season). Effective strategies, like adjusting minimum stays or offering promotions, can boost occupancy during slower periods. Here's how different property tiers perform in Watthana:
- Best-in-class properties (Top 10%) achieve 77%+ occupancy, indicating high desirability and potentially optimized availability.
- Strong performing properties (Top 25%) maintain 64% or higher occupancy, suggesting good market fit and guest satisfaction.
- Typical properties (Median) have an occupancy rate around 40%.
- Entry-level properties (Bottom 25%) average 19% occupancy, potentially facing higher vacancy.
Average Monthly Occupancy Rate Trend in Watthana
Average Daily Rate (ADR) Airbnb Trends in Watthana (2026)
Effective short term rental pricing strategy in Watthana involves understanding monthly ADR fluctuations. The Average Daily Rate (ADR) for Airbnb in Watthana typically peaks in December and dips lowest during August. Leveraging Airbnb dynamic pricing tools or strategies based on this seasonality can significantly boost revenue. Here's a look at the typical nightly rates achieved:
- Best-in-class properties (Top 10%) command rates of $183+ per night, often due to premium features or locations.
- Strong performing properties (Top 25%) achieve nightly rates of $104 or more.
- Typical properties (Median) charge around $62 per night.
- Entry-level properties (Bottom 25%) earn around $45 per night.
Average Daily Rate (ADR) Trend by Month in Watthana
Get Live Watthana Market Intelligence 👇
Explore Real-time Analytics
Airbnb Seasonality Analysis & Trends in Watthana (2026)
Peak Season (December, November, October)
- Revenue averages $1,673 per month
- Occupancy rates average 49.3%
- Daily rates average $112
Shoulder Season
- Revenue averages $1,121 per month
- Occupancy maintains around 38.4%
- Daily rates hold near $99
Low Season (February, March, April)
- Revenue drops to average $0 per month
- Occupancy decreases to average 0.0%
- Daily rates adjust to average $98
Seasonality Insights for Watthana
- The Airbnb seasonality in Watthana shows highly seasonal trends requiring careful strategy. While the sections above show seasonal averages, it's also insightful to look at the extremes:
- During the high season, the absolute peak month showcases Watthana's highest earning potential, with monthly revenues capable of climbing to $1,907, occupancy reaching a high of 52.9%, and ADRs peaking at $115.
- Conversely, the slowest single month of the year, typically falling within the low season, marks the market's lowest point. In this month, revenue might dip to $0, occupancy could drop to 0.0%, and ADRs may adjust down to $91.
- Understanding both the seasonal averages and these monthly peaks and troughs in revenue, occupancy, and ADR is crucial for maximizing your Airbnb profit potential in Watthana.
Seasonal Strategies for Maximizing Profit
- Peak Season: Maximize revenue through premium pricing and potentially longer minimum stays. Ensure high availability.
- Low Season: Offer competitive pricing, special promotions (e.g., extended stay discounts), and flexible cancellation policies. Target off-season travelers like remote workers or budget-conscious guests.
- Shoulder Seasons: Implement dynamic pricing that balances peak and low rates. Target weekend travelers or specific events. Offer slightly more flexible terms than peak season.
- Regularly analyze your own performance against these Watthana seasonality benchmarks and adjust your pricing and availability strategy accordingly.
Best Areas for Airbnb Investment in Watthana (2026)
Exploring the top neighborhoods for short-term rentals in Watthana? This section highlights key areas, outlining why they are attractive for hosts and guests, along with notable local attractions. Consider these locations based on your target guest profile and investment strategy.
| Neighborhood / Area | Why Host Here? (Target Guests & Appeal) | Key Attractions & Landmarks |
|---|---|---|
| Thonglor | Trendy neighborhood known for its vibrant nightlife, upscale dining, and boutique shopping. A prime spot for both locals and tourists looking for a chic urban experience. | Thonglor Soi 10, Ekkamai Beer House, The Commons, J Avenue, Bookshop Thonglor |
| Sukhumvit | One of Bangkok's main thoroughfares, it offers a mix of business districts and residential areas with convenient access to shopping malls, restaurants, and nightlife. | Terminal 21, EmQuartier, Soi Cowboy, Benchasiri Park, Emporium |
| Ari | A laid-back yet trendy area favored by young professionals and expats. Known for its cafes, boutiques, and local markets, it offers a more relaxed vibe. | Ari Soi 5, The Coffee Club, Somtum Der, Ari Market, Central Plaza Ladprao |
| Khlong Tan | A fantastic area for both locals and foreigners, with a good mix of residential and commercial spaces. Close to several parks and excellent dining options. | Benjakitti Park, Srinakarin Train Market, Bangkok Prep School, Sukhumvit Park |
| Phrom Phong | Home to the upscale Emporium Shopping Mall and Benchasiri Park. This area appeals to high-income travelers and is popular with expatriates. | Emporium, Benchasiri Park, The Hive Chiang Mai Soul, Phrom Phong BTS Station, Park Lane |
| Langsuan | A posh area that combines tranquillity with proximity to vibrant Sukhumvit. Known for luxury residences and high-end restaurants. | Langsuan Street, Central Chidlom, Gaysorn Village, Lumpini Park, Thailand Creative & Design Center |
| Asoke | A bustling commercial center with a mix of business and entertainment. Perfect for those looking for city life with an easy commute. | Terminal 21, Asoke BTS Station, Benjakitti Park, Soi Cowboy, Robinson Department Store |
| Ratchadaphisek | An up-and-coming area known for its entertainment and nightlife. It attracts a younger crowd and offers a more local experience. | The Esplanade, Ratchada Train Night Market, Thailand Cultural Centre, Siam Niramit, Central Plaza Ratchada |
Understanding Airbnb License Requirements & STR Laws in Watthana (2026)
While Watthana, Bangkok, Thailand currently shows low STR regulations, specific Airbnb license requirements might still exist or change. Always verify the latest short term rental regulations and Airbnb license requirements directly with local government authorities for Watthana to ensure full compliance before hosting.
(Source: AirROI data, 2026, finding no licensed listings among those analyzed)
Top Performing Airbnb Properties in Watthana (2026)
Benchmark your potential! Explore examples of top-performing Airbnb properties in Watthanabased on Trailing Twelve Month (TTM) revenue. Analyze their characteristics, revenue, occupancy rate, and ADR to understand what drives success in this market.

Bangkok Fantasy Villa S1
Entire Place • 9 bedrooms

Xman Villa | 6+1 Bed 6 Bath Pool Villa in Bangkok
Entire Place • 6 bedrooms

The Hidden Gallery 5-Bed art villa Netflix Vinyl
Entire Place • 4 bedrooms

Spacious 4BR Home: 5.5 Beds 110" HD Projector WiFi
Entire Place • 4 bedrooms

Luxury 7BR Single Pool Villa Emquartier|Nana|BTS Phrom Phong
Entire Place • 7 bedrooms

Sunshine Villa. A boutique green field single pool villa in the center of Bangkok
Entire Place • 4 bedrooms
Note: Performance varies based on location, size, amenities, seasonality, and management quality. Data reflects the past 12 months.
Top Performing Airbnb Hosts in Watthana (2026)
Learn from the best! This table showcases top-performing Airbnb hosts in Watthana based on the number of properties managed and estimated total revenue over the past year. Analyze their scale and performance metrics.
| Host Name | Properties | Grossing Revenue | Stay Reviews | Avg Rating |
|---|---|---|---|---|
| Chloe | 10 | $138,401 | 32 | 4.90/5.0 |
| Summer | 3 | $124,595 | 12 | 5.00/5.0 |
| Stellar | 3 | $123,442 | 14 | 4.75/5.0 |
| TeeZee | 2 | $115,851 | 114 | 4.98/5.0 |
| Ed | 7 | $108,984 | 151 | 4.63/5.0 |
| Tony NOSBAAN | 9 | $86,853 | 36 | 5.00/5.0 |
| Sontana | 15 | $75,768 | 49 | 4.76/5.0 |
| Ann | 1 | $65,972 | 3 | 5.00/5.0 |
| Carl | 5 | $63,916 | 57 | 4.57/5.0 |
| Yan | 1 | $55,555 | 17 | 4.94/5.0 |
Analyzing the strategies of top hosts, such as their property selection, pricing, and guest communication, can offer valuable lessons for optimizing your own Airbnb operations in Watthana.
Dive Deeper: Advanced Watthana STR Market Data (2026)
Ready to unlock more insights? AirROI provides access to advanced metrics and comprehensive Airbnb data for Watthana. Explore detailed analytics beyond this report to refine your investment strategy, optimize pricing, and maximize your vacation rental profits.
Explore Advanced MetricsWatthana Short-Term Rental Market Composition (2026): Property & Room Types
Room Type Distribution
Property Type Distribution
Market Composition Insights for Watthana
- The Watthana Airbnb market composition is heavily skewed towards Entire Home/Apt listings, which make up 92.6% of the 309 active rentals. This indicates strong guest preference for privacy and space.
- Looking at the property type distribution in Watthana, Apartment/Condo properties are the most common (84.5%), reflecting the local real estate landscape.
- Smaller segments like hotel/boutique, unique stays (combined 1.9%) offer potential for unique stay experiences.
Watthana Airbnb Room Capacity Analysis (2026): Bedroom Distribution
Distribution of Listings by Number of Bedrooms
Room Capacity Insights for Watthana
- The dominant room capacity in Watthana is 1 bedroom listings, making up 60.5% of the market. This suggests a strong demand for properties suitable for couples or solo travelers.
- Together, 1 bedroom and 2 bedrooms properties represent 79.9% of the active Airbnb listings in Watthana, indicating a high concentration in these sizes.
- With over half the market (60.5%) consisting of studios or 1-bedroom units, Watthana is particularly well-suited for individuals or couples.
Watthana Vacation Rental Guest Capacity Trends (2026)
Distribution of Listings by Guest Capacity
Guest Capacity Insights for Watthana
- The most common guest capacity trend in Watthana vacation rentals is listings accommodating 2 guests (48.5%). This suggests the primary traveler segment is likely couples or solo travelers.
- Properties designed for 2 guests and 4 guests dominate the Watthana STR market, accounting for 61.1% of listings.
- A significant 49.1% of listings cater specifically to 1-2 guests, highlighting strong demand from couples and solo travelers in Watthana.
- 16.2% of properties accommodate 6+ guests, serving the market segment for larger families or group travel in Watthana.
- On average, properties in Watthana are equipped to host 3.3 guests.
Watthana Airbnb Booking Patterns (2026): Available vs. Booked Days
Available Days Distribution
Booked Days Distribution
Booking Pattern Insights for Watthana
- The most common availability pattern in Watthana falls within the 271-366 days range, representing 60.8% of listings. This suggests many properties have significant open periods on their calendars.
- Approximately 95.4% of listings show high availability (181+ days open annually), indicating potential for increased bookings or specific owner usage patterns.
- For booked days, the 91-180 days range is most frequent in Watthana (36.6%), reflecting common guest stay durations or potential owner blocking patterns.
- A notable 5.5% of properties secure long booking periods (181+ days booked per year), highlighting successful long-term rental strategies or significant owner usage.
Watthana Airbnb Minimum Stay Requirements Analysis
Distribution of Listings by Minimum Night Requirement
1 Night
116 listings
37.5% of total
2 Nights
16 listings
5.2% of total
3 Nights
8 listings
2.6% of total
4-6 Nights
25 listings
8.1% of total
7-29 Nights
71 listings
23% of total
30+ Nights
73 listings
23.6% of total
Key Insights
- The most prevalent minimum stay requirement in Watthana is 1 Night, adopted by 37.5% of listings. This highlights the market's preference for shorter, flexible bookings.
- A significant segment (23.6%) caters to monthly stays (30+ nights) in Watthana, pointing to opportunities in the extended-stay market.
Recommendations
- Align with the market by considering a 1 Night minimum stay, as 37.5% of Watthana hosts use this setting.
- Explore offering discounts for stays of 30+ nights to attract the 23.6% of the market seeking extended stays.
- Adjust minimum nights based on seasonality – potentially shorter during low season and longer during peak demand periods in Watthana.
Watthana Airbnb Cancellation Policy Trends Analysis (2026)
Limited
3 listings
1% of total
Flexible
102 listings
33% of total
Moderate
45 listings
14.6% of total
Firm
112 listings
36.2% of total
Strict
47 listings
15.2% of total
Cancellation Policy Insights for Watthana
- The prevailing Airbnb cancellation policy trend in Watthana is Firm, used by 36.2% of listings.
- A majority (51.4%) of hosts in Watthana utilize Firm or Strict policies, indicating a market where hosts prioritize booking security.
Recommendations for Hosts
- Consider adopting a Firm policy to align with the 36.2% market standard in Watthana.
- Regularly review your cancellation policy against competitors and market demand shifts in Watthana.
Watthana STR Booking Lead Time Analysis (2026)
Average Booking Lead Time by Month
Booking Lead Time Insights for Watthana
- The overall average booking lead time for vacation rentals in Watthana is 21 days.
- Guests book furthest in advance for stays during January (average 32 days), likely coinciding with peak travel demand or local events.
- The shortest booking windows occur for stays in April (average 0 days), indicating more last-minute travel plans during this time.
- Seasonally, Winter (21 days avg.) sees the longest lead times, while Spring (0 days avg.) has the shortest, reflecting typical travel planning cycles.
Recommendations for Hosts
- Use the overall average lead time (21 days) as a baseline for your pricing and availability strategy in Watthana.
- For January stays, consider implementing length-of-stay discounts or slightly higher rates for bookings made less than 32 days out to capitalize on advance planning.
- During April, focus on last-minute booking availability and promotions, as guests book with very short notice (0 days avg.).
- Target marketing efforts for the Winter season well in advance (at least 21 days) to capture early planners.
- Monitor your own booking lead times against these Watthana averages to identify opportunities for dynamic pricing adjustments.
Popular & Essential Airbnb Amenities in Watthana (2026)
Amenity Prevalence
Amenity Insights for Watthana
- Essential amenities in Watthana that guests expect include: Air conditioning, Wifi, TV. Lacking these (any) could significantly impact bookings.
- Popular amenities like Washer, Kitchen, Hair dryer are common but not universal. Offering these can provide a competitive edge.
Recommendations for Hosts
- Ensure your listing includes all essential amenities for Watthana: Air conditioning, Wifi, TV.
- Prioritize adding missing essentials: Air conditioning, Wifi, TV.
- Consider adding popular differentiators like Washer or Kitchen to increase appeal.
- Highlight unique or less common amenities you offer (e.g., hot tub, dedicated workspace, EV charger) in your listing description and photos.
- Regularly check competitor amenities in Watthana to stay competitive.
Watthana Airbnb Guest Demographics & Profile Analysis (2026)
Guest Profile Summary for Watthana
- The typical guest profile for Airbnb in Watthana consists of predominantly international visitors (95%), with top international origins including United Kingdom, typically belonging to the Post-2000s (Gen Z/Alpha) group (50%), primarily speaking English or French.
- Domestic travelers account for 5.2% of guests.
- Key international markets include United States (19.5%) and United Kingdom (6.8%).
- Top languages spoken are English (46.5%) followed by French (8%).
- A significant demographic segment is the Post-2000s (Gen Z/Alpha) group, representing 50% of guests.
Recommendations for Hosts
- Focus marketing internationally, particularly towards travelers from United Kingdom.
- Tailor amenities and listing descriptions to appeal to the dominant Post-2000s (Gen Z/Alpha) demographic (e.g., highlight fast WiFi, smart home features, local guides).
- Highlight unique local experiences or amenities relevant to the primary guest profile.
- Consider seasonal promotions aligned with peak travel times for key origin markets.
Nearby Short-Term Rental Market Comparison
How does the Watthana Airbnb market stack up against its neighbors? Compare key performance metrics like average monthly revenue, ADR, and occupancy rates in surrounding areas to understand the broader regional STR landscape.
| Market | Active Properties | Monthly Revenue | Daily Rate | Avg. Occupancy |
|---|---|---|---|---|
| Huai Yai | 36 | $1,984 | $287.17 | 32% |
| Nong Pla Lai | 13 | $1,685 | $240.23 | 31% |
| Ban Malai Thap Tai | 10 | $1,519 | $255.38 | 28% |
| Khet Bang Rak | 35 | $1,299 | $104.31 | 50% |
| Ban Nong Hiang | 56 | $1,169 | $216.74 | 37% |
| Ban Nong Bua | 34 | $1,162 | $179.93 | 28% |
| Bang Lamung | 16 | $1,089 | $242.13 | 25% |
| Pathum Wan | 27 | $1,083 | $106.21 | 48% |
| Khao Chi Chan | 71 | $1,028 | $216.66 | 27% |
| Suan Luang | 14 | $951 | $79.56 | 53% |