Tambon Maret Airbnb Market Analysis 2026: Short Term Rental Data & Vacation Rental Statistics in Chang Wat Surat Thani, Thailand
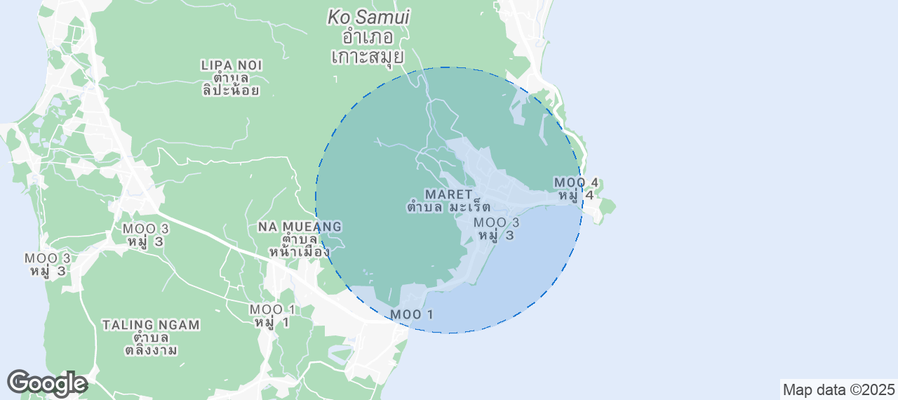
Is Airbnb profitable in Tambon Maret in 2026? Explore comprehensive Airbnb analytics for Tambon Maret, Chang Wat Surat Thani, Thailand to uncover income potential. This 2026 STR market report for Tambon Maret, based on AirROI data from February 2025 to January 2026, reveals key trends in the niche market of 39 active listings.
Whether you're considering an Airbnb investment in Tambon Maret, optimizing your existing vacation rental, or exploring rental arbitrage opportunities, understanding the Tambon Maret Airbnb data is crucial. Leveraging the low regulation environment is key to maximizing your short term rental income potential. Let's dive into the specifics.
Key Tambon Maret Airbnb Performance Metrics Overview
Monthly Airbnb Revenue Variations & Income Potential in Tambon Maret (2026)
Understanding the monthly revenue variations for Airbnb listings in Tambon Maret is key to maximizing your short term rental income potential. Seasonality significantly impacts earnings. Our analysis, based on data from the past 12 months, shows that the peak revenue month for STRs in Tambon Maret is typically December, while May often presents the lowest earnings, highlighting opportunities for strategic pricing adjustments during shoulder and low seasons. Explore the typical Airbnb income in Tambon Maret across different performance tiers:
- Best-in-class properties (Top 10%) achieve $4,794+ monthly, often utilizing dynamic pricing and superior guest experiences.
- Strong performing properties (Top 25%) earn $2,877 or more, indicating effective management and desirable locations/amenities.
- Typical properties (Median) generate around $1,196 per month, representing the average market performance.
- Entry-level properties (Bottom 25%) see earnings around $700, often with potential for optimization.
Average Monthly Airbnb Earnings Trend in Tambon Maret
Tambon Maret Airbnb Occupancy Rate Trends (2026)
Maximize your bookings by understanding the Tambon Maret STR occupancy trends. Seasonal demand shifts significantly influence how often properties are booked. Typically, Junesees the highest demand (peak season occupancy), while May experiences the lowest (low season). Effective strategies, like adjusting minimum stays or offering promotions, can boost occupancy during slower periods. Here's how different property tiers perform in Tambon Maret:
- Best-in-class properties (Top 10%) achieve 74%+ occupancy, indicating high desirability and potentially optimized availability.
- Strong performing properties (Top 25%) maintain 64% or higher occupancy, suggesting good market fit and guest satisfaction.
- Typical properties (Median) have an occupancy rate around 48%.
- Entry-level properties (Bottom 25%) average 26% occupancy, potentially facing higher vacancy.
Average Monthly Occupancy Rate Trend in Tambon Maret
Average Daily Rate (ADR) Airbnb Trends in Tambon Maret (2026)
Effective short term rental pricing strategy in Tambon Maret involves understanding monthly ADR fluctuations. The Average Daily Rate (ADR) for Airbnb in Tambon Maret typically peaks in January and dips lowest during November. Leveraging Airbnb dynamic pricing tools or strategies based on this seasonality can significantly boost revenue. Here's a look at the typical nightly rates achieved:
- Best-in-class properties (Top 10%) command rates of $272+ per night, often due to premium features or locations.
- Strong performing properties (Top 25%) achieve nightly rates of $170 or more.
- Typical properties (Median) charge around $61 per night.
- Entry-level properties (Bottom 25%) earn around $39 per night.
Average Daily Rate (ADR) Trend by Month in Tambon Maret
Get Live Tambon Maret Market Intelligence 👇
Explore Real-time Analytics
Airbnb Seasonality Analysis & Trends in Tambon Maret (2026)
Peak Season (December, January, February)
- Revenue averages $2,531 per month
- Occupancy rates average 42.0%
- Daily rates average $129
Shoulder Season
- Revenue averages $1,896 per month
- Occupancy maintains around 54.2%
- Daily rates hold near $106
Low Season (March, April, May)
- Revenue drops to average $93 per month
- Occupancy decreases to average 3.3%
- Daily rates adjust to average $113
Seasonality Insights for Tambon Maret
- The Airbnb seasonality in Tambon Maret shows highly seasonal trends requiring careful strategy. While the sections above show seasonal averages, it's also insightful to look at the extremes:
- During the high season, the absolute peak month showcases Tambon Maret's highest earning potential, with monthly revenues capable of climbing to $2,683, occupancy reaching a high of 62.7%, and ADRs peaking at $149.
- Conversely, the slowest single month of the year, typically falling within the low season, marks the market's lowest point. In this month, revenue might dip to $0, occupancy could drop to 0.0%, and ADRs may adjust down to $95.
- Understanding both the seasonal averages and these monthly peaks and troughs in revenue, occupancy, and ADR is crucial for maximizing your Airbnb profit potential in Tambon Maret.
Seasonal Strategies for Maximizing Profit
- Peak Season: Maximize revenue through premium pricing and potentially longer minimum stays. Ensure high availability.
- Low Season: Offer competitive pricing, special promotions (e.g., extended stay discounts), and flexible cancellation policies. Target off-season travelers like remote workers or budget-conscious guests.
- Shoulder Seasons: Implement dynamic pricing that balances peak and low rates. Target weekend travelers or specific events. Offer slightly more flexible terms than peak season.
- Regularly analyze your own performance against these Tambon Maret seasonality benchmarks and adjust your pricing and availability strategy accordingly.
Best Areas for Airbnb Investment in Tambon Maret (2026)
Exploring the top neighborhoods for short-term rentals in Tambon Maret? This section highlights key areas, outlining why they are attractive for hosts and guests, along with notable local attractions. Consider these locations based on your target guest profile and investment strategy.
| Neighborhood / Area | Why Host Here? (Target Guests & Appeal) | Key Attractions & Landmarks |
|---|---|---|
| Lamai Beach | One of the most popular beaches on Koh Samui, known for its laid-back vibe and family-friendly atmosphere. Great for tourists seeking relaxation, dining, and entertainment. | Lamai Beach, Grandfather and Grandmother Rocks, Lamai Night Plaza, Wat Lamai, Tamarind Springs Forest Spa |
| Chaweng Beach | The most famous beach in Koh Samui, known for its nightlife and vibrant atmosphere. Ideal for attracting younger crowds and party-goers. | Chaweng Beach, Central Festival Samui, Barbecue areas, Restaurants and nightlife, Chaweng Walking Street |
| Fisherman's Village | A charming beachfront area in Bophut with a rustic feel, great for boutique shopping and dining. Popular with families and couples. | Fisherman's Village, Bophut Beach, Bophut Night Market, The Samui Institute of Thai Culinary Arts, Wat Phu Khao Thong |
| Bang Po Beach | A quieter beach area ideal for relaxation and families. Offers a more local experience away from the tourist hustle and bustle. | Bang Po Beach, Maenam Beach nearby, Wat Phu Khao Thong, Local seafood restaurants, Fishing villages |
| Maenam Beach | Known for its laid-back vibe, it's a great destination for families and long-term stays. Offers beautiful sunsets and local dining options. | Maenam Beach, Wat Nongkao, Maenam Walking Street, Local markets, Yoga retreats |
| Big Buddha | Home to the iconic Big Buddha statue, this area attracts tourists and offers a unique cultural aspect. Great for short-term rental opportunities. | Big Buddha Temple, Wat Plai Laem, Plai Laem Beach, Lad Koh Viewpoint, Local shops |
| Lipa Noi Beach | Famous for its stunning sunsets and shallow waters, Lipa Noi is perfect for families with children and those looking for a serene environment. | Lipa Noi Beach, Nikki Beach Club, The Spa Samui, Local food vendors, Hiking trails nearby |
| Choeng Mon Beach | A tranquil beach area with a mix of upscale resorts and local charm, appealing to families and couples looking for a romantic getaway. | Choeng Mon Beach, Samui Football Golf, Choeng Mon Night Market, Local restaurants, Wat Plai Laem nearby |
Understanding Airbnb License Requirements & STR Laws in Tambon Maret (2026)
While Tambon Maret, Chang Wat Surat Thani, Thailand currently shows low STR regulations, specific Airbnb license requirements might still exist or change. Always verify the latest short term rental regulations and Airbnb license requirements directly with local government authorities for Tambon Maret to ensure full compliance before hosting.
(Source: AirROI data, 2026, finding no licensed listings among those analyzed)
Top Performing Airbnb Properties in Tambon Maret (2026)
Benchmark your potential! Explore examples of top-performing Airbnb properties in Tambon Maretbased on Trailing Twelve Month (TTM) revenue. Analyze their characteristics, revenue, occupancy rate, and ADR to understand what drives success in this market.
Walee Villa6 •Eirene 3BR Private Pool •Crystal Bay
Entire Place • 3 bedrooms
Sola Villa – Lamai Jungle View – 3 Bedrooms
Entire Place • 3 bedrooms

Villa Saowanee 8 • 3BR Pool Villa • Lamai Samui
Entire Place • 3 bedrooms
Villa Saowanee 4 • 3BR Pool Villa • Lamai Samui
Entire Place • 3 bedrooms

Villa See 04 • 3-BR Private Pool 900 m SilverBeach
Entire Place • 3 bedrooms
Villa Olive • 3BR Pool Villa • Lamai Samui
Entire Place • 3 bedrooms
Note: Performance varies based on location, size, amenities, seasonality, and management quality. Data reflects the past 12 months.
Top Performing Airbnb Hosts in Tambon Maret (2026)
Learn from the best! This table showcases top-performing Airbnb hosts in Tambon Maret based on the number of properties managed and estimated total revenue over the past year. Analyze their scale and performance metrics.
| Host Name | Properties | Grossing Revenue | Stay Reviews | Avg Rating |
|---|---|---|---|---|
| Stephanie | 6 | $196,126 | 54 | 4.95/5.0 |
| Olga | 1 | $53,182 | 23 | 4.78/5.0 |
| Cindy | 1 | $44,889 | 23 | 4.78/5.0 |
| Orawan | 2 | $32,181 | 10 | 4.83/5.0 |
| Alexandre | 3 | $27,716 | 17 | 4.79/5.0 |
| Barish | 2 | $17,479 | 30 | 4.73/5.0 |
| Jarvis SuperHost | 9 | $14,964 | 127 | 4.19/5.0 |
| Samui Sense By Poon And Dao | 4 | $13,891 | 63 | 4.71/5.0 |
| Sand | 2 | $11,502 | 13 | 4.73/5.0 |
| Diana | 1 | $8,571 | 13 | 4.85/5.0 |
Analyzing the strategies of top hosts, such as their property selection, pricing, and guest communication, can offer valuable lessons for optimizing your own Airbnb operations in Tambon Maret.
Dive Deeper: Advanced Tambon Maret STR Market Data (2026)
Ready to unlock more insights? AirROI provides access to advanced metrics and comprehensive Airbnb data for Tambon Maret. Explore detailed analytics beyond this report to refine your investment strategy, optimize pricing, and maximize your vacation rental profits.
Explore Advanced MetricsTambon Maret Short-Term Rental Market Composition (2026): Property & Room Types
Room Type Distribution
Property Type Distribution
Market Composition Insights for Tambon Maret
- The Tambon Maret Airbnb market composition is heavily skewed towards Entire Home/Apt listings, which make up 84.6% of the 39 active rentals. This indicates strong guest preference for privacy and space.
- Looking at the property type distribution in Tambon Maret, House properties are the most common (69.2%), reflecting the local real estate landscape.
- Houses represent a significant 69.2% portion, catering likely to families or larger groups.
- The presence of 12.8% Hotel/Boutique listings indicates integration with traditional hospitality.
Tambon Maret Airbnb Room Capacity Analysis (2026): Bedroom Distribution
Distribution of Listings by Number of Bedrooms
Room Capacity Insights for Tambon Maret
- The dominant room capacity in Tambon Maret is 1 bedroom listings, making up 56.4% of the market. This suggests a strong demand for properties suitable for couples or solo travelers.
- Together, 1 bedroom and 3 bedrooms properties represent 84.6% of the active Airbnb listings in Tambon Maret, indicating a high concentration in these sizes.
- With over half the market (56.4%) consisting of studios or 1-bedroom units, Tambon Maret is particularly well-suited for individuals or couples.
- A significant 28.2% of listings offer 3+ bedrooms, catering to larger groups and families seeking more space in Tambon Maret.
Tambon Maret Vacation Rental Guest Capacity Trends (2026)
Distribution of Listings by Guest Capacity
Guest Capacity Insights for Tambon Maret
- The most common guest capacity trend in Tambon Maret vacation rentals is listings accommodating 2 guests (51.3%). This suggests the primary traveler segment is likely couples or solo travelers.
- Properties designed for 2 guests and 6 guests dominate the Tambon Maret STR market, accounting for 82.1% of listings.
- A significant 51.3% of listings cater specifically to 1-2 guests, highlighting strong demand from couples and solo travelers in Tambon Maret.
- 30.8% of properties accommodate 6+ guests, serving the market segment for larger families or group travel in Tambon Maret.
- On average, properties in Tambon Maret are equipped to host 3.4 guests.
Tambon Maret Airbnb Booking Patterns (2026): Available vs. Booked Days
Available Days Distribution
Booked Days Distribution
Booking Pattern Insights for Tambon Maret
- The most common availability pattern in Tambon Maret falls within the 271-366 days range, representing 56.4% of listings. This suggests many properties have significant open periods on their calendars.
- Approximately 89.7% of listings show high availability (181+ days open annually), indicating potential for increased bookings or specific owner usage patterns.
- For booked days, the 91-180 days range is most frequent in Tambon Maret (33.3%), reflecting common guest stay durations or potential owner blocking patterns.
- A notable 12.8% of properties secure long booking periods (181+ days booked per year), highlighting successful long-term rental strategies or significant owner usage.
Tambon Maret Airbnb Minimum Stay Requirements Analysis
Distribution of Listings by Minimum Night Requirement
1 Night
13 listings
33.3% of total
3 Nights
15 listings
38.5% of total
4-6 Nights
2 listings
5.1% of total
7-29 Nights
3 listings
7.7% of total
30+ Nights
6 listings
15.4% of total
Key Insights
- The most prevalent minimum stay requirement in Tambon Maret is 3 Nights, adopted by 38.5% of listings. This highlights the market's preference for longer commitments.
- A significant segment (15.4%) caters to monthly stays (30+ nights) in Tambon Maret, pointing to opportunities in the extended-stay market.
Recommendations
- Align with the market by considering a 3 Nights minimum stay, as 38.5% of Tambon Maret hosts use this setting.
- Explore offering discounts for stays of 30+ nights to attract the 15.4% of the market seeking extended stays.
- Adjust minimum nights based on seasonality – potentially shorter during low season and longer during peak demand periods in Tambon Maret.
Tambon Maret Airbnb Cancellation Policy Trends Analysis (2026)
Super Strict 30 Days
1 listings
2.6% of total
Limited
1 listings
2.6% of total
Flexible
1 listings
2.6% of total
Moderate
2 listings
5.1% of total
Firm
32 listings
82.1% of total
Strict
2 listings
5.1% of total
Cancellation Policy Insights for Tambon Maret
- The prevailing Airbnb cancellation policy trend in Tambon Maret is Firm, used by 82.1% of listings.
- A majority (87.2%) of hosts in Tambon Maret utilize Firm or Strict policies, indicating a market where hosts prioritize booking security.
- Strict cancellation policies are quite rare (5.1%), potentially making listings with this policy less competitive unless justified by high demand or property type.
Recommendations for Hosts
- Consider adopting a Firm policy to align with the 82.1% market standard in Tambon Maret.
- Using a Strict policy might deter some guests, as only 5.1% of listings use it. Evaluate if potential revenue protection outweighs possible lower booking rates.
- Regularly review your cancellation policy against competitors and market demand shifts in Tambon Maret.
Tambon Maret STR Booking Lead Time Analysis (2026)
Average Booking Lead Time by Month
Booking Lead Time Insights for Tambon Maret
- The overall average booking lead time for vacation rentals in Tambon Maret is 29 days.
- Guests book furthest in advance for stays during January (average 89 days), likely coinciding with peak travel demand or local events.
- The shortest booking windows occur for stays in April (average 0 days), indicating more last-minute travel plans during this time.
- Seasonally, Winter (53 days avg.) sees the longest lead times, while Spring (0 days avg.) has the shortest, reflecting typical travel planning cycles.
Recommendations for Hosts
- Use the overall average lead time (29 days) as a baseline for your pricing and availability strategy in Tambon Maret.
- For January stays, consider implementing length-of-stay discounts or slightly higher rates for bookings made less than 89 days out to capitalize on advance planning.
- During April, focus on last-minute booking availability and promotions, as guests book with very short notice (0 days avg.).
- Target marketing efforts for the Winter season well in advance (at least 53 days) to capture early planners.
- Monitor your own booking lead times against these Tambon Maret averages to identify opportunities for dynamic pricing adjustments.
Popular & Essential Airbnb Amenities in Tambon Maret (2026)
Amenity Prevalence
Amenity Insights for Tambon Maret
- Essential amenities in Tambon Maret that guests expect include: Wifi, Air conditioning. Lacking these (any) could significantly impact bookings.
- Popular amenities like Free parking on premises, Hot water, TV are common but not universal. Offering these can provide a competitive edge.
- A pool is a highly desired but not standard amenity, making it a key feature for attracting guests seeking leisure in Tambon Maret.
Recommendations for Hosts
- Ensure your listing includes all essential amenities for Tambon Maret: Wifi, Air conditioning.
- Consider adding popular differentiators like Free parking on premises or Hot water to increase appeal.
- Highlight unique or less common amenities you offer (e.g., hot tub, dedicated workspace, EV charger) in your listing description and photos.
- Regularly check competitor amenities in Tambon Maret to stay competitive.
Tambon Maret Airbnb Guest Demographics & Profile Analysis (2026)
Guest Profile Summary for Tambon Maret
- The typical guest profile for Airbnb in Tambon Maret consists of predominantly international visitors (99%), with top international origins including United Kingdom, typically belonging to the Post-2000s (Gen Z/Alpha) group (50%), primarily speaking English or German.
- Domestic travelers account for 1.3% of guests.
- Key international markets include Germany (21.7%) and United Kingdom (15.8%).
- Top languages spoken are English (42.1%) followed by German (18%).
- A significant demographic segment is the Post-2000s (Gen Z/Alpha) group, representing 50% of guests.
Recommendations for Hosts
- Focus marketing internationally, particularly towards travelers from United Kingdom.
- Tailor amenities and listing descriptions to appeal to the dominant Post-2000s (Gen Z/Alpha) demographic (e.g., highlight fast WiFi, smart home features, local guides).
- Highlight unique local experiences or amenities relevant to the primary guest profile.
- Consider seasonal promotions aligned with peak travel times for key origin markets.
Nearby Short-Term Rental Market Comparison
How does the Tambon Maret Airbnb market stack up against its neighbors? Compare key performance metrics like average monthly revenue, ADR, and occupancy rates in surrounding areas to understand the broader regional STR landscape.
| Market | Active Properties | Monthly Revenue | Daily Rate | Avg. Occupancy |
|---|---|---|---|---|
| Baan Thong Po | 135 | $3,724 | $378.37 | 45% |
| Baan Thong Krut | 30 | $3,723 | $633.64 | 39% |
| Baan Taling Ngam | 38 | $3,122 | $392.66 | 36% |
| Baan Chaweng Noi | 333 | $3,038 | $289.57 | 45% |
| Ko Samui | 904 | $2,890 | $332.21 | 43% |
| Tong Yang | 56 | $2,766 | $562.71 | 38% |
| Baan Pang Ka | 15 | $2,734 | $245.69 | 45% |
| Ban Bang Khao | 58 | $2,702 | $405.58 | 38% |
| Baan Hua Thanon | 96 | $2,490 | $255.74 | 48% |
| Choeng Mon | 206 | $2,421 | $376.58 | 38% |