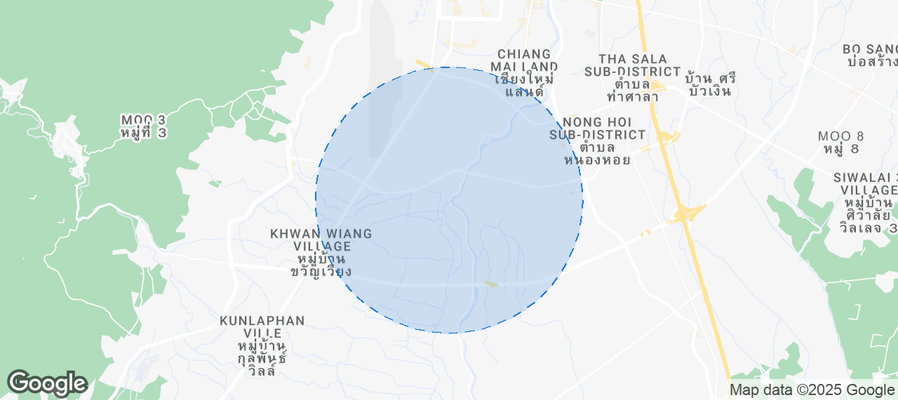
Ban Pa Daet Tai Airbnb Market Analysis 2025: Short Term Rental Data & Vacation Rental Statistics in Chiang Mai Province, Thailand
Is Airbnb profitable in Ban Pa Daet Tai in 2025? Explore comprehensive Airbnb analytics for Ban Pa Daet Tai, Chiang Mai Province, Thailand to uncover income potential. This 2025 STR market report for Ban Pa Daet Tai, based on AirROI data from November 2024 to October 2025, reveals key trends in the niche market of 19 active listings.
Whether you're considering an Airbnb investment in Ban Pa Daet Tai, optimizing your existing vacation rental, or exploring rental arbitrage opportunities, understanding the Ban Pa Daet Tai Airbnb data is crucial. Leveraging the low regulation environment is key to maximizing your short term rental income potential. Let's dive into the specifics.
Key Ban Pa Daet Tai Airbnb Performance Metrics Overview
Monthly Airbnb Revenue Variations & Income Potential in Ban Pa Daet Tai (2025)
Understanding the monthly revenue variations for Airbnb listings in Ban Pa Daet Tai is key to maximizing your short term rental income potential. Seasonality significantly impacts earnings. Our analysis, based on data from the past 12 months, shows that the peak revenue month for STRs in Ban Pa Daet Tai is typically December, while September often presents the lowest earnings, highlighting opportunities for strategic pricing adjustments during shoulder and low seasons. Explore the typical Airbnb income in Ban Pa Daet Tai across different performance tiers:
- Best-in-class properties (Top 10%) achieve $3,244+ monthly, often utilizing dynamic pricing and superior guest experiences.
- Strong performing properties (Top 25%) earn $2,011 or more, indicating effective management and desirable locations/amenities.
- Typical properties (Median) generate around $994 per month, representing the average market performance.
- Entry-level properties (Bottom 25%) see earnings around $406, often with potential for optimization.
Average Monthly Airbnb Earnings Trend in Ban Pa Daet Tai
Ban Pa Daet Tai Airbnb Occupancy Rate Trends (2025)
Maximize your bookings by understanding the Ban Pa Daet Tai STR occupancy trends. Seasonal demand shifts significantly influence how often properties are booked. Typically, Januarysees the highest demand (peak season occupancy), while September experiences the lowest (low season). Effective strategies, like adjusting minimum stays or offering promotions, can boost occupancy during slower periods. Here's how different property tiers perform in Ban Pa Daet Tai:
- Best-in-class properties (Top 10%) achieve 63%+ occupancy, indicating high desirability and potentially optimized availability.
- Strong performing properties (Top 25%) maintain 42% or higher occupancy, suggesting good market fit and guest satisfaction.
- Typical properties (Median) have an occupancy rate around 24%.
- Entry-level properties (Bottom 25%) average 14% occupancy, potentially facing higher vacancy.
Average Monthly Occupancy Rate Trend in Ban Pa Daet Tai
Average Daily Rate (ADR) Airbnb Trends in Ban Pa Daet Tai (2025)
Effective short term rental pricing strategy in Ban Pa Daet Tai involves understanding monthly ADR fluctuations. The Average Daily Rate (ADR) for Airbnb in Ban Pa Daet Tai typically peaks in November and dips lowest during June. Leveraging Airbnb dynamic pricing tools or strategies based on this seasonality can significantly boost revenue. Here's a look at the typical nightly rates achieved:
- Best-in-class properties (Top 10%) command rates of $287+ per night, often due to premium features or locations.
- Strong performing properties (Top 25%) achieve nightly rates of $202 or more.
- Typical properties (Median) charge around $76 per night.
- Entry-level properties (Bottom 25%) earn around $31 per night.
Average Daily Rate (ADR) Trend by Month in Ban Pa Daet Tai
Get Live Ban Pa Daet Tai Market Intelligence 👇
Explore Real-time Analytics
Airbnb Seasonality Analysis & Trends in Ban Pa Daet Tai (2025)
Peak Season (December, November, January)
- Revenue averages $1,924 per month
- Occupancy rates average 47.2%
- Daily rates average $141
Shoulder Season
- Revenue averages $1,444 per month
- Occupancy maintains around 30.4%
- Daily rates hold near $132
Low Season (August, September, October)
- Revenue drops to average $752 per month
- Occupancy decreases to average 16.2%
- Daily rates adjust to average $123
Seasonality Insights for Ban Pa Daet Tai
- The Airbnb seasonality in Ban Pa Daet Tai shows highly seasonal trends requiring careful strategy. While the sections above show seasonal averages, it's also insightful to look at the extremes:
- During the high season, the absolute peak month showcases Ban Pa Daet Tai's highest earning potential, with monthly revenues capable of climbing to $2,162, occupancy reaching a high of 51.4%, and ADRs peaking at $141.
- Conversely, the slowest single month of the year, typically falling within the low season, marks the market's lowest point. In this month, revenue might dip to $527, occupancy could drop to 14.0%, and ADRs may adjust down to $122.
- Understanding both the seasonal averages and these monthly peaks and troughs in revenue, occupancy, and ADR is crucial for maximizing your Airbnb profit potential in Ban Pa Daet Tai.
Seasonal Strategies for Maximizing Profit
- Peak Season: Maximize revenue through premium pricing and potentially longer minimum stays. Ensure high availability.
- Low Season: Offer competitive pricing, special promotions (e.g., extended stay discounts), and flexible cancellation policies. Target off-season travelers like remote workers or budget-conscious guests.
- Shoulder Seasons: Implement dynamic pricing that balances peak and low rates. Target weekend travelers or specific events. Offer slightly more flexible terms than peak season.
- Regularly analyze your own performance against these Ban Pa Daet Tai seasonality benchmarks and adjust your pricing and availability strategy accordingly.
Best Areas for Airbnb Investment in Ban Pa Daet Tai (2025)
Exploring the top neighborhoods for short-term rentals in Ban Pa Daet Tai? This section highlights key areas, outlining why they are attractive for hosts and guests, along with notable local attractions. Consider these locations based on your target guest profile and investment strategy.
| Neighborhood / Area | Why Host Here? (Target Guests & Appeal) | Key Attractions & Landmarks |
|---|---|---|
| Nimmanhaemin | Trendy neighborhood known for its art galleries, coffee shops, and restaurants. Popular among young travelers and digital nomads looking for a vibrant cultural scene. | Kad Suan Kaew Shopping Center, Nimman Road cafes, Museum of World Insects and Natural Resources, Wat Suan Dok, Art in Paradise Chiang Mai |
| Old City | Historical heart of Chiang Mai, filled with ancient temples and cultural landmarks. A prime location for tourists interested in exploring the rich history of the region. | Chiang Mai City Walls, Wat Phra Singh, Wat Chedi Luang, Sunday Walking Street, Three Kings Monument |
| Night Bazaar | A bustling market area known for shopping, food, and nightlife. Attracts both tourists and locals, making it a vibrant place to host visitors. | Chiang Mai Night Bazaar, Warorot Market, Saturday Night Market, Street food vendors, Tavsang Temple |
| Hang Dong | Lush area known for its nature and local attractions. Perfect for those seeking a quieter, more residential experience with close access to nature. | Royal Flora Ratchaphruek, Baan Tawai Village, Wat Phra That Doi Kham, Elephant Nature Park, Hang Dong Golf Club |
| Santitham | Residential area close to the city center, ideal for longer stays and families. Combines local life with easy access to urban amenities. | Santitham Market, Wat Si Bua Ngern, local eateries, Chao Mae Kuan Im Shrine, Green Areas and parks |
| Doi Suthep | Home to the famous Doi Suthep Temple and beautiful mountain scenery. Attracts tourists looking for a spiritual and nature experience with stunning views. | Doi Suthep Temple, Doi Pui National Park, Hiking trails, Local viewpoints, Nature reserves |
| Mae Rim | A scenic area on the outskirts of Chiang Mai, well known for outdoor activities and adventure tourism. Great for guests who love nature and exploring. | Queen Sirikit Botanical Garden, Sankamphaeng Hot Springs, Elephant Camps, Gibbon Rehabilitation Project, Zipline Adventures |
| Chang Phuak | A lively neighborhood close to the city center, known for its street food and local markets. A great base for travelers wanting a local experience. | Chang Phuak Gate, Street food stalls, Chang Phuak Night Market, Wat Chiang Man, local bars and cafes |
Understanding Airbnb License Requirements & STR Laws in Ban Pa Daet Tai (2025)
While Ban Pa Daet Tai, Chiang Mai Province, Thailand currently shows low STR regulations, specific Airbnb license requirements might still exist or change. Always verify the latest short term rental regulations and Airbnb license requirements directly with local government authorities for Ban Pa Daet Tai to ensure full compliance before hosting.
(Source: AirROI data, 2025, finding no licensed listings among those analyzed)
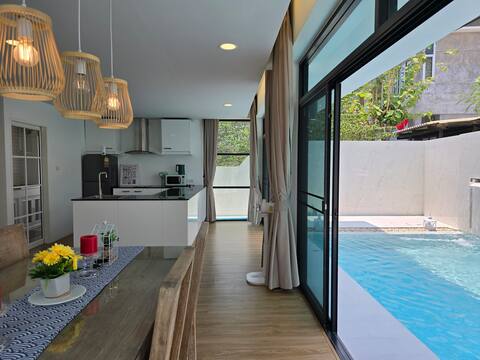
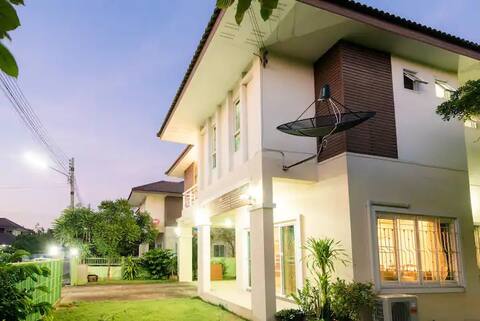
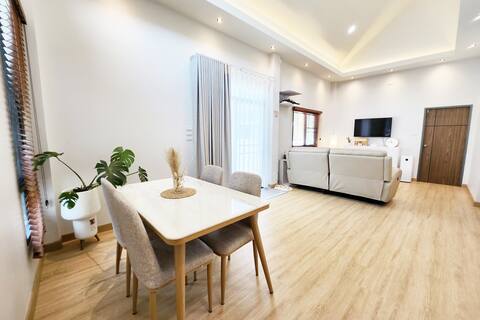
Top Performing Airbnb Properties in Ban Pa Daet Tai (2025)
Benchmark your potential! Explore examples of top-performing Airbnb properties in Ban Pa Daet Taibased on Trailing Twelve Month (TTM) revenue. Analyze their characteristics, revenue, occupancy rate, and ADR to understand what drives success in this market.

Baan Som-O Lanna wood house-Touch the local life
Entire Place • 2 bedrooms
Joy Homes Private Pool Villa
Entire Place • 4 bedrooms

Apantree pool villa
Entire Place • 4 bedrooms
Near Airport relax with family
Entire Place • 4 bedrooms

SummerTime清迈 Twins modern style pool villa现代风泳池别墅
Entire Place • 6 bedrooms
Relax at Our Spacious Home
Entire Place • 3 bedrooms
Note: Performance varies based on location, size, amenities, seasonality, and management quality. Data reflects the past 12 months.
Top Performing Airbnb Hosts in Ban Pa Daet Tai (2025)
Learn from the best! This table showcases top-performing Airbnb hosts in Ban Pa Daet Tai based on the number of properties managed and estimated total revenue over the past year. Analyze their scale and performance metrics.
| Host Name | Properties | Grossing Revenue | Stay Reviews | Avg Rating |
|---|---|---|---|---|
| Meena | 1 | $34,544 | 134 | 4.94/5.0 |
| Latcha Elisa | 1 | $22,216 | 1 | Not Rated |
| Nathaorn | 1 | $17,888 | 8 | 5.00/5.0 |
| Papapan | 1 | $14,725 | 2 | Not Rated |
| Summer | 1 | $10,059 | 8 | 4.88/5.0 |
| Empicha | 1 | $9,180 | 1 | Not Rated |
| Suparp | 3 | $6,907 | 9 | 5.00/5.0 |
| Pattararin | 1 | $6,775 | 6 | 4.83/5.0 |
| Vivian | 2 | $4,816 | 6 | 5.00/5.0 |
| Noi | 1 | $4,237 | 12 | 4.50/5.0 |
Analyzing the strategies of top hosts, such as their property selection, pricing, and guest communication, can offer valuable lessons for optimizing your own Airbnb operations in Ban Pa Daet Tai.
Dive Deeper: Advanced Ban Pa Daet Tai STR Market Data (2025)
Ready to unlock more insights? AirROI provides access to advanced metrics and comprehensive Airbnb data for Ban Pa Daet Tai. Explore detailed analytics beyond this report to refine your investment strategy, optimize pricing, and maximize your vacation rental profits.
Explore Advanced MetricsBan Pa Daet Tai Short-Term Rental Market Composition (2025): Property & Room Types
Room Type Distribution
Property Type Distribution
Market Composition Insights for Ban Pa Daet Tai
- The Ban Pa Daet Tai Airbnb market composition is heavily skewed towards Entire Home/Apt listings, which make up 84.2% of the 19 active rentals. This indicates strong guest preference for privacy and space.
- Looking at the property type distribution in Ban Pa Daet Tai, House properties are the most common (68.4%), reflecting the local real estate landscape.
- Houses represent a significant 68.4% portion, catering likely to families or larger groups.
- The presence of 5.3% Hotel/Boutique listings indicates integration with traditional hospitality.
Ban Pa Daet Tai Airbnb Room Capacity Analysis (2025): Bedroom Distribution
Distribution of Listings by Number of Bedrooms
Room Capacity Insights for Ban Pa Daet Tai
- The dominant room capacity in Ban Pa Daet Tai is 4 bedrooms listings, making up 26.3% of the market. This suggests a strong demand for properties suitable for families or small groups.
- Together, 4 bedrooms and 1 bedroom properties represent 52.6% of the active Airbnb listings in Ban Pa Daet Tai, indicating a high concentration in these sizes.
- A significant 47.3% of listings offer 3+ bedrooms, catering to larger groups and families seeking more space in Ban Pa Daet Tai.
Ban Pa Daet Tai Vacation Rental Guest Capacity Trends (2025)
Distribution of Listings by Guest Capacity
Guest Capacity Insights for Ban Pa Daet Tai
- The most common guest capacity trend in Ban Pa Daet Tai vacation rentals is listings accommodating 8+ guests (26.3%). This suggests the primary traveler segment is likely larger groups.
- Properties designed for 8+ guests and 2 guests dominate the Ban Pa Daet Tai STR market, accounting for 47.4% of listings.
- 47.3% of properties accommodate 6+ guests, serving the market segment for larger families or group travel in Ban Pa Daet Tai.
- On average, properties in Ban Pa Daet Tai are equipped to host 4.7 guests.
Ban Pa Daet Tai Airbnb Booking Patterns (2025): Available vs. Booked Days
Available Days Distribution
Booked Days Distribution
Booking Pattern Insights for Ban Pa Daet Tai
- The most common availability pattern in Ban Pa Daet Tai falls within the 271-366 days range, representing 89.5% of listings. This suggests many properties have significant open periods on their calendars.
- Approximately 94.8% of listings show high availability (181+ days open annually), indicating potential for increased bookings or specific owner usage patterns.
- For booked days, the 31-90 days range is most frequent in Ban Pa Daet Tai (42.1%), reflecting common guest stay durations or potential owner blocking patterns.
- A notable 5.3% of properties secure long booking periods (181+ days booked per year), highlighting successful long-term rental strategies or significant owner usage.
Ban Pa Daet Tai Airbnb Minimum Stay Requirements Analysis
Distribution of Listings by Minimum Night Requirement
1 Night
6 listings
31.6% of total
2 Nights
3 listings
15.8% of total
3 Nights
2 listings
10.5% of total
4-6 Nights
2 listings
10.5% of total
7-29 Nights
2 listings
10.5% of total
30+ Nights
4 listings
21.1% of total
Key Insights
- The most prevalent minimum stay requirement in Ban Pa Daet Tai is 1 Night, adopted by 31.6% of listings. This highlights the market's preference for shorter, flexible bookings.
- A significant segment (21.1%) caters to monthly stays (30+ nights) in Ban Pa Daet Tai, pointing to opportunities in the extended-stay market.
Recommendations
- Align with the market by considering a 1 Night minimum stay, as 31.6% of Ban Pa Daet Tai hosts use this setting.
- Explore offering discounts for stays of 30+ nights to attract the 21.1% of the market seeking extended stays.
- Adjust minimum nights based on seasonality – potentially shorter during low season and longer during peak demand periods in Ban Pa Daet Tai.
Ban Pa Daet Tai Airbnb Cancellation Policy Trends Analysis (2025)
Flexible
3 listings
15.8% of total
Moderate
5 listings
26.3% of total
Firm
5 listings
26.3% of total
Strict
6 listings
31.6% of total
Cancellation Policy Insights for Ban Pa Daet Tai
- The prevailing Airbnb cancellation policy trend in Ban Pa Daet Tai is Strict, used by 31.6% of listings.
- A majority (57.9%) of hosts in Ban Pa Daet Tai utilize Firm or Strict policies, indicating a market where hosts prioritize booking security.
Recommendations for Hosts
- Consider adopting a Strict policy to align with the 31.6% market standard in Ban Pa Daet Tai.
- With 31.6% using Strict terms, this is a viable option in Ban Pa Daet Tai, particularly for high-value properties or during peak demand periods.
- Regularly review your cancellation policy against competitors and market demand shifts in Ban Pa Daet Tai.
Ban Pa Daet Tai STR Booking Lead Time Analysis (2025)
Average Booking Lead Time by Month
Booking Lead Time Insights for Ban Pa Daet Tai
- The overall average booking lead time for vacation rentals in Ban Pa Daet Tai is 21 days.
- Guests book furthest in advance for stays during July (average 49 days), likely coinciding with peak travel demand or local events.
- The shortest booking windows occur for stays in May (average 10 days), indicating more last-minute travel plans during this time.
- Seasonally, Fall (35 days avg.) sees the longest lead times, while Spring (22 days avg.) has the shortest, reflecting typical travel planning cycles.
Recommendations for Hosts
- Use the overall average lead time (21 days) as a baseline for your pricing and availability strategy in Ban Pa Daet Tai.
- For July stays, consider implementing length-of-stay discounts or slightly higher rates for bookings made less than 49 days out to capitalize on advance planning.
- During May, focus on last-minute booking availability and promotions, as guests book with very short notice (10 days avg.).
- Target marketing efforts for the Fall season well in advance (at least 35 days) to capture early planners.
- Monitor your own booking lead times against these Ban Pa Daet Tai averages to identify opportunities for dynamic pricing adjustments.
Popular & Essential Airbnb Amenities in Ban Pa Daet Tai (2025)
Amenity Prevalence
Amenity Insights for Ban Pa Daet Tai
- Essential amenities in Ban Pa Daet Tai that guests expect include: Air conditioning, Free parking on premises, Wifi. Lacking these (any) could significantly impact bookings.
- Popular amenities like Dedicated workspace, Kitchen, Washer are common but not universal. Offering these can provide a competitive edge.
Recommendations for Hosts
- Ensure your listing includes all essential amenities for Ban Pa Daet Tai: Air conditioning, Free parking on premises, Wifi.
- Consider adding popular differentiators like Dedicated workspace or Kitchen to increase appeal.
- Highlight unique or less common amenities you offer (e.g., hot tub, dedicated workspace, EV charger) in your listing description and photos.
- Regularly check competitor amenities in Ban Pa Daet Tai to stay competitive.
Ban Pa Daet Tai Airbnb Guest Demographics & Profile Analysis (2025)
Guest Profile Summary for Ban Pa Daet Tai
- The typical guest profile for Airbnb in Ban Pa Daet Tai consists of predominantly international visitors (97%), with top international origins including China, typically belonging to the Post-2000s (Gen Z/Alpha) group (50%), primarily speaking English or German.
- Domestic travelers account for 3.4% of guests.
- Key international markets include United Kingdom (17.2%) and China (13.8%).
- Top languages spoken are English (39.6%) followed by German (10.4%).
- A significant demographic segment is the Post-2000s (Gen Z/Alpha) group, representing 50% of guests.
Recommendations for Hosts
- Focus marketing internationally, particularly towards travelers from China.
- Tailor amenities and listing descriptions to appeal to the dominant Post-2000s (Gen Z/Alpha) demographic (e.g., highlight fast WiFi, smart home features, local guides).
- Highlight unique local experiences or amenities relevant to the primary guest profile.
- Consider seasonal promotions aligned with peak travel times for key origin markets.
Nearby Short-Term Rental Market Comparison
How does the Ban Pa Daet Tai Airbnb market stack up against its neighbors? Compare key performance metrics like average monthly revenue, ADR, and occupancy rates in surrounding areas to understand the broader regional STR landscape.
| Market | Active Properties | Monthly Revenue | Daily Rate | Avg. Occupancy |
|---|---|---|---|---|
| Don Keow Village | 23 | $1,430 | $141.67 | 37% |
| Mae Rim | 14 | $1,253 | $183.03 | 31% |
| Ban Tong Kai | 10 | $1,179 | $210.10 | 36% |
| Ban Muang Kung | 12 | $1,049 | $162.83 | 28% |
| Ban Tom | 11 | $1,043 | $149.30 | 36% |
| Nong Hoi | 204 | $927 | $80.15 | 48% |
| Ban Pa Daet North | 14 | $910 | $102.12 | 42% |
| San Phra Net | 43 | $850 | $123.03 | 39% |
| Ban Ko Klang | 19 | $832 | $159.19 | 36% |
| Ban Sai Kham | 32 | $777 | $127.90 | 42% |