Pa Daet Sub-district Airbnb Market Analysis 2026: Short Term Rental Data & Vacation Rental Statistics in Chiang Mai, Thailand
Is Airbnb profitable in Pa Daet Sub-district in 2026? Explore comprehensive Airbnb analytics for Pa Daet Sub-district, Chiang Mai, Thailand to uncover income potential. This 2026 STR market report for Pa Daet Sub-district, based on AirROI data from February 2025 to January 2026, reveals key trends in the niche market of 23 active listings.
Whether you're considering an Airbnb investment in Pa Daet Sub-district, optimizing your existing vacation rental, or exploring rental arbitrage opportunities, understanding the Pa Daet Sub-district Airbnb data is crucial. Leveraging the low regulation environment is key to maximizing your short term rental income potential. Let's dive into the specifics.
Key Pa Daet Sub-district Airbnb Performance Metrics Overview
Monthly Airbnb Revenue Variations & Income Potential in Pa Daet Sub-district (2026)
Understanding the monthly revenue variations for Airbnb listings in Pa Daet Sub-district is key to maximizing your short term rental income potential. Seasonality significantly impacts earnings. Our analysis, based on data from the past 12 months, shows that the peak revenue month for STRs in Pa Daet Sub-district is typically December, while May often presents the lowest earnings, highlighting opportunities for strategic pricing adjustments during shoulder and low seasons. Explore the typical Airbnb income in Pa Daet Sub-district across different performance tiers:
- Best-in-class properties (Top 10%) achieve $2,234+ monthly, often utilizing dynamic pricing and superior guest experiences.
- Strong performing properties (Top 25%) earn $1,268 or more, indicating effective management and desirable locations/amenities.
- Typical properties (Median) generate around $699 per month, representing the average market performance.
- Entry-level properties (Bottom 25%) see earnings around $313, often with potential for optimization.
Average Monthly Airbnb Earnings Trend in Pa Daet Sub-district
Pa Daet Sub-district Airbnb Occupancy Rate Trends (2026)
Maximize your bookings by understanding the Pa Daet Sub-district STR occupancy trends. Seasonal demand shifts significantly influence how often properties are booked. Typically, Decembersees the highest demand (peak season occupancy), while May experiences the lowest (low season). Effective strategies, like adjusting minimum stays or offering promotions, can boost occupancy during slower periods. Here's how different property tiers perform in Pa Daet Sub-district:
- Best-in-class properties (Top 10%) achieve 75%+ occupancy, indicating high desirability and potentially optimized availability.
- Strong performing properties (Top 25%) maintain 64% or higher occupancy, suggesting good market fit and guest satisfaction.
- Typical properties (Median) have an occupancy rate around 43%.
- Entry-level properties (Bottom 25%) average 23% occupancy, potentially facing higher vacancy.
Average Monthly Occupancy Rate Trend in Pa Daet Sub-district
Average Daily Rate (ADR) Airbnb Trends in Pa Daet Sub-district (2026)
Effective short term rental pricing strategy in Pa Daet Sub-district involves understanding monthly ADR fluctuations. The Average Daily Rate (ADR) for Airbnb in Pa Daet Sub-district typically peaks in January and dips lowest during August. Leveraging Airbnb dynamic pricing tools or strategies based on this seasonality can significantly boost revenue. Here's a look at the typical nightly rates achieved:
- Best-in-class properties (Top 10%) command rates of $223+ per night, often due to premium features or locations.
- Strong performing properties (Top 25%) achieve nightly rates of $90 or more.
- Typical properties (Median) charge around $45 per night.
- Entry-level properties (Bottom 25%) earn around $26 per night.
Average Daily Rate (ADR) Trend by Month in Pa Daet Sub-district
Get Live Pa Daet Sub-district Market Intelligence 👇
Explore Real-time Analytics
Airbnb Seasonality Analysis & Trends in Pa Daet Sub-district (2026)
Peak Season (December, November, July)
- Revenue averages $1,495 per month
- Occupancy rates average 57.3%
- Daily rates average $92
Shoulder Season
- Revenue averages $802 per month
- Occupancy maintains around 38.4%
- Daily rates hold near $80
Low Season (February, March, April)
- Revenue drops to average $0 per month
- Occupancy decreases to average 0.0%
- Daily rates adjust to average $73
Seasonality Insights for Pa Daet Sub-district
- The Airbnb seasonality in Pa Daet Sub-district shows highly seasonal trends requiring careful strategy. While the sections above show seasonal averages, it's also insightful to look at the extremes:
- During the high season, the absolute peak month showcases Pa Daet Sub-district's highest earning potential, with monthly revenues capable of climbing to $1,682, occupancy reaching a high of 70.5%, and ADRs peaking at $108.
- Conversely, the slowest single month of the year, typically falling within the low season, marks the market's lowest point. In this month, revenue might dip to $0, occupancy could drop to 0.0%, and ADRs may adjust down to $69.
- Understanding both the seasonal averages and these monthly peaks and troughs in revenue, occupancy, and ADR is crucial for maximizing your Airbnb profit potential in Pa Daet Sub-district.
Seasonal Strategies for Maximizing Profit
- Peak Season: Maximize revenue through premium pricing and potentially longer minimum stays. Ensure high availability.
- Low Season: Offer competitive pricing, special promotions (e.g., extended stay discounts), and flexible cancellation policies. Target off-season travelers like remote workers or budget-conscious guests.
- Shoulder Seasons: Implement dynamic pricing that balances peak and low rates. Target weekend travelers or specific events. Offer slightly more flexible terms than peak season.
- Regularly analyze your own performance against these Pa Daet Sub-district seasonality benchmarks and adjust your pricing and availability strategy accordingly.
Best Areas for Airbnb Investment in Pa Daet Sub-district (2026)
Exploring the top neighborhoods for short-term rentals in Pa Daet Sub-district? This section highlights key areas, outlining why they are attractive for hosts and guests, along with notable local attractions. Consider these locations based on your target guest profile and investment strategy.
| Neighborhood / Area | Why Host Here? (Target Guests & Appeal) | Key Attractions & Landmarks |
|---|---|---|
| Chang Klan | Located near the Night Bazaar, this area is bustling with markets, shops, and restaurants. Perfect for tourists looking for local experiences and night activities. | Night Bazaar, Anusarn Market, Warorot Market, Chiang Mai Night Safari, Pagoda of Wat Chedi Luang |
| Nimmanhaemin | A chic area known for its cool cafes, boutiques, and art galleries. Popular among young travelers and digital nomads seeking a trendy atmosphere. | Nimmanhaemin Road, Maya Lifestyle Shopping Center, Chiang Mai University, Maya Lifestyle Mall, Art in Paradise 3D Museum |
| Old City | The historical heart of Chiang Mai surrounded by ancient walls and temples. Ideal for tourists wanting to soak in the culture and heritage of the city. | Wat Phra Singh, Wat Chedi Luang, Tha Phae Gate, Chiang Mai City Arts & Cultural Centre, Sunday Walking Street Market |
| Doi Suthep | Offers breathtaking views and is home to the stunning Wat Phra That Doi Suthep temple. Attracts spiritual travelers and nature lovers. | Doi Suthep Temple, Doi Pui National Park, Bhuping Palace, Nature Trails, Hiking Trails |
| Santitham | A growing neighborhood known for its local dining options and community vibe. Attractive to budget-conscious travelers and long-term stays. | Santitham Market, Cafe Doi, Wat Santitham, Local Restaurants, Community Activities |
| Hang Dong | A suburban area known for its peaceful environment, nature escapes, and traditional Thai culture. Ideal for families and those looking to relax. | Royal Flora Ratchaphruek, Baan Tawai Village, Promenada Resort Mall, Huay Tung Tao Lake, Secret Garden |
| Thapae Gate | A central gateway area filled with hotels, cafes, and nightlife. Great for tourists seeking convenience and proximity to attractions. | Thapae Gate, Walking Street Market, Chiang Mai Jazz Festival, Chiang Mai's Old City, Cultural Shows |
| Rim Nuea | A quieter area near the river, offering serene views and riverside dining. Suitable for couples and those seeking a romantic getaway. | Riverside Restaurants, Chiang Mai Zoo, Forest Park, Canoeing, Nature Walks |
Understanding Airbnb License Requirements & STR Laws in Pa Daet Sub-district (2026)
While Pa Daet Sub-district, Chiang Mai, Thailand currently shows low STR regulations, specific Airbnb license requirements might still exist or change. Always verify the latest short term rental regulations and Airbnb license requirements directly with local government authorities for Pa Daet Sub-district to ensure full compliance before hosting.
(Source: AirROI data, 2026, finding no licensed listings among those analyzed)
Top Performing Airbnb Properties in Pa Daet Sub-district (2026)
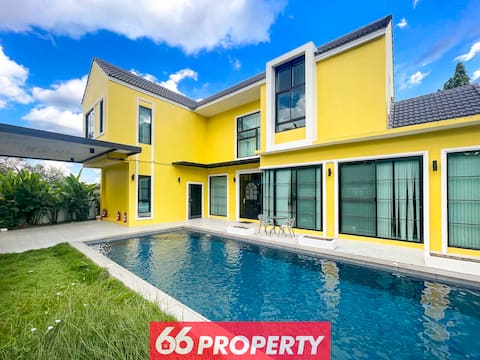
Benchmark your potential! Explore examples of top-performing Airbnb properties in Pa Daet Sub-districtbased on Trailing Twelve Month (TTM) revenue. Analyze their characteristics, revenue, occupancy rate, and ADR to understand what drives success in this market.
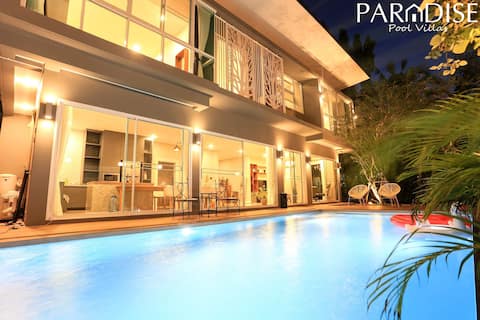
Private Pool Villa 6 Bedroom - Cloud Nine Villa
Entire Place • 6 bedrooms
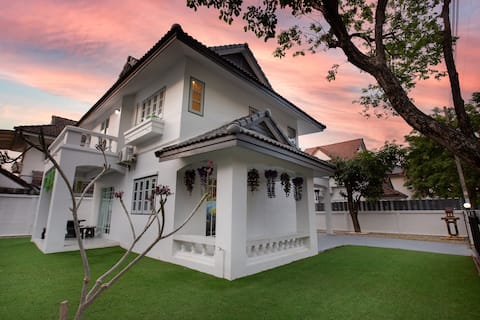
Por's 3 Bedroom Chiang Mai path
Entire Place • 3 bedrooms
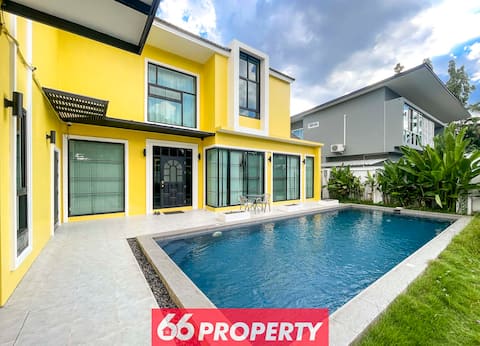
Best Price! 6 Bedroom Pool Villa by Old City
Entire Place • 6 bedrooms

Family Suite/Nice Pool/Full Facilities/Self Check
Entire Place • 2 bedrooms
6 Bedroom Pool Villa near Airport and City
Entire Place • 6 bedrooms
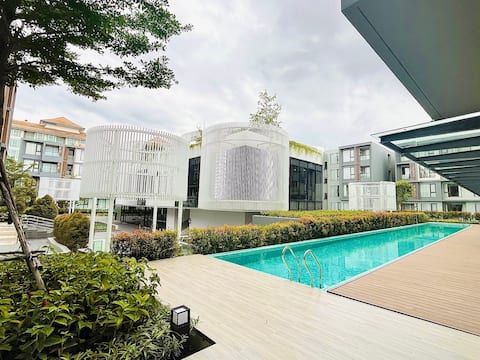
Le Chamonix/Central shopping mall airport store
Entire Place • 2 bedrooms
Note: Performance varies based on location, size, amenities, seasonality, and management quality. Data reflects the past 12 months.
Top Performing Airbnb Hosts in Pa Daet Sub-district (2026)
Learn from the best! This table showcases top-performing Airbnb hosts in Pa Daet Sub-district based on the number of properties managed and estimated total revenue over the past year. Analyze their scale and performance metrics.
| Host Name | Properties | Grossing Revenue | Stay Reviews | Avg Rating |
|---|---|---|---|---|
| Uttawit | 1 | $38,077 | 5 | 5.00/5.0 |
| Raviwan | 2 | $16,576 | 17 | 4.76/5.0 |
| Paul | 1 | $13,976 | 26 | 4.92/5.0 |
| Immy | 1 | $12,704 | 3 | 4.67/5.0 |
| Wendy | 1 | $11,062 | 11 | 4.91/5.0 |
| Kiko | 1 | $9,208 | 12 | 5.00/5.0 |
| Chang | 3 | $8,548 | 22 | 4.78/5.0 |
| Kanyapuk | 1 | $6,672 | 12 | 4.67/5.0 |
| Shanline | 1 | $6,362 | 7 | 5.00/5.0 |
| Gary | 1 | $5,629 | 6 | 5.00/5.0 |
Analyzing the strategies of top hosts, such as their property selection, pricing, and guest communication, can offer valuable lessons for optimizing your own Airbnb operations in Pa Daet Sub-district.
Dive Deeper: Advanced Pa Daet Sub-district STR Market Data (2026)
Ready to unlock more insights? AirROI provides access to advanced metrics and comprehensive Airbnb data for Pa Daet Sub-district. Explore detailed analytics beyond this report to refine your investment strategy, optimize pricing, and maximize your vacation rental profits.
Explore Advanced MetricsPa Daet Sub-district Short-Term Rental Market Composition (2026): Property & Room Types
Room Type Distribution
Property Type Distribution
Market Composition Insights for Pa Daet Sub-district
- The Pa Daet Sub-district Airbnb market composition is heavily skewed towards Entire Home/Apt listings, which make up 82.6% of the 23 active rentals. This indicates strong guest preference for privacy and space.
- Looking at the property type distribution in Pa Daet Sub-district, House properties are the most common (52.2%), reflecting the local real estate landscape.
- Houses represent a significant 52.2% portion, catering likely to families or larger groups.
Pa Daet Sub-district Airbnb Room Capacity Analysis (2026): Bedroom Distribution
Distribution of Listings by Number of Bedrooms
Room Capacity Insights for Pa Daet Sub-district
- The dominant room capacity in Pa Daet Sub-district is 1 bedroom listings, making up 34.8% of the market. This suggests a strong demand for properties suitable for couples or solo travelers.
- Together, 1 bedroom and 2 bedrooms properties represent 52.2% of the active Airbnb listings in Pa Daet Sub-district, indicating a high concentration in these sizes.
- A significant 34.7% of listings offer 3+ bedrooms, catering to larger groups and families seeking more space in Pa Daet Sub-district.
Pa Daet Sub-district Vacation Rental Guest Capacity Trends (2026)
Distribution of Listings by Guest Capacity
Guest Capacity Insights for Pa Daet Sub-district
- The most common guest capacity trend in Pa Daet Sub-district vacation rentals is listings accommodating 2 guests (30.4%). This suggests the primary traveler segment is likely couples or solo travelers.
- Properties designed for 2 guests and 8+ guests dominate the Pa Daet Sub-district STR market, accounting for 47.8% of listings.
- 30.4% of properties accommodate 6+ guests, serving the market segment for larger families or group travel in Pa Daet Sub-district.
- On average, properties in Pa Daet Sub-district are equipped to host 3.6 guests.
Pa Daet Sub-district Airbnb Booking Patterns (2026): Available vs. Booked Days
Available Days Distribution
Booked Days Distribution
Booking Pattern Insights for Pa Daet Sub-district
- The most common availability pattern in Pa Daet Sub-district falls within the 271-366 days range, representing 56.5% of listings. This suggests many properties have significant open periods on their calendars.
- Approximately 95.6% of listings show high availability (181+ days open annually), indicating potential for increased bookings or specific owner usage patterns.
- For booked days, the 91-180 days range is most frequent in Pa Daet Sub-district (39.1%), reflecting common guest stay durations or potential owner blocking patterns.
- A notable 4.3% of properties secure long booking periods (181+ days booked per year), highlighting successful long-term rental strategies or significant owner usage.
Pa Daet Sub-district Airbnb Minimum Stay Requirements Analysis
Distribution of Listings by Minimum Night Requirement
1 Night
10 listings
43.5% of total
2 Nights
4 listings
17.4% of total
7-29 Nights
3 listings
13% of total
30+ Nights
6 listings
26.1% of total
Key Insights
- The most prevalent minimum stay requirement in Pa Daet Sub-district is 1 Night, adopted by 43.5% of listings. This highlights the market's preference for shorter, flexible bookings.
- A strong majority (60.9%) of the Pa Daet Sub-district Airbnb data shows acceptance of very short stays (1-2 nights), indicating a dynamic, high-turnover market.
- A significant segment (26.1%) caters to monthly stays (30+ nights) in Pa Daet Sub-district, pointing to opportunities in the extended-stay market.
Recommendations
- Align with the market by considering a 1 Night minimum stay, as 43.5% of Pa Daet Sub-district hosts use this setting.
- Explore offering discounts for stays of 30+ nights to attract the 26.1% of the market seeking extended stays.
- Adjust minimum nights based on seasonality – potentially shorter during low season and longer during peak demand periods in Pa Daet Sub-district.
Pa Daet Sub-district Airbnb Cancellation Policy Trends Analysis (2026)
Limited
1 listings
4.3% of total
Flexible
5 listings
21.7% of total
Moderate
11 listings
47.8% of total
Firm
5 listings
21.7% of total
Strict
1 listings
4.3% of total
Cancellation Policy Insights for Pa Daet Sub-district
- The prevailing Airbnb cancellation policy trend in Pa Daet Sub-district is Moderate, used by 47.8% of listings.
- There's a relatively balanced mix between guest-friendly (69.5%) and stricter (26.0%) policies, offering choices for different guest needs.
- Strict cancellation policies are quite rare (4.3%), potentially making listings with this policy less competitive unless justified by high demand or property type.
Recommendations for Hosts
- Consider adopting a Moderate policy to align with the 47.8% market standard in Pa Daet Sub-district.
- Using a Strict policy might deter some guests, as only 4.3% of listings use it. Evaluate if potential revenue protection outweighs possible lower booking rates.
- Regularly review your cancellation policy against competitors and market demand shifts in Pa Daet Sub-district.
Pa Daet Sub-district STR Booking Lead Time Analysis (2026)
Average Booking Lead Time by Month
Booking Lead Time Insights for Pa Daet Sub-district
- The overall average booking lead time for vacation rentals in Pa Daet Sub-district is 21 days.
- Guests book furthest in advance for stays during December (average 43 days), likely coinciding with peak travel demand or local events.
- The shortest booking windows occur for stays in April (average 0 days), indicating more last-minute travel plans during this time.
- Seasonally, Fall (28 days avg.) sees the longest lead times, while Spring (1 days avg.) has the shortest, reflecting typical travel planning cycles.
Recommendations for Hosts
- Use the overall average lead time (21 days) as a baseline for your pricing and availability strategy in Pa Daet Sub-district.
- For December stays, consider implementing length-of-stay discounts or slightly higher rates for bookings made less than 43 days out to capitalize on advance planning.
- During April, focus on last-minute booking availability and promotions, as guests book with very short notice (0 days avg.).
- Target marketing efforts for the Fall season well in advance (at least 28 days) to capture early planners.
- Monitor your own booking lead times against these Pa Daet Sub-district averages to identify opportunities for dynamic pricing adjustments.
Popular & Essential Airbnb Amenities in Pa Daet Sub-district (2026)
Amenity Prevalence
Amenity Insights for Pa Daet Sub-district
- Essential amenities in Pa Daet Sub-district that guests expect include: Air conditioning, Wifi. Lacking these (any) could significantly impact bookings.
- Popular amenities like Free parking on premises, Kitchen, Hair dryer are common but not universal. Offering these can provide a competitive edge.
Recommendations for Hosts
- Ensure your listing includes all essential amenities for Pa Daet Sub-district: Air conditioning, Wifi.
- Consider adding popular differentiators like Free parking on premises or Kitchen to increase appeal.
- Highlight unique or less common amenities you offer (e.g., hot tub, dedicated workspace, EV charger) in your listing description and photos.
- Regularly check competitor amenities in Pa Daet Sub-district to stay competitive.
Pa Daet Sub-district Airbnb Guest Demographics & Profile Analysis (2026)
Guest Profile Summary for Pa Daet Sub-district
- The typical guest profile for Airbnb in Pa Daet Sub-district consists of predominantly international visitors (92%), with top international origins including United States, typically belonging to the Post-2000s (Gen Z/Alpha) group (50%), primarily speaking English or Spanish.
- Domestic travelers account for 8.3% of guests.
- Key international markets include China (14.6%) and United States (14.6%).
- Top languages spoken are English (49.1%) followed by Spanish (12.7%).
- A significant demographic segment is the Post-2000s (Gen Z/Alpha) group, representing 50% of guests.
Recommendations for Hosts
- Focus marketing internationally, particularly towards travelers from United States.
- Tailor amenities and listing descriptions to appeal to the dominant Post-2000s (Gen Z/Alpha) demographic (e.g., highlight fast WiFi, smart home features, local guides).
- Highlight unique local experiences or amenities relevant to the primary guest profile.
- Consider seasonal promotions aligned with peak travel times for key origin markets.
Nearby Short-Term Rental Market Comparison
How does the Pa Daet Sub-district Airbnb market stack up against its neighbors? Compare key performance metrics like average monthly revenue, ADR, and occupancy rates in surrounding areas to understand the broader regional STR landscape.
| Market | Active Properties | Monthly Revenue | Daily Rate | Avg. Occupancy |
|---|---|---|---|---|
| San Phranet | 10 | $1,693 | $253.12 | 37% |
| Mae Rim | 11 | $1,196 | $171.86 | 32% |
| Tambon Si Phum | 29 | $1,166 | $81.79 | 47% |
| Ban Muang Kung | 10 | $1,033 | $172.00 | 29% |
| Don Keow Village | 23 | $1,023 | $137.65 | 33% |
| Si Phum | 23 | $959 | $108.01 | 50% |
| Ban Tom | 11 | $930 | $141.78 | 34% |
| Ban Pong | 13 | $907 | $180.20 | 29% |
| Nong Hoi | 194 | $830 | $77.75 | 45% |
| Ban Rong Ruea Kham | 19 | $826 | $110.36 | 35% |