Bang Sare Airbnb Market Analysis 2026: Short Term Rental Data & Vacation Rental Statistics in Chon Buri Province, Thailand
Is Airbnb profitable in Bang Sare in 2026? Explore comprehensive Airbnb analytics for Bang Sare, Chon Buri Province, Thailand to uncover income potential. This 2026 STR market report for Bang Sare, based on AirROI data from February 2025 to January 2026, reveals key trends in the niche market of 107 active listings.
Whether you're considering an Airbnb investment in Bang Sare, optimizing your existing vacation rental, or exploring rental arbitrage opportunities, understanding the Bang Sare Airbnb data is crucial. Leveraging the low regulation environment is key to maximizing your short term rental income potential. Let's dive into the specifics.
Key Bang Sare Airbnb Performance Metrics Overview
Monthly Airbnb Revenue Variations & Income Potential in Bang Sare (2026)
Understanding the monthly revenue variations for Airbnb listings in Bang Sare is key to maximizing your short term rental income potential. Seasonality significantly impacts earnings. Our analysis, based on data from the past 12 months, shows that the peak revenue month for STRs in Bang Sare is typically December, while September often presents the lowest earnings, highlighting opportunities for strategic pricing adjustments during shoulder and low seasons. Explore the typical Airbnb income in Bang Sare across different performance tiers:
- Best-in-class properties (Top 10%) achieve $3,308+ monthly, often utilizing dynamic pricing and superior guest experiences.
- Strong performing properties (Top 25%) earn $1,731 or more, indicating effective management and desirable locations/amenities.
- Typical properties (Median) generate around $789 per month, representing the average market performance.
- Entry-level properties (Bottom 25%) see earnings around $322, often with potential for optimization.
Average Monthly Airbnb Earnings Trend in Bang Sare
Bang Sare Airbnb Occupancy Rate Trends (2026)
Maximize your bookings by understanding the Bang Sare STR occupancy trends. Seasonal demand shifts significantly influence how often properties are booked. Typically, Marchsees the highest demand (peak season occupancy), while September experiences the lowest (low season). Effective strategies, like adjusting minimum stays or offering promotions, can boost occupancy during slower periods. Here's how different property tiers perform in Bang Sare:
- Best-in-class properties (Top 10%) achieve 64%+ occupancy, indicating high desirability and potentially optimized availability.
- Strong performing properties (Top 25%) maintain 42% or higher occupancy, suggesting good market fit and guest satisfaction.
- Typical properties (Median) have an occupancy rate around 23%.
- Entry-level properties (Bottom 25%) average 12% occupancy, potentially facing higher vacancy.
Average Monthly Occupancy Rate Trend in Bang Sare
Average Daily Rate (ADR) Airbnb Trends in Bang Sare (2026)
Effective short term rental pricing strategy in Bang Sare involves understanding monthly ADR fluctuations. The Average Daily Rate (ADR) for Airbnb in Bang Sare typically peaks in April and dips lowest during October. Leveraging Airbnb dynamic pricing tools or strategies based on this seasonality can significantly boost revenue. Here's a look at the typical nightly rates achieved:
- Best-in-class properties (Top 10%) command rates of $299+ per night, often due to premium features or locations.
- Strong performing properties (Top 25%) achieve nightly rates of $183 or more.
- Typical properties (Median) charge around $85 per night.
- Entry-level properties (Bottom 25%) earn around $45 per night.
Average Daily Rate (ADR) Trend by Month in Bang Sare
Get Live Bang Sare Market Intelligence 👇

Explore Real-time Analytics
Airbnb Seasonality Analysis & Trends in Bang Sare (2026)
Peak Season (December, April, March)
- Revenue averages $1,817 per month
- Occupancy rates average 39.6%
- Daily rates average $157
Shoulder Season
- Revenue averages $1,371 per month
- Occupancy maintains around 29.0%
- Daily rates hold near $154
Low Season (June, September, November)
- Revenue drops to average $1,018 per month
- Occupancy decreases to average 21.9%
- Daily rates adjust to average $154
Seasonality Insights for Bang Sare
- The Airbnb seasonality in Bang Sare shows highly seasonal trends requiring careful strategy. While the sections above show seasonal averages, it's also insightful to look at the extremes:
- During the high season, the absolute peak month showcases Bang Sare's highest earning potential, with monthly revenues capable of climbing to $2,186, occupancy reaching a high of 42.9%, and ADRs peaking at $160.
- Conversely, the slowest single month of the year, typically falling within the low season, marks the market's lowest point. In this month, revenue might dip to $932, occupancy could drop to 17.9%, and ADRs may adjust down to $150.
- Understanding both the seasonal averages and these monthly peaks and troughs in revenue, occupancy, and ADR is crucial for maximizing your Airbnb profit potential in Bang Sare.
Seasonal Strategies for Maximizing Profit
- Peak Season: Maximize revenue through premium pricing and potentially longer minimum stays. Ensure high availability.
- Low Season: Offer competitive pricing, special promotions (e.g., extended stay discounts), and flexible cancellation policies. Target off-season travelers like remote workers or budget-conscious guests.
- Shoulder Seasons: Implement dynamic pricing that balances peak and low rates. Target weekend travelers or specific events. Offer slightly more flexible terms than peak season.
- Regularly analyze your own performance against these Bang Sare seasonality benchmarks and adjust your pricing and availability strategy accordingly.
Best Areas for Airbnb Investment in Bang Sare (2026)
Exploring the top neighborhoods for short-term rentals in Bang Sare? This section highlights key areas, outlining why they are attractive for hosts and guests, along with notable local attractions. Consider these locations based on your target guest profile and investment strategy.
| Neighborhood / Area | Why Host Here? (Target Guests & Appeal) | Key Attractions & Landmarks |
|---|---|---|
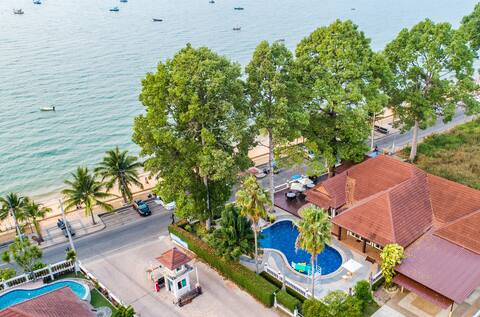
| Bang Sare Beach | A serene beach destination known for its beautiful coastline and relaxing environment. Perfect for families and couples looking for a peaceful getaway. | Bang Sare Beach, Nong Nooch Tropical Garden, Silverlake Vineyard, Khao Chee Chan, Sea Turtle Conservation Center |
| Sattahip | A nearby coastal town that offers mix of local culture and beautiful beaches. Attracts tourists looking for adventure and marine activities. | Sattahip Naval Base, Dongtan Beach, Sattahip Beach, Rim Pae Beach, Koh Chang |
| Pattaya | While not in Bang Sare itself, it's a short drive away and attracts a large number of tourists. Ideal for hosting as Pattaya has a vibrant nightlife and various entertainment options. | Walking Street, Pattaya Beach, Sanctuary of Truth, Nong Nooch Tropical Garden, Art in Paradise |
| Ban Amphur | A lesser-known gem with beautiful beaches and a more local atmosphere, great for those looking to escape the tourist crowds of Pattaya. | Ban Amphur Beach, Silverlake Vineyard, Koh Larn, Floating Market, Pattaya Elephant Village |
| Na Jomtien | Close to Bang Sare, Na Jomtien offers peaceful beaches and is gaining popularity for its family-friendly environment and local dining options. | Mimosa Pattaya, Jomtien Beach, Pattaya floating market, Pattaya Water Park, Ocean Marina Yacht Club |
| Koh Larn | A stunning island just off the coast of Bang Sare known for its crystal clear waters and beautiful beaches. Highly sought after for beachfront properties. | Thakids Beach, Samae Beach, Tien Beach, Koh Larn viewpoint, Koh Larn beach activities |
| Jomtien Beach | A popular beach area with a vibrant community perfect for long-term and vacation rentals. Offers a wide range of dining and activities. | Jomtien Beach, Thepprasit Night Market, Cartoon Network Amazone, Pattaya Floating Market, Buddha Mountain |
| Sukhumvit Road | Main road attracting many tourists and travelers who seek convenient access to various destinations in the area, especially for urban experiences. | Shopping Malls, Local Markets, Restaurants, Bars and Nightclubs, Tourist Information Centers |
Understanding Airbnb License Requirements & STR Laws in Bang Sare (2026)
While Bang Sare, Chon Buri Province, Thailand currently shows low STR regulations, specific Airbnb license requirements might still exist or change. Always verify the latest short term rental regulations and Airbnb license requirements directly with local government authorities for Bang Sare to ensure full compliance before hosting.
(Source: AirROI data, 2026, based on 1% licensed listings)
Top Performing Airbnb Properties in Bang Sare (2026)
Benchmark your potential! Explore examples of top-performing Airbnb properties in Bang Sarebased on Trailing Twelve Month (TTM) revenue. Analyze their characteristics, revenue, occupancy rate, and ADR to understand what drives success in this market.
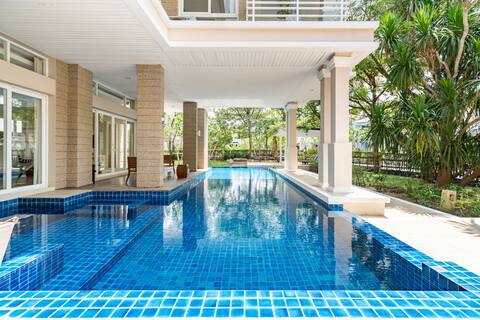
BeachFront Private pool• BigTerrace• 5BedRoom•Wifi
Entire Place • 5 bedrooms
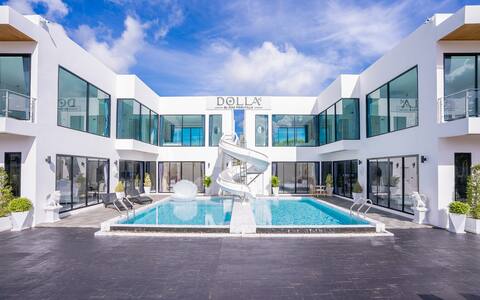
Dolla Pool Villa Bang Saray
Entire Place • 8 bedrooms
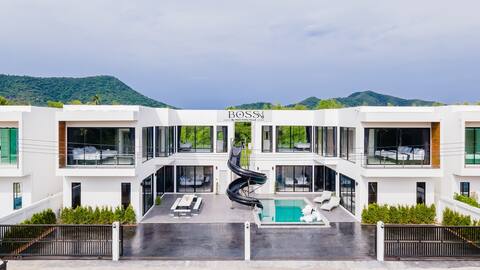
Boss Pool Villa
Entire Place • 8 bedrooms
Luxurious Beachfront 3 Bedroom Villa
Entire Place • 3 bedrooms
Natural Villas Na Jomtien Pattaya Private Pool
Entire Place • 4 bedrooms
บ้านพักติดทะเล About a beach Pool Villa
Entire Place • 4 bedrooms
Note: Performance varies based on location, size, amenities, seasonality, and management quality. Data reflects the past 12 months.
Top Performing Airbnb Hosts in Bang Sare (2026)
Learn from the best! This table showcases top-performing Airbnb hosts in Bang Sare based on the number of properties managed and estimated total revenue over the past year. Analyze their scale and performance metrics.
| Host Name | Properties | Grossing Revenue | Stay Reviews | Avg Rating |
|---|---|---|---|---|
| Nantiya | 2 | $99,271 | 3 | Not Rated |
| Viia | 1 | $71,821 | 8 | 4.75/5.0 |
| Khun Kung | 13 | $65,004 | 129 | 4.72/5.0 |
| Roombix | 8 | $64,585 | 23 | 4.45/5.0 |
| Patty | 3 | $57,428 | 9 | 5.00/5.0 |
| Anya | 2 | $51,322 | 16 | 4.76/5.0 |
| Katherine | 1 | $43,881 | 120 | 4.88/5.0 |
| Philippe | 1 | $43,092 | 13 | 4.69/5.0 |
| Surathin | 1 | $31,136 | 18 | 4.78/5.0 |
| Pip | 1 | $29,635 | 1 | Not Rated |
Analyzing the strategies of top hosts, such as their property selection, pricing, and guest communication, can offer valuable lessons for optimizing your own Airbnb operations in Bang Sare.
Dive Deeper: Advanced Bang Sare STR Market Data (2026)
Ready to unlock more insights? AirROI provides access to advanced metrics and comprehensive Airbnb data for Bang Sare. Explore detailed analytics beyond this report to refine your investment strategy, optimize pricing, and maximize your vacation rental profits.
Explore Advanced MetricsBang Sare Short-Term Rental Market Composition (2026): Property & Room Types
Room Type Distribution
Property Type Distribution
Market Composition Insights for Bang Sare
- The Bang Sare Airbnb market composition is heavily skewed towards Entire Home/Apt listings, which make up 80.4% of the 107 active rentals. This indicates strong guest preference for privacy and space.
- Looking at the property type distribution in Bang Sare, House properties are the most common (48.6%), reflecting the local real estate landscape.
- Houses represent a significant 48.6% portion, catering likely to families or larger groups.
- The presence of 5.6% Hotel/Boutique listings indicates integration with traditional hospitality.
- Smaller segments like others, unique stays (combined 1.8%) offer potential for unique stay experiences.
Bang Sare Airbnb Room Capacity Analysis (2026): Bedroom Distribution
Distribution of Listings by Number of Bedrooms
Room Capacity Insights for Bang Sare
- The dominant room capacity in Bang Sare is 1 bedroom listings, making up 34.6% of the market. This suggests a strong demand for properties suitable for couples or solo travelers.
- Together, 1 bedroom and 3 bedrooms properties represent 56.1% of the active Airbnb listings in Bang Sare, indicating a high concentration in these sizes.
- A significant 42.0% of listings offer 3+ bedrooms, catering to larger groups and families seeking more space in Bang Sare.
Bang Sare Vacation Rental Guest Capacity Trends (2026)
Distribution of Listings by Guest Capacity
Guest Capacity Insights for Bang Sare
- The most common guest capacity trend in Bang Sare vacation rentals is listings accommodating 8+ guests (29.9%). This suggests the primary traveler segment is likely larger groups.
- Properties designed for 8+ guests and 2 guests dominate the Bang Sare STR market, accounting for 55.1% of listings.
- 43.9% of properties accommodate 6+ guests, serving the market segment for larger families or group travel in Bang Sare.
- On average, properties in Bang Sare are equipped to host 4.6 guests.
Bang Sare Airbnb Booking Patterns (2026): Available vs. Booked Days
Available Days Distribution
Booked Days Distribution
Booking Pattern Insights for Bang Sare
- The most common availability pattern in Bang Sare falls within the 271-366 days range, representing 79.4% of listings. This suggests many properties have significant open periods on their calendars.
- Approximately 96.2% of listings show high availability (181+ days open annually), indicating potential for increased bookings or specific owner usage patterns.
- For booked days, the 31-90 days range is most frequent in Bang Sare (43.9%), reflecting common guest stay durations or potential owner blocking patterns.
- A notable 3.7% of properties secure long booking periods (181+ days booked per year), highlighting successful long-term rental strategies or significant owner usage.
Bang Sare Airbnb Minimum Stay Requirements Analysis
Distribution of Listings by Minimum Night Requirement
1 Night
46 listings
43% of total
2 Nights
5 listings
4.7% of total
3 Nights
2 listings
1.9% of total
4-6 Nights
5 listings
4.7% of total
7-29 Nights
38 listings
35.5% of total
30+ Nights
11 listings
10.3% of total
Key Insights
- The most prevalent minimum stay requirement in Bang Sare is 1 Night, adopted by 43% of listings. This highlights the market's preference for shorter, flexible bookings.
- A significant segment (10.3%) caters to monthly stays (30+ nights) in Bang Sare, pointing to opportunities in the extended-stay market.
Recommendations
- Align with the market by considering a 1 Night minimum stay, as 43% of Bang Sare hosts use this setting.
- Explore offering discounts for stays of 30+ nights to attract the 10.3% of the market seeking extended stays.
- Adjust minimum nights based on seasonality – potentially shorter during low season and longer during peak demand periods in Bang Sare.
Bang Sare Airbnb Cancellation Policy Trends Analysis (2026)
Super Strict 60 Days
1 listings
0.9% of total
Flexible
27 listings
25.2% of total
Moderate
21 listings
19.6% of total
Firm
46 listings
43% of total
Strict
12 listings
11.2% of total
Cancellation Policy Insights for Bang Sare
- The prevailing Airbnb cancellation policy trend in Bang Sare is Firm, used by 43% of listings.
- A majority (54.2%) of hosts in Bang Sare utilize Firm or Strict policies, indicating a market where hosts prioritize booking security.
Recommendations for Hosts
- Consider adopting a Firm policy to align with the 43% market standard in Bang Sare.
- Using a Strict policy might deter some guests, as only 11.2% of listings use it. Evaluate if potential revenue protection outweighs possible lower booking rates.
- Regularly review your cancellation policy against competitors and market demand shifts in Bang Sare.
Bang Sare STR Booking Lead Time Analysis (2026)
Average Booking Lead Time by Month
Booking Lead Time Insights for Bang Sare
- The overall average booking lead time for vacation rentals in Bang Sare is 36 days.
- Guests book furthest in advance for stays during January (average 69 days), likely coinciding with peak travel demand or local events.
- The shortest booking windows occur for stays in September (average 14 days), indicating more last-minute travel plans during this time.
- Seasonally, Winter (51 days avg.) sees the longest lead times, while Summer (23 days avg.) has the shortest, reflecting typical travel planning cycles.
Recommendations for Hosts
- Use the overall average lead time (36 days) as a baseline for your pricing and availability strategy in Bang Sare.
- For January stays, consider implementing length-of-stay discounts or slightly higher rates for bookings made less than 69 days out to capitalize on advance planning.
- During September, focus on last-minute booking availability and promotions, as guests book with very short notice (14 days avg.).
- Target marketing efforts for the Winter season well in advance (at least 51 days) to capture early planners.
- Monitor your own booking lead times against these Bang Sare averages to identify opportunities for dynamic pricing adjustments.
Popular & Essential Airbnb Amenities in Bang Sare (2026)
Amenity Prevalence
Amenity Insights for Bang Sare
- Essential amenities in Bang Sare that guests expect include: TV, Air conditioning, Kitchen. Lacking these (any) could significantly impact bookings.
- Popular amenities like Free parking on premises, Wifi, Pool are common but not universal. Offering these can provide a competitive edge.
- A pool is a highly desired but not standard amenity, making it a key feature for attracting guests seeking leisure in Bang Sare.
- Warning: Wifi is not universally provided but is considered essential globally. Ensure reliable Wifi is offered.
Recommendations for Hosts
- Ensure your listing includes all essential amenities for Bang Sare: TV, Air conditioning, Kitchen.
- Prioritize adding missing essentials: Air conditioning, Kitchen.
- Consider adding popular differentiators like Free parking on premises or Wifi to increase appeal.
- Highlight unique or less common amenities you offer (e.g., hot tub, dedicated workspace, EV charger) in your listing description and photos.
- Regularly check competitor amenities in Bang Sare to stay competitive.
Bang Sare Airbnb Guest Demographics & Profile Analysis (2026)
Guest Profile Summary for Bang Sare
- The typical guest profile for Airbnb in Bang Sare consists of predominantly international visitors (71%), with top international origins including United Kingdom, typically belonging to the Post-2000s (Gen Z/Alpha) group (50%), primarily speaking English or Thai.
- Domestic travelers account for 29.2% of guests.
- Key international markets include Thailand (29.2%) and United Kingdom (14.6%).
- Top languages spoken are English (45%) followed by Thai (13.2%).
- A significant demographic segment is the Post-2000s (Gen Z/Alpha) group, representing 50% of guests.
Recommendations for Hosts
- Focus marketing internationally, particularly towards travelers from United Kingdom.
- Tailor amenities and listing descriptions to appeal to the dominant Post-2000s (Gen Z/Alpha) demographic (e.g., highlight fast WiFi, smart home features, local guides).
- Highlight unique local experiences or amenities relevant to the primary guest profile.
- Consider seasonal promotions aligned with peak travel times for key origin markets.
Nearby Short-Term Rental Market Comparison
How does the Bang Sare Airbnb market stack up against its neighbors? Compare key performance metrics like average monthly revenue, ADR, and occupancy rates in surrounding areas to understand the broader regional STR landscape.
| Market | Active Properties | Monthly Revenue | Daily Rate | Avg. Occupancy |
|---|---|---|---|---|
| Huai Yai | 36 | $1,984 | $287.17 | 32% |
| Nong Pla Lai | 13 | $1,685 | $240.23 | 31% |
| Ban Malai Thap Tai | 10 | $1,519 | $255.38 | 28% |
| Khet Bang Rak | 35 | $1,299 | $104.31 | 50% |
| Ban Nong Hiang | 56 | $1,169 | $216.74 | 37% |
| Ban Nong Bua | 34 | $1,162 | $179.93 | 28% |
| Bang Lamung | 16 | $1,089 | $242.13 | 25% |
| Pathum Wan | 27 | $1,083 | $106.21 | 48% |
| Khao Chi Chan | 71 | $1,028 | $216.66 | 27% |
| Suan Luang | 14 | $951 | $79.56 | 53% |