Chumphon Airbnb Market Analysis 2026: Short Term Rental Data & Vacation Rental Statistics in Chumphon Province, Thailand
Is Airbnb profitable in Chumphon in 2026? Explore comprehensive Airbnb analytics for Chumphon, Chumphon Province, Thailand to uncover income potential. This 2026 STR market report for Chumphon, based on AirROI data from June 2024 to May 2025, reveals key trends in the niche market of 19 active listings.
Whether you're considering an Airbnb investment in Chumphon, optimizing your existing vacation rental, or exploring rental arbitrage opportunities, understanding the Chumphon Airbnb data is crucial. Leveraging the low regulation environment is key to maximizing your short term rental income potential. Let's dive into the specifics.
Key Chumphon Airbnb Performance Metrics Overview
Monthly Airbnb Revenue Variations & Income Potential in Chumphon (2026)
Understanding the monthly revenue variations for Airbnb listings in Chumphon is key to maximizing your short term rental income potential. Seasonality significantly impacts earnings. Our analysis, based on data from the past 12 months, shows that the peak revenue month for STRs in Chumphon is typically March, while July often presents the lowest earnings, highlighting opportunities for strategic pricing adjustments during shoulder and low seasons. Explore the typical Airbnb income in Chumphon across different performance tiers:
- Best-in-class properties (Top 10%) achieve $479+ monthly, often utilizing dynamic pricing and superior guest experiences.
- Strong performing properties (Top 25%) earn $320 or more, indicating effective management and desirable locations/amenities.
- Typical properties (Median) generate around $158 per month, representing the average market performance.
- Entry-level properties (Bottom 25%) see earnings around $70, often with potential for optimization.
Average Monthly Airbnb Earnings Trend in Chumphon
Chumphon Airbnb Occupancy Rate Trends (2026)
Maximize your bookings by understanding the Chumphon STR occupancy trends. Seasonal demand shifts significantly influence how often properties are booked. Typically, Marchsees the highest demand (peak season occupancy), while July experiences the lowest (low season). Effective strategies, like adjusting minimum stays or offering promotions, can boost occupancy during slower periods. Here's how different property tiers perform in Chumphon:
- Best-in-class properties (Top 10%) achieve 54%+ occupancy, indicating high desirability and potentially optimized availability.
- Strong performing properties (Top 25%) maintain 35% or higher occupancy, suggesting good market fit and guest satisfaction.
- Typical properties (Median) have an occupancy rate around 19%.
- Entry-level properties (Bottom 25%) average 11% occupancy, potentially facing higher vacancy.
Average Monthly Occupancy Rate Trend in Chumphon
Average Daily Rate (ADR) Airbnb Trends in Chumphon (2026)
Effective short term rental pricing strategy in Chumphon involves understanding monthly ADR fluctuations. The Average Daily Rate (ADR) for Airbnb in Chumphon typically peaks in May and dips lowest during January. Leveraging Airbnb dynamic pricing tools or strategies based on this seasonality can significantly boost revenue. Here's a look at the typical nightly rates achieved:
- Best-in-class properties (Top 10%) command rates of $43+ per night, often due to premium features or locations.
- Strong performing properties (Top 25%) achieve nightly rates of $32 or more.
- Typical properties (Median) charge around $23 per night.
- Entry-level properties (Bottom 25%) earn around $16 per night.
Average Daily Rate (ADR) Trend by Month in Chumphon
Get Live Chumphon Market Intelligence 👇

Explore Real-time Analytics
Airbnb Seasonality Analysis & Trends in Chumphon (2025)
Peak Season (March, January, February)
- Revenue averages $370 per month
- Occupancy rates average 42.4%
- Daily rates average $27
Shoulder Season
- Revenue averages $191 per month
- Occupancy maintains around 23.1%
- Daily rates hold near $28
Low Season (June, July, October)
- Revenue drops to average $82 per month
- Occupancy decreases to average 10.9%
- Daily rates adjust to average $27
Seasonality Insights for Chumphon
- The Airbnb seasonality in Chumphon shows highly seasonal trends requiring careful strategy. While the sections above show seasonal averages, it's also insightful to look at the extremes:
- During the high season, the absolute peak month showcases Chumphon's highest earning potential, with monthly revenues capable of climbing to $445, occupancy reaching a high of 45.4%, and ADRs peaking at $30.
- Conversely, the slowest single month of the year, typically falling within the low season, marks the market's lowest point. In this month, revenue might dip to $69, occupancy could drop to 8.9%, and ADRs may adjust down to $26.
- Understanding both the seasonal averages and these monthly peaks and troughs in revenue, occupancy, and ADR is crucial for maximizing your Airbnb profit potential in Chumphon.
Seasonal Strategies for Maximizing Profit
- Peak Season: Maximize revenue through premium pricing and potentially longer minimum stays. Ensure high availability.
- Low Season: Offer competitive pricing, special promotions (e.g., extended stay discounts), and flexible cancellation policies. Target off-season travelers like remote workers or budget-conscious guests.
- Shoulder Seasons: Implement dynamic pricing that balances peak and low rates. Target weekend travelers or specific events. Offer slightly more flexible terms than peak season.
- Regularly analyze your own performance against these Chumphon seasonality benchmarks and adjust your pricing and availability strategy accordingly.
Best Areas for Airbnb Investment in Chumphon (2026)
Exploring the top neighborhoods for short-term rentals in Chumphon? This section highlights key areas, outlining why they are attractive for hosts and guests, along with notable local attractions. Consider these locations based on your target guest profile and investment strategy.
| Neighborhood / Area | Why Host Here? (Target Guests & Appeal) | Key Attractions & Landmarks |
|---|---|---|
| Chumphon Town | The capital city of Chumphon Province, offering convenient access to amenities, local culture, and transportation hubs. Ideal for travelers seeking a local Thai experience with easy access to nearby attractions. | Chumphon National Museum, Chumphon Night Market, Wat Chao Fa Sala Loi, Buddha statue at Wat Suthi Wararam, Shopping at local markets |
| Bang Son Beach | A beautiful and quiet beach area perfect for those looking to relax by the sea. It is less crowded than other tourist spots, making it ideal for families and couples. | Bang Son Beach, Nang Yuan Island, Koh Tao day trips, Local seafood restaurants, Scuba diving spots |
| Sairee Beach | Located on Koh Tao, Sairee Beach is famous for its stunning sunsets and vibrant nightlife. A hotspot for young travelers and divers, making it a prime Airbnb location. | Sairee Beach, Diving schools, Beach bars and parties, Lighthouse, Koh Nang Yuan |
| Thung Wua Laen Beach | Known for its stunning white sandy beaches and clear waters, perfect for relaxation and water sports. Ideal for attracting beach lovers and adventure seekers. | Thung Wua Laen Beach, Snorkeling spots, Kayaking, Beachfront restaurants, Local shops |
| Koh Phayam | A tranquil island known for its relaxed vibe and beautiful beaches, suitable for those seeking an escape into nature. Great for eco-tourism. | Ao Khao Kwai Beach, Koh Phayam's mangroves, Locally owned guesthouses, Beach bungalows, Relaxed atmosphere |
| Lang Suan District | An area known for its agriculture and authentic Thai lifestyle. It offers a glimpse into rural living, attracting tourists looking for unique experiences. | Wat Phra That Chao Fa, Local markets, Rice fields, Traditional Thai cooking classes, Cultural tours |
| Mu Ko Chumphon National Park | An incredible national park featuring pristine nature, hiking trails, and diverse wildlife. A great option for nature lovers and adventure tourism. | Hiking trails, Diving spots, Wildlife watching, Scenic viewpoints, Boat trips |
| Pak Nam Chumphon | A fishing village with beautiful scenic views of the gulf. It is perfect for travelers interested in local culture and seafood delicacies. | Pak Nam Chumphon Beach, Local fishing culture, Seafood markets, Wat Tasao, Views of the Gulf of Thailand |
Understanding Airbnb License Requirements & STR Laws in Chumphon (2026)
While Chumphon, Chumphon Province, Thailand currently shows low STR regulations, specific Airbnb license requirements might still exist or change. Always verify the latest short term rental regulations and Airbnb license requirements directly with local government authorities for Chumphon to ensure full compliance before hosting.
(Source: AirROI data, 2026, finding no licensed listings among those analyzed)
Top Performing Airbnb Properties in Chumphon (2026)
Benchmark your potential! Explore examples of top-performing Airbnb properties in Chumphonbased on Trailing Twelve Month (TTM) revenue. Analyze their characteristics, revenue, occupancy rate, and ADR to understand what drives success in this market.
Bungalow waterfront in the peaceful location
Private Room • 1 bedroom

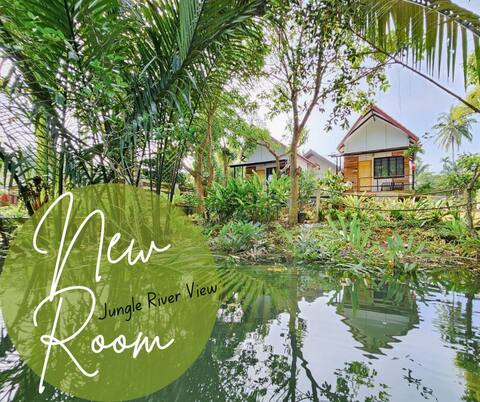
Bungalow in jungle river free kayak and bicycle
Private Room • 1 bedroom
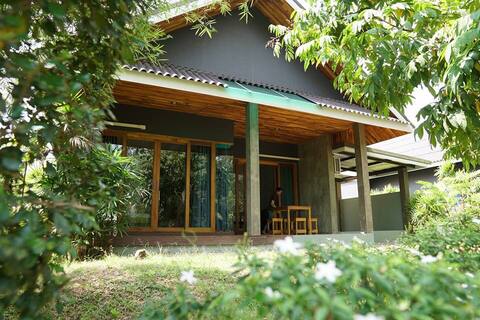
A big villa next to the river for 2-4 ppl
Private Room • 1 bedroom
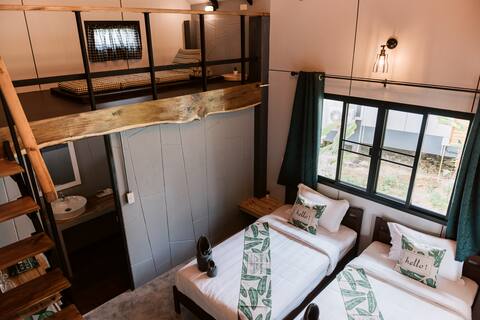
Twin bed bungalow in the garden free bike+kayak
Private Room • 1 bedroom

Amazing villa in a peaceful location 4km from town
Private Room • 1 bedroom

Family 2 bedrooms
Private Room • 2 bedrooms
Note: Performance varies based on location, size, amenities, seasonality, and management quality. Data reflects the past 12 months.
Top Performing Airbnb Hosts in Chumphon (2026)
Learn from the best! This table showcases top-performing Airbnb hosts in Chumphon based on the number of properties managed and estimated total revenue over the past year. Analyze their scale and performance metrics.
| Host Name | Properties | Grossing Revenue | Stay Reviews | Avg Rating |
|---|---|---|---|---|
| Tang&Khom | 8 | $25,657 | 410 | 4.96/5.0 |
| Jean | 4 | $4,355 | 28 | 4.95/5.0 |
| Sirinuch | 5 | $2,876 | 55 | 4.53/5.0 |
| Tukta | 1 | $1,192 | 24 | 4.71/5.0 |
| Suwatchai | 1 | $615 | 36 | 4.97/5.0 |
Analyzing the strategies of top hosts, such as their property selection, pricing, and guest communication, can offer valuable lessons for optimizing your own Airbnb operations in Chumphon.
Dive Deeper: Advanced Chumphon STR Market Data (2026)
Ready to unlock more insights? AirROI provides access to advanced metrics and comprehensive Airbnb data for Chumphon. Explore detailed analytics beyond this report to refine your investment strategy, optimize pricing, and maximize your vacation rental profits.
Explore Advanced MetricsChumphon Short-Term Rental Market Composition (2026): Property & Room Types
Room Type Distribution
Property Type Distribution
Market Composition Insights for Chumphon
- The Chumphon Airbnb market composition is heavily skewed towards Private Room listings, which make up 68.4% of the 19 active rentals. This indicates strong guest preference for privacy and space.
- Looking at the property type distribution in Chumphon, Outdoor/Unique properties are the most common (36.8%), reflecting the local real estate landscape.
- Houses represent a significant 21.1% portion, catering likely to families or larger groups.
- The presence of 26.3% Hotel/Boutique listings indicates integration with traditional hospitality.
Chumphon Airbnb Room Capacity Analysis (2026): Bedroom Distribution
Distribution of Listings by Number of Bedrooms
Room Capacity Insights for Chumphon
- The dominant room capacity in Chumphon is 1 bedroom listings, making up 68.4% of the market. This suggests a strong demand for properties suitable for couples or solo travelers.
- Together, 1 bedroom and 2 bedrooms properties represent 73.7% of the active Airbnb listings in Chumphon, indicating a high concentration in these sizes.
- With over half the market (68.4%) consisting of studios or 1-bedroom units, Chumphon is particularly well-suited for individuals or couples.
Chumphon Vacation Rental Guest Capacity Trends (2026)
Distribution of Listings by Guest Capacity
Guest Capacity Insights for Chumphon
- The most common guest capacity trend in Chumphon vacation rentals is listings accommodating 2 guests (42.1%). This suggests the primary traveler segment is likely couples or solo travelers.
- Properties designed for 2 guests and 3 guests dominate the Chumphon STR market, accounting for 63.2% of listings.
- A significant 42.1% of listings cater specifically to 1-2 guests, highlighting strong demand from couples and solo travelers in Chumphon.
- On average, properties in Chumphon are equipped to host 1.7 guests.
Chumphon Airbnb Booking Patterns (2026): Available vs. Booked Days
Available Days Distribution
Booked Days Distribution
Booking Pattern Insights for Chumphon
- The most common availability pattern in Chumphon falls within the 271-366 days range, representing 73.7% of listings. This suggests many properties have significant open periods on their calendars.
- Approximately 100.0% of listings show high availability (181+ days open annually), indicating potential for increased bookings or specific owner usage patterns.
- For booked days, the 31-90 days range is most frequent in Chumphon (42.1%), reflecting common guest stay durations or potential owner blocking patterns.
Chumphon Airbnb Minimum Stay Requirements Analysis
Distribution of Listings by Minimum Night Requirement
1 Night
19 listings
100% of total
Key Insights
- The most prevalent minimum stay requirement in Chumphon is 1 Night, adopted by 100% of listings. This highlights the market's preference for shorter, flexible bookings.
- A strong majority (100.0%) of the Chumphon Airbnb data shows acceptance of very short stays (1-2 nights), indicating a dynamic, high-turnover market.
Recommendations
- Align with the market by considering a 1 Night minimum stay, as 100% of Chumphon hosts use this setting.
- Adjust minimum nights based on seasonality – potentially shorter during low season and longer during peak demand periods in Chumphon.
Chumphon Airbnb Cancellation Policy Trends Analysis (2026)
Flexible
15 listings
78.9% of total
Firm
4 listings
21.1% of total
Cancellation Policy Insights for Chumphon
- The prevailing Airbnb cancellation policy trend in Chumphon is Flexible, used by 78.9% of listings.
- The market strongly favors guest-friendly terms, with 78.9% of listings offering Flexible or Moderate policies. This suggests guests in Chumphon may expect booking flexibility.
Recommendations for Hosts
- Consider adopting a Flexible policy to align with the 78.9% market standard in Chumphon.
- Given the high prevalence of Flexible policies (78.9%), offering this can enhance booking appeal, especially during shoulder seasons.
- Regularly review your cancellation policy against competitors and market demand shifts in Chumphon.
Chumphon STR Booking Lead Time Analysis (2026)
Average Booking Lead Time by Month
Booking Lead Time Insights for Chumphon
- The overall average booking lead time for vacation rentals in Chumphon is 27 days.
- Guests book furthest in advance for stays during January (average 42 days), likely coinciding with peak travel demand or local events.
- The shortest booking windows occur for stays in October (average 8 days), indicating more last-minute travel plans during this time.
- Seasonally, Winter (33 days avg.) sees the longest lead times, while Fall (12 days avg.) has the shortest, reflecting typical travel planning cycles.
Recommendations for Hosts
- Use the overall average lead time (27 days) as a baseline for your pricing and availability strategy in Chumphon.
- For January stays, consider implementing length-of-stay discounts or slightly higher rates for bookings made less than 42 days out to capitalize on advance planning.
- During October, focus on last-minute booking availability and promotions, as guests book with very short notice (8 days avg.).
- Target marketing efforts for the Winter season well in advance (at least 33 days) to capture early planners.
- Monitor your own booking lead times against these Chumphon averages to identify opportunities for dynamic pricing adjustments.
Popular & Essential Airbnb Amenities in Chumphon (2026)
Amenity Prevalence
Amenity Insights for Chumphon
- Essential amenities in Chumphon that guests expect include: Wifi, Air conditioning. Lacking these (any) could significantly impact bookings.
- Popular amenities like Shampoo, TV, Hangers are common but not universal. Offering these can provide a competitive edge.
Recommendations for Hosts
- Ensure your listing includes all essential amenities for Chumphon: Wifi, Air conditioning.
- Consider adding popular differentiators like Shampoo or TV to increase appeal.
- Highlight unique or less common amenities you offer (e.g., hot tub, dedicated workspace, EV charger) in your listing description and photos.
- Regularly check competitor amenities in Chumphon to stay competitive.
Chumphon Airbnb Guest Demographics & Profile Analysis (2026)
Guest Profile Summary for Chumphon
- The typical guest profile for Airbnb in Chumphon consists of predominantly international visitors (94%), with top international origins including United States, typically belonging to the Post-2000s (Gen Z/Alpha) group (50%), primarily speaking English or German.
- Domestic travelers account for 6.5% of guests.
- Key international markets include Germany (24.7%) and United States (10.4%).
- Top languages spoken are English (45.8%) followed by German (16.8%).
- A significant demographic segment is the Post-2000s (Gen Z/Alpha) group, representing 50% of guests.
Recommendations for Hosts
- Focus marketing internationally, particularly towards travelers from United States.
- Tailor amenities and listing descriptions to appeal to the dominant Post-2000s (Gen Z/Alpha) demographic (e.g., highlight fast WiFi, smart home features, local guides).
- Highlight unique local experiences or amenities relevant to the primary guest profile.
- Consider seasonal promotions aligned with peak travel times for key origin markets.
Nearby Short-Term Rental Market Comparison
How does the Chumphon Airbnb market stack up against its neighbors? Compare key performance metrics like average monthly revenue, ADR, and occupancy rates in surrounding areas to understand the broader regional STR landscape.
| Market | Active Properties | Monthly Revenue | Daily Rate | Avg. Occupancy |
|---|---|---|---|---|
| Ban Bang Khao | 50 | $3,113 | $457.44 | 43% |
| Baan Thong Po | 145 | $3,083 | $368.61 | 44% |
| Baan Chaweng Noi | 324 | $3,003 | $322.90 | 46% |
| Ko Samui | 917 | $2,872 | $364.39 | 43% |
| Baan Thong Krut | 22 | $2,469 | $362.33 | 45% |
| Baan Plai Laem | 261 | $2,435 | $333.10 | 44% |
| Baan Taling Ngam | 33 | $2,296 | $363.06 | 36% |
| Baan Hua Thanon | 110 | $2,170 | $309.84 | 45% |
| Choeng Mon | 242 | $2,141 | $393.10 | 36% |
| Baan Nai Wok | 37 | $2,106 | $199.29 | 55% |