Khet Phra Khanong Airbnb Market Analysis 2026: Short Term Rental Data & Vacation Rental Statistics in Krung Thep Maha Nakhon, Thailand
Is Airbnb profitable in Khet Phra Khanong in 2026? Explore comprehensive Airbnb analytics for Khet Phra Khanong, Krung Thep Maha Nakhon, Thailand to uncover income potential. This 2026 STR market report for Khet Phra Khanong, based on AirROI data from February 2025 to January 2026, reveals key trends in the niche market of 64 active listings.
Whether you're considering an Airbnb investment in Khet Phra Khanong, optimizing your existing vacation rental, or exploring rental arbitrage opportunities, understanding the Khet Phra Khanong Airbnb data is crucial. Leveraging the low regulation environment is key to maximizing your short term rental income potential. Let's dive into the specifics.
Key Khet Phra Khanong Airbnb Performance Metrics Overview
Monthly Airbnb Revenue Variations & Income Potential in Khet Phra Khanong (2026)
Understanding the monthly revenue variations for Airbnb listings in Khet Phra Khanong is key to maximizing your short term rental income potential. Seasonality significantly impacts earnings. Our analysis, based on data from the past 12 months, shows that the peak revenue month for STRs in Khet Phra Khanong is typically June, while May often presents the lowest earnings, highlighting opportunities for strategic pricing adjustments during shoulder and low seasons. Explore the typical Airbnb income in Khet Phra Khanong across different performance tiers:
- Best-in-class properties (Top 10%) achieve $1,552+ monthly, often utilizing dynamic pricing and superior guest experiences.
- Strong performing properties (Top 25%) earn $894 or more, indicating effective management and desirable locations/amenities.
- Typical properties (Median) generate around $389 per month, representing the average market performance.
- Entry-level properties (Bottom 25%) see earnings around $180, often with potential for optimization.
Average Monthly Airbnb Earnings Trend in Khet Phra Khanong
Khet Phra Khanong Airbnb Occupancy Rate Trends (2026)
Maximize your bookings by understanding the Khet Phra Khanong STR occupancy trends. Seasonal demand shifts significantly influence how often properties are booked. Typically, Junesees the highest demand (peak season occupancy), while May experiences the lowest (low season). Effective strategies, like adjusting minimum stays or offering promotions, can boost occupancy during slower periods. Here's how different property tiers perform in Khet Phra Khanong:
- Best-in-class properties (Top 10%) achieve 78%+ occupancy, indicating high desirability and potentially optimized availability.
- Strong performing properties (Top 25%) maintain 66% or higher occupancy, suggesting good market fit and guest satisfaction.
- Typical properties (Median) have an occupancy rate around 37%.
- Entry-level properties (Bottom 25%) average 17% occupancy, potentially facing higher vacancy.
Average Monthly Occupancy Rate Trend in Khet Phra Khanong
Average Daily Rate (ADR) Airbnb Trends in Khet Phra Khanong (2026)
Effective short term rental pricing strategy in Khet Phra Khanong involves understanding monthly ADR fluctuations. The Average Daily Rate (ADR) for Airbnb in Khet Phra Khanong typically peaks in December and dips lowest during August. Leveraging Airbnb dynamic pricing tools or strategies based on this seasonality can significantly boost revenue. Here's a look at the typical nightly rates achieved:
- Best-in-class properties (Top 10%) command rates of $76+ per night, often due to premium features or locations.
- Strong performing properties (Top 25%) achieve nightly rates of $56 or more.
- Typical properties (Median) charge around $39 per night.
- Entry-level properties (Bottom 25%) earn around $25 per night.
Average Daily Rate (ADR) Trend by Month in Khet Phra Khanong
Get Live Khet Phra Khanong Market Intelligence 👇
Explore Real-time Analytics
Airbnb Seasonality Analysis & Trends in Khet Phra Khanong (2026)
Peak Season (June, November, December)
- Revenue averages $825 per month
- Occupancy rates average 47.5%
- Daily rates average $50
Shoulder Season
- Revenue averages $591 per month
- Occupancy maintains around 38.6%
- Daily rates hold near $46
Low Season (February, March, April)
- Revenue drops to average $0 per month
- Occupancy decreases to average 0.0%
- Daily rates adjust to average $43
Seasonality Insights for Khet Phra Khanong
- The Airbnb seasonality in Khet Phra Khanong shows highly seasonal trends requiring careful strategy. While the sections above show seasonal averages, it's also insightful to look at the extremes:
- During the high season, the absolute peak month showcases Khet Phra Khanong's highest earning potential, with monthly revenues capable of climbing to $861, occupancy reaching a high of 49.5%, and ADRs peaking at $54.
- Conversely, the slowest single month of the year, typically falling within the low season, marks the market's lowest point. In this month, revenue might dip to $0, occupancy could drop to 0.0%, and ADRs may adjust down to $40.
- Understanding both the seasonal averages and these monthly peaks and troughs in revenue, occupancy, and ADR is crucial for maximizing your Airbnb profit potential in Khet Phra Khanong.
Seasonal Strategies for Maximizing Profit
- Peak Season: Maximize revenue through premium pricing and potentially longer minimum stays. Ensure high availability.
- Low Season: Offer competitive pricing, special promotions (e.g., extended stay discounts), and flexible cancellation policies. Target off-season travelers like remote workers or budget-conscious guests.
- Shoulder Seasons: Implement dynamic pricing that balances peak and low rates. Target weekend travelers or specific events. Offer slightly more flexible terms than peak season.
- Regularly analyze your own performance against these Khet Phra Khanong seasonality benchmarks and adjust your pricing and availability strategy accordingly.
Best Areas for Airbnb Investment in Khet Phra Khanong (2026)
Exploring the top neighborhoods for short-term rentals in Khet Phra Khanong? This section highlights key areas, outlining why they are attractive for hosts and guests, along with notable local attractions. Consider these locations based on your target guest profile and investment strategy.
| Neighborhood / Area | Why Host Here? (Target Guests & Appeal) | Key Attractions & Landmarks |
|---|---|---|
| Thong Lo | A trendy neighborhood known for its upscale dining, nightlife, and shopping. Popular among young professionals and expatriates seeking a vibrant urban experience. | J Avenue Thonglor, Thonglor Art Village, Nihonmura Mall, Cooler Gallery, The Commons |
| Ekamai | A hip area with a mix of local and international restaurants, cafes, and bars. It attracts both locals and tourists looking for a laid-back atmosphere with modern amenities. | Ekkamai Mall, Gateway Ekamai, Buddha Ekkamai, Benjasiri Park, The Beer Cap |
| Phrakhanong | An up-and-coming district with a mix of traditional and modern charm. It is becoming increasingly popular with tourists for its authentic Thai experiences and local markets. | W Market, Bang Chak Market, Phra Khanong Canal, Cultural Plaza, Ram 29 Park |
| On Nut | Known for its affordability, family-friendly environment, and increasing expatriate community. A great choice for budget travelers looking for a more local experience. | On Nut Market, Tesco Lotus On Nut, Buddhi Benja, Bangkok International Trade & Exhibition Centre, Sukhumvit Park |
| Sukhumvit | A major road in Bangkok that is home to many shopping malls, restaurants, and nightlife spots. It offers easy access to public transportation and is a favorite among tourists and expats. | Terminal 21, Emporium, Emquartier, Queen Sirikit National Convention Center, Benchasiri Park |
| Lat Phrao | A less touristy area with more local culture. It has an array of eateries and is popular for those looking to experience the local lifestyle and community feel. | Central Plaza Lat Phrao, Union Mall, The Mall Bangkapi, Lat Phrao Market, Suan Lum Night Bazaar |
| Bang Na | Home to the BITEC exhibition center, it is a bustling area offering a range of shopping and entertainment options. Ideal for visitors attending events and exhibitions. | Bang Na Square, CentralPlaza Bangna, Mega Bangna, BITEC, Bang Na Night Market |
| Rama 9 | A rapidly developing area known for its business centers and residential apartments. It's becoming popular among young professionals and families for its growth and convenience. | Robinson Rama 9, The Street Ratchada, Rajamangala National Stadium, Rama 9 Park, Siam Niramit |
Understanding Airbnb License Requirements & STR Laws in Khet Phra Khanong (2026)
While Khet Phra Khanong, Krung Thep Maha Nakhon, Thailand currently shows low STR regulations, specific Airbnb license requirements might still exist or change. Always verify the latest short term rental regulations and Airbnb license requirements directly with local government authorities for Khet Phra Khanong to ensure full compliance before hosting.
(Source: AirROI data, 2026, finding no licensed listings among those analyzed)
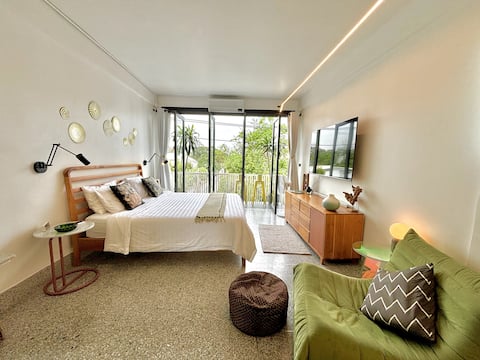
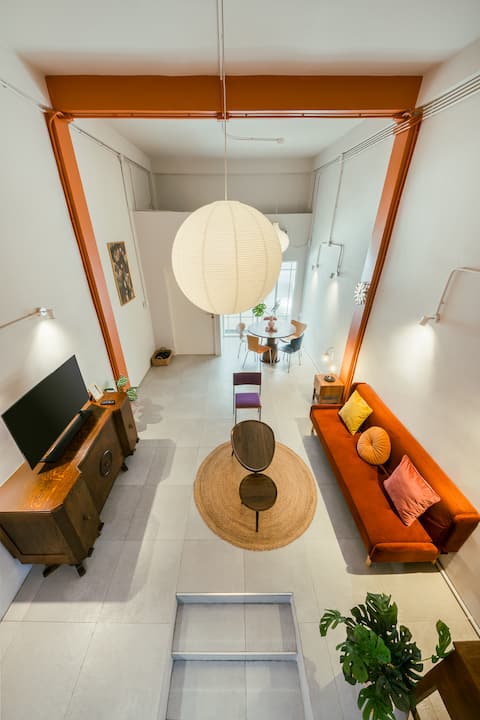
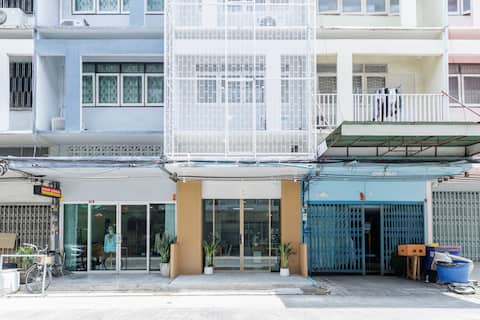
Top Performing Airbnb Properties in Khet Phra Khanong (2026)
Benchmark your potential! Explore examples of top-performing Airbnb properties in Khet Phra Khanongbased on Trailing Twelve Month (TTM) revenue. Analyze their characteristics, revenue, occupancy rate, and ADR to understand what drives success in this market.
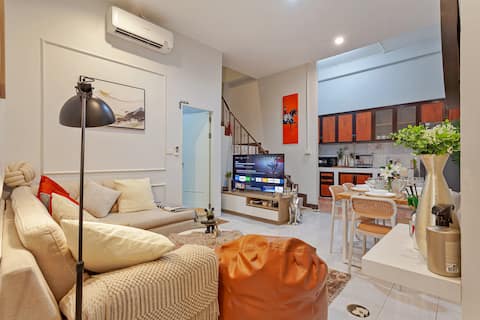
10 min BTS Full Kitchen HomeCinema 1Gbs WIFI NFLIX
Entire Place • 2 bedrooms
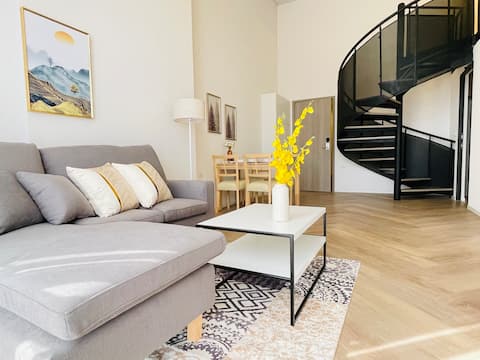
3BR Mid-Century Home | 2 Min to BTS + Free Pick-Up
Entire Place • 3 bedrooms
Cozy House - 2 mins walk to skytrain
Entire Place • 4 bedrooms
Coco's Townhouse Onnut BTS 3bedrooms 5beds 3baths
Entire Place • 3 bedrooms
S27-sukhumvit High-end Loft Apartment BTS ONNUT Family Room 3 Beds 6 people
Entire Place • 2 bedrooms

Quite Low-rise | 2BR Condo | Pool & Gym | Ekkamai
Entire Place • 2 bedrooms
Note: Performance varies based on location, size, amenities, seasonality, and management quality. Data reflects the past 12 months.
Top Performing Airbnb Hosts in Khet Phra Khanong (2026)
Learn from the best! This table showcases top-performing Airbnb hosts in Khet Phra Khanong based on the number of properties managed and estimated total revenue over the past year. Analyze their scale and performance metrics.
| Host Name | Properties | Grossing Revenue | Stay Reviews | Avg Rating |
|---|---|---|---|---|
| Selina | 7 | $46,944 | 48 | 4.91/5.0 |
| Mihael | 1 | $32,739 | 33 | 4.94/5.0 |
| Girijesh Nandani | 8 | $17,800 | 506 | 4.42/5.0 |
| Holiday Patterns | 1 | $17,214 | 20 | 4.80/5.0 |
| Mickey | 1 | $14,803 | 6 | 4.83/5.0 |
| Spm | 1 | $14,683 | 8 | 4.88/5.0 |
| Sea Hosts | 1 | $11,869 | 23 | 4.70/5.0 |
| Airbnb | 8 | $11,595 | 79 | 4.74/5.0 |
| W | 3 | $10,641 | 17 | 4.92/5.0 |
| Carl | 1 | $10,115 | 3 | 5.00/5.0 |
Analyzing the strategies of top hosts, such as their property selection, pricing, and guest communication, can offer valuable lessons for optimizing your own Airbnb operations in Khet Phra Khanong.
Dive Deeper: Advanced Khet Phra Khanong STR Market Data (2026)
Ready to unlock more insights? AirROI provides access to advanced metrics and comprehensive Airbnb data for Khet Phra Khanong. Explore detailed analytics beyond this report to refine your investment strategy, optimize pricing, and maximize your vacation rental profits.
Explore Advanced MetricsKhet Phra Khanong Short-Term Rental Market Composition (2026): Property & Room Types
Room Type Distribution
Property Type Distribution
Market Composition Insights for Khet Phra Khanong
- The Khet Phra Khanong Airbnb market composition is heavily skewed towards Entire Home/Apt listings, which make up 62.5% of the 64 active rentals. This indicates strong guest preference for privacy and space.
- However, a notable 37.5% share for Private Rooms suggests opportunities for budget-conscious travelers or hosts renting out spare rooms.
- Looking at the property type distribution in Khet Phra Khanong, Apartment/Condo properties are the most common (65.6%), reflecting the local real estate landscape.
- Houses represent a significant 21.9% portion, catering likely to families or larger groups.
- The presence of 12.5% Hotel/Boutique listings indicates integration with traditional hospitality.
Khet Phra Khanong Airbnb Room Capacity Analysis (2026): Bedroom Distribution
Distribution of Listings by Number of Bedrooms
Room Capacity Insights for Khet Phra Khanong
- The dominant room capacity in Khet Phra Khanong is 1 bedroom listings, making up 56.3% of the market. This suggests a strong demand for properties suitable for couples or solo travelers.
- Together, 1 bedroom and 2 bedrooms properties represent 71.9% of the active Airbnb listings in Khet Phra Khanong, indicating a high concentration in these sizes.
- With over half the market (56.3%) consisting of studios or 1-bedroom units, Khet Phra Khanong is particularly well-suited for individuals or couples.
- Listings with 3+ bedrooms (6.3%) represent a smaller niche, potentially indicating an underserved market for larger group accommodations in Khet Phra Khanong.
Khet Phra Khanong Vacation Rental Guest Capacity Trends (2026)
Distribution of Listings by Guest Capacity
Guest Capacity Insights for Khet Phra Khanong
- The most common guest capacity trend in Khet Phra Khanong vacation rentals is listings accommodating 2 guests (48.4%). This suggests the primary traveler segment is likely couples or solo travelers.
- Properties designed for 2 guests and 3 guests dominate the Khet Phra Khanong STR market, accounting for 59.3% of listings.
- A significant 48.4% of listings cater specifically to 1-2 guests, highlighting strong demand from couples and solo travelers in Khet Phra Khanong.
- 11.0% of properties accommodate 6+ guests, serving the market segment for larger families or group travel in Khet Phra Khanong.
- On average, properties in Khet Phra Khanong are equipped to host 2.4 guests.
Khet Phra Khanong Airbnb Booking Patterns (2026): Available vs. Booked Days
Available Days Distribution
Booked Days Distribution
Booking Pattern Insights for Khet Phra Khanong
- The most common availability pattern in Khet Phra Khanong falls within the 271-366 days range, representing 59.4% of listings. This suggests many properties have significant open periods on their calendars.
- Approximately 92.2% of listings show high availability (181+ days open annually), indicating potential for increased bookings or specific owner usage patterns.
- For booked days, the 91-180 days range is most frequent in Khet Phra Khanong (35.9%), reflecting common guest stay durations or potential owner blocking patterns.
- A notable 9.4% of properties secure long booking periods (181+ days booked per year), highlighting successful long-term rental strategies or significant owner usage.
Khet Phra Khanong Airbnb Minimum Stay Requirements Analysis
Distribution of Listings by Minimum Night Requirement
1 Night
32 listings
50% of total
2 Nights
1 listings
1.6% of total
4-6 Nights
5 listings
7.8% of total
7-29 Nights
14 listings
21.9% of total
30+ Nights
12 listings
18.8% of total
Key Insights
- The most prevalent minimum stay requirement in Khet Phra Khanong is 1 Night, adopted by 50% of listings. This highlights the market's preference for shorter, flexible bookings.
- A significant segment (18.8%) caters to monthly stays (30+ nights) in Khet Phra Khanong, pointing to opportunities in the extended-stay market.
Recommendations
- Align with the market by considering a 1 Night minimum stay, as 50% of Khet Phra Khanong hosts use this setting.
- Explore offering discounts for stays of 30+ nights to attract the 18.8% of the market seeking extended stays.
- Adjust minimum nights based on seasonality – potentially shorter during low season and longer during peak demand periods in Khet Phra Khanong.
Khet Phra Khanong Airbnb Cancellation Policy Trends Analysis (2026)
Limited
1 listings
1.6% of total
Flexible
29 listings
45.3% of total
Moderate
13 listings
20.3% of total
Firm
13 listings
20.3% of total
Strict
8 listings
12.5% of total
Cancellation Policy Insights for Khet Phra Khanong
- The prevailing Airbnb cancellation policy trend in Khet Phra Khanong is Flexible, used by 45.3% of listings.
- There's a relatively balanced mix between guest-friendly (65.6%) and stricter (32.8%) policies, offering choices for different guest needs.
Recommendations for Hosts
- Consider adopting a Flexible policy to align with the 45.3% market standard in Khet Phra Khanong.
- Using a Strict policy might deter some guests, as only 12.5% of listings use it. Evaluate if potential revenue protection outweighs possible lower booking rates.
- Regularly review your cancellation policy against competitors and market demand shifts in Khet Phra Khanong.
Khet Phra Khanong STR Booking Lead Time Analysis (2026)
Average Booking Lead Time by Month
Booking Lead Time Insights for Khet Phra Khanong
- The overall average booking lead time for vacation rentals in Khet Phra Khanong is 16 days.
- Guests book furthest in advance for stays during January (average 30 days), likely coinciding with peak travel demand or local events.
- The shortest booking windows occur for stays in April (average 0 days), indicating more last-minute travel plans during this time.
- Seasonally, Fall (22 days avg.) sees the longest lead times, while Spring (0 days avg.) has the shortest, reflecting typical travel planning cycles.
Recommendations for Hosts
- Use the overall average lead time (16 days) as a baseline for your pricing and availability strategy in Khet Phra Khanong.
- For January stays, consider implementing length-of-stay discounts or slightly higher rates for bookings made less than 30 days out to capitalize on advance planning.
- During April, focus on last-minute booking availability and promotions, as guests book with very short notice (0 days avg.).
- Target marketing efforts for the Fall season well in advance (at least 22 days) to capture early planners.
- Monitor your own booking lead times against these Khet Phra Khanong averages to identify opportunities for dynamic pricing adjustments.
Popular & Essential Airbnb Amenities in Khet Phra Khanong (2026)
Amenity Prevalence
Amenity Insights for Khet Phra Khanong
- Essential amenities in Khet Phra Khanong that guests expect include: Wifi, Air conditioning. Lacking these (any) could significantly impact bookings.
- Popular amenities like Hair dryer, TV, Washer are common but not universal. Offering these can provide a competitive edge.
Recommendations for Hosts
- Ensure your listing includes all essential amenities for Khet Phra Khanong: Wifi, Air conditioning.
- Consider adding popular differentiators like Hair dryer or TV to increase appeal.
- Highlight unique or less common amenities you offer (e.g., hot tub, dedicated workspace, EV charger) in your listing description and photos.
- Regularly check competitor amenities in Khet Phra Khanong to stay competitive.
Khet Phra Khanong Airbnb Guest Demographics & Profile Analysis (2026)
Guest Profile Summary for Khet Phra Khanong
- The typical guest profile for Airbnb in Khet Phra Khanong consists of predominantly international visitors (96%), with top international origins including Germany, typically belonging to the Post-2000s (Gen Z/Alpha) group (50%), primarily speaking English or Chinese.
- Domestic travelers account for 4.3% of guests.
- Key international markets include United States (20.4%) and Germany (8.8%).
- Top languages spoken are English (46.7%) followed by Chinese (7.9%).
- A significant demographic segment is the Post-2000s (Gen Z/Alpha) group, representing 50% of guests.
Recommendations for Hosts
- Focus marketing internationally, particularly towards travelers from Germany.
- Tailor amenities and listing descriptions to appeal to the dominant Post-2000s (Gen Z/Alpha) demographic (e.g., highlight fast WiFi, smart home features, local guides).
- Highlight unique local experiences or amenities relevant to the primary guest profile.
- Consider seasonal promotions aligned with peak travel times for key origin markets.
Nearby Short-Term Rental Market Comparison
How does the Khet Phra Khanong Airbnb market stack up against its neighbors? Compare key performance metrics like average monthly revenue, ADR, and occupancy rates in surrounding areas to understand the broader regional STR landscape.
| Market | Active Properties | Monthly Revenue | Daily Rate | Avg. Occupancy |
|---|---|---|---|---|
| Huai Yai | 36 | $1,984 | $287.17 | 32% |
| Nong Pla Lai | 13 | $1,685 | $240.23 | 31% |
| Ban Malai Thap Tai | 10 | $1,519 | $255.38 | 28% |
| Khet Bang Rak | 35 | $1,299 | $104.31 | 50% |
| Ban Nong Hiang | 56 | $1,169 | $216.74 | 37% |
| Ban Nong Bua | 34 | $1,162 | $179.93 | 28% |
| Bang Lamung | 16 | $1,089 | $242.13 | 25% |
| Pathum Wan | 27 | $1,083 | $106.21 | 48% |
| Khao Chi Chan | 71 | $1,028 | $216.66 | 27% |
| Suan Luang | 14 | $951 | $79.56 | 53% |