Rayong Airbnb Market Analysis 2026: Short Term Rental Data & Vacation Rental Statistics in Rayong Province, Thailand
Is Airbnb profitable in Rayong in 2026? Explore comprehensive Airbnb analytics for Rayong, Rayong Province, Thailand to uncover income potential. This 2026 STR market report for Rayong, based on AirROI data from February 2025 to January 2026, reveals key trends in the niche market of 42 active listings.
Whether you're considering an Airbnb investment in Rayong, optimizing your existing vacation rental, or exploring rental arbitrage opportunities, understanding the Rayong Airbnb data is crucial. Leveraging the low regulation environment is key to maximizing your short term rental income potential. Let's dive into the specifics.
Key Rayong Airbnb Performance Metrics Overview
Monthly Airbnb Revenue Variations & Income Potential in Rayong (2026)
Understanding the monthly revenue variations for Airbnb listings in Rayong is key to maximizing your short term rental income potential. Seasonality significantly impacts earnings. Our analysis, based on data from the past 12 months, shows that the peak revenue month for STRs in Rayong is typically May, while August often presents the lowest earnings, highlighting opportunities for strategic pricing adjustments during shoulder and low seasons. Explore the typical Airbnb income in Rayong across different performance tiers:
- Best-in-class properties (Top 10%) achieve $1,806+ monthly, often utilizing dynamic pricing and superior guest experiences.
- Strong performing properties (Top 25%) earn $739 or more, indicating effective management and desirable locations/amenities.
- Typical properties (Median) generate around $367 per month, representing the average market performance.
- Entry-level properties (Bottom 25%) see earnings around $177, often with potential for optimization.
Average Monthly Airbnb Earnings Trend in Rayong
Rayong Airbnb Occupancy Rate Trends (2026)
Maximize your bookings by understanding the Rayong STR occupancy trends. Seasonal demand shifts significantly influence how often properties are booked. Typically, Novembersees the highest demand (peak season occupancy), while August experiences the lowest (low season). Effective strategies, like adjusting minimum stays or offering promotions, can boost occupancy during slower periods. Here's how different property tiers perform in Rayong:
- Best-in-class properties (Top 10%) achieve 58%+ occupancy, indicating high desirability and potentially optimized availability.
- Strong performing properties (Top 25%) maintain 39% or higher occupancy, suggesting good market fit and guest satisfaction.
- Typical properties (Median) have an occupancy rate around 19%.
- Entry-level properties (Bottom 25%) average 11% occupancy, potentially facing higher vacancy.
Average Monthly Occupancy Rate Trend in Rayong
Average Daily Rate (ADR) Airbnb Trends in Rayong (2026)
Effective short term rental pricing strategy in Rayong involves understanding monthly ADR fluctuations. The Average Daily Rate (ADR) for Airbnb in Rayong typically peaks in September and dips lowest during March. Leveraging Airbnb dynamic pricing tools or strategies based on this seasonality can significantly boost revenue. Here's a look at the typical nightly rates achieved:
- Best-in-class properties (Top 10%) command rates of $203+ per night, often due to premium features or locations.
- Strong performing properties (Top 25%) achieve nightly rates of $138 or more.
- Typical properties (Median) charge around $40 per night.
- Entry-level properties (Bottom 25%) earn around $26 per night.
Average Daily Rate (ADR) Trend by Month in Rayong
Get Live Rayong Market Intelligence 👇

Explore Real-time Analytics
Airbnb Seasonality Analysis & Trends in Rayong (2026)
Peak Season (May, March, February)
- Revenue averages $776 per month
- Occupancy rates average 33.8%
- Daily rates average $80
Shoulder Season
- Revenue averages $643 per month
- Occupancy maintains around 28.6%
- Daily rates hold near $84
Low Season (January, August, September)
- Revenue drops to average $411 per month
- Occupancy decreases to average 19.9%
- Daily rates adjust to average $86
Seasonality Insights for Rayong
- The Airbnb seasonality in Rayong shows moderate seasonality with distinct peak and low periods. While the sections above show seasonal averages, it's also insightful to look at the extremes:
- During the high season, the absolute peak month showcases Rayong's highest earning potential, with monthly revenues capable of climbing to $828, occupancy reaching a high of 39.8%, and ADRs peaking at $87.
- Conversely, the slowest single month of the year, typically falling within the low season, marks the market's lowest point. In this month, revenue might dip to $396, occupancy could drop to 15.9%, and ADRs may adjust down to $79.
- Understanding both the seasonal averages and these monthly peaks and troughs in revenue, occupancy, and ADR is crucial for maximizing your Airbnb profit potential in Rayong.
Seasonal Strategies for Maximizing Profit
- Peak Season: Maximize revenue through premium pricing and potentially longer minimum stays. Ensure high availability.
- Low Season: Offer competitive pricing, special promotions (e.g., extended stay discounts), and flexible cancellation policies. Target off-season travelers like remote workers or budget-conscious guests.
- Shoulder Seasons: Implement dynamic pricing that balances peak and low rates. Target weekend travelers or specific events. Offer slightly more flexible terms than peak season.
- Regularly analyze your own performance against these Rayong seasonality benchmarks and adjust your pricing and availability strategy accordingly.
Best Areas for Airbnb Investment in Rayong (2026)
Exploring the top neighborhoods for short-term rentals in Rayong? This section highlights key areas, outlining why they are attractive for hosts and guests, along with notable local attractions. Consider these locations based on your target guest profile and investment strategy.
| Neighborhood / Area | Why Host Here? (Target Guests & Appeal) | Key Attractions & Landmarks |
|---|---|---|
| Dongtan Beach | A popular beach area known for its beautiful scenery and water activities. Ideal for tourists looking to relax on the beach and enjoy local dining. | Dongtan Beach, Water sports activities, Beachfront restaurants, Night market |
| Pattaya Beach | Though technically in Pattaya, this location is a short drive from Rayong and attracts visitors for its lively beach scene and nightlife. | Walking Street, Pattaya Floating Market, Sanctuary of Truth, Pattaya Beach |
| Ban Phe | The gateway to Koh Samet and a charming town with a local vibe. Great for travelers seeking a more authentic experience before heading to the islands. | Ban Phe Pier, Fishing villages, Koh Samet ferry services, Local seafood restaurants |
| Rayong Beach | A quieter beach option for families and tourists looking for less crowded beaches compared to Pattaya, with a more relaxed atmosphere. | Rayong Beach, Local seafood restaurants, Beachfront resorts, Water sports |
| Koh Samet | A nearby island famous for its stunning beaches and vibrant nightlife. Optimal for short-term vacation rentals due to consistent tourist flow. | Ao Prao Beach, Sai Kaew Beach, Koh Samet National Park, Water activities |
| Suan Son Beach | Known for its serene environment and pine trees lining the beach, it's a popular spot for families and day-trippers. | Suan Son Beach, Picnic areas, Local food stalls, Calm waters |
| Nang Yai Beach | A peaceful beach destination with clear waters, perfect for relaxing and enjoying nature. Attractive for eco-tourism. | Nang Yai Beach, Scenic viewpoints, Local wildlife, Kayaking |
| Khao Laem Ya – Mu Ko Samet National Park | Ideal for nature lovers and eco-tourists, this park offers stunning landscapes and biodiversity, attracting tourists all year round. | Hiking trails, Diverse wildlife, Scenic views, Beach access |
Understanding Airbnb License Requirements & STR Laws in Rayong (2026)
While Rayong, Rayong Province, Thailand currently shows low STR regulations, specific Airbnb license requirements might still exist or change. Always verify the latest short term rental regulations and Airbnb license requirements directly with local government authorities for Rayong to ensure full compliance before hosting.
(Source: AirROI data, 2026, finding no licensed listings among those analyzed)
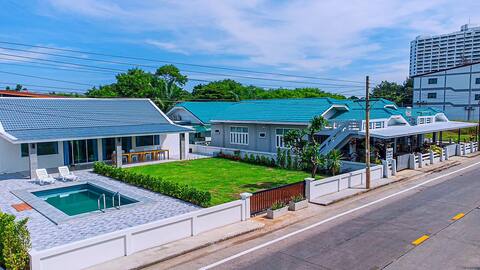
Top Performing Airbnb Properties in Rayong (2026)
Benchmark your potential! Explore examples of top-performing Airbnb properties in Rayongbased on Trailing Twelve Month (TTM) revenue. Analyze their characteristics, revenue, occupancy rate, and ADR to understand what drives success in this market.

ChomDao Banrublom pool villa house, rayong beach
Entire Place • 3 bedrooms

ChomTawan Banrublom pool villa house, rayong beach
Entire Place • 3 bedrooms
Sealife Beach Pool Villa
Entire Place • 5 bedrooms

The White house seangchan Beach
Entire Place • 4 bedrooms

The Beach Suite 64 Sqm, Ocean View, 11th Floor
Entire Place • 1 bedroom

Rayong Beach House
Entire Place • 4 bedrooms
Note: Performance varies based on location, size, amenities, seasonality, and management quality. Data reflects the past 12 months.
Top Performing Airbnb Hosts in Rayong (2026)
Learn from the best! This table showcases top-performing Airbnb hosts in Rayong based on the number of properties managed and estimated total revenue over the past year. Analyze their scale and performance metrics.
| Host Name | Properties | Grossing Revenue | Stay Reviews | Avg Rating |
|---|---|---|---|---|
| Parinda | 3 | $49,234 | 44 | 4.80/5.0 |
| Fonthip | 5 | $30,112 | 68 | 4.51/5.0 |
| Kannaphat | 8 | $18,133 | 186 | 4.95/5.0 |
| Wanreeya | 1 | $10,517 | 2 | Not Rated |
| Ning | 1 | $6,447 | 27 | 4.67/5.0 |
| Patama | 1 | $5,748 | 22 | 4.86/5.0 |
| Martin And Nee | 2 | $4,268 | 17 | 4.96/5.0 |
| Paopao | 1 | $4,171 | 2 | Not Rated |
| The Cozy | 1 | $3,902 | 28 | 4.96/5.0 |
| Warawut | 1 | $3,041 | 8 | 5.00/5.0 |
Analyzing the strategies of top hosts, such as their property selection, pricing, and guest communication, can offer valuable lessons for optimizing your own Airbnb operations in Rayong.
Dive Deeper: Advanced Rayong STR Market Data (2026)
Ready to unlock more insights? AirROI provides access to advanced metrics and comprehensive Airbnb data for Rayong. Explore detailed analytics beyond this report to refine your investment strategy, optimize pricing, and maximize your vacation rental profits.
Explore Advanced MetricsRayong Short-Term Rental Market Composition (2026): Property & Room Types
Room Type Distribution
Property Type Distribution
Market Composition Insights for Rayong
- The Rayong Airbnb market composition is heavily skewed towards Entire Home/Apt listings, which make up 69% of the 42 active rentals. This indicates strong guest preference for privacy and space.
- However, a notable 31% share for Private Rooms suggests opportunities for budget-conscious travelers or hosts renting out spare rooms.
- Looking at the property type distribution in Rayong, Apartment/Condo properties are the most common (57.1%), reflecting the local real estate landscape.
- Houses represent a significant 40.5% portion, catering likely to families or larger groups.
- Smaller segments like hotel/boutique (combined 2.4%) offer potential for unique stay experiences.
Rayong Airbnb Room Capacity Analysis (2026): Bedroom Distribution
Distribution of Listings by Number of Bedrooms
Room Capacity Insights for Rayong
- The dominant room capacity in Rayong is 1 bedroom listings, making up 54.8% of the market. This suggests a strong demand for properties suitable for couples or solo travelers.
- Together, 1 bedroom and 3 bedrooms properties represent 71.5% of the active Airbnb listings in Rayong, indicating a high concentration in these sizes.
- With over half the market (54.8%) consisting of studios or 1-bedroom units, Rayong is particularly well-suited for individuals or couples.
- A significant 23.9% of listings offer 3+ bedrooms, catering to larger groups and families seeking more space in Rayong.
Rayong Vacation Rental Guest Capacity Trends (2026)
Distribution of Listings by Guest Capacity
Guest Capacity Insights for Rayong
- The most common guest capacity trend in Rayong vacation rentals is listings accommodating 2 guests (35.7%). This suggests the primary traveler segment is likely couples or solo travelers.
- Properties designed for 2 guests and 8+ guests dominate the Rayong STR market, accounting for 59.5% of listings.
- 30.9% of properties accommodate 6+ guests, serving the market segment for larger families or group travel in Rayong.
- On average, properties in Rayong are equipped to host 3.8 guests.
Rayong Airbnb Booking Patterns (2026): Available vs. Booked Days
Available Days Distribution
Booked Days Distribution
Booking Pattern Insights for Rayong
- The most common availability pattern in Rayong falls within the 271-366 days range, representing 78.6% of listings. This suggests many properties have significant open periods on their calendars.
- Approximately 92.9% of listings show high availability (181+ days open annually), indicating potential for increased bookings or specific owner usage patterns.
- For booked days, the 1-30 days range is most frequent in Rayong (47.6%), reflecting common guest stay durations or potential owner blocking patterns.
- A notable 7.1% of properties secure long booking periods (181+ days booked per year), highlighting successful long-term rental strategies or significant owner usage.
Rayong Airbnb Minimum Stay Requirements Analysis
Distribution of Listings by Minimum Night Requirement
1 Night
22 listings
52.4% of total
2 Nights
8 listings
19% of total
3 Nights
1 listings
2.4% of total
4-6 Nights
1 listings
2.4% of total
7-29 Nights
7 listings
16.7% of total
30+ Nights
3 listings
7.1% of total
Key Insights
- The most prevalent minimum stay requirement in Rayong is 1 Night, adopted by 52.4% of listings. This highlights the market's preference for shorter, flexible bookings.
- A strong majority (71.4%) of the Rayong Airbnb data shows acceptance of very short stays (1-2 nights), indicating a dynamic, high-turnover market.
Recommendations
- Align with the market by considering a 1 Night minimum stay, as 52.4% of Rayong hosts use this setting.
- Explore offering discounts for stays of 30+ nights to attract the 7.1% of the market seeking extended stays.
- Adjust minimum nights based on seasonality – potentially shorter during low season and longer during peak demand periods in Rayong.
Rayong Airbnb Cancellation Policy Trends Analysis (2026)
Flexible
19 listings
45.2% of total
Moderate
11 listings
26.2% of total
Firm
6 listings
14.3% of total
Strict
6 listings
14.3% of total
Cancellation Policy Insights for Rayong
- The prevailing Airbnb cancellation policy trend in Rayong is Flexible, used by 45.2% of listings.
- The market strongly favors guest-friendly terms, with 71.4% of listings offering Flexible or Moderate policies. This suggests guests in Rayong may expect booking flexibility.
Recommendations for Hosts
- Consider adopting a Flexible policy to align with the 45.2% market standard in Rayong.
- Using a Strict policy might deter some guests, as only 14.3% of listings use it. Evaluate if potential revenue protection outweighs possible lower booking rates.
- Regularly review your cancellation policy against competitors and market demand shifts in Rayong.
Rayong STR Booking Lead Time Analysis (2026)
Average Booking Lead Time by Month
Booking Lead Time Insights for Rayong
- The overall average booking lead time for vacation rentals in Rayong is 27 days.
- Guests book furthest in advance for stays during December (average 66 days), likely coinciding with peak travel demand or local events.
- The shortest booking windows occur for stays in June (average 12 days), indicating more last-minute travel plans during this time.
- Seasonally, Winter (42 days avg.) sees the longest lead times, while Summer (21 days avg.) has the shortest, reflecting typical travel planning cycles.
Recommendations for Hosts
- Use the overall average lead time (27 days) as a baseline for your pricing and availability strategy in Rayong.
- For December stays, consider implementing length-of-stay discounts or slightly higher rates for bookings made less than 66 days out to capitalize on advance planning.
- During June, focus on last-minute booking availability and promotions, as guests book with very short notice (12 days avg.).
- Target marketing efforts for the Winter season well in advance (at least 42 days) to capture early planners.
- Monitor your own booking lead times against these Rayong averages to identify opportunities for dynamic pricing adjustments.
Popular & Essential Airbnb Amenities in Rayong (2026)
Amenity Prevalence
Amenity Insights for Rayong
- Essential amenities in Rayong that guests expect include: Free parking on premises, Wifi, Air conditioning. Lacking these (any) could significantly impact bookings.
- Popular amenities like Refrigerator, TV, Essentials are common but not universal. Offering these can provide a competitive edge.
Recommendations for Hosts
- Ensure your listing includes all essential amenities for Rayong: Free parking on premises, Wifi, Air conditioning.
- Prioritize adding missing essentials: Wifi, Air conditioning.
- Consider adding popular differentiators like Refrigerator or TV to increase appeal.
- Highlight unique or less common amenities you offer (e.g., hot tub, dedicated workspace, EV charger) in your listing description and photos.
- Regularly check competitor amenities in Rayong to stay competitive.
Rayong Airbnb Guest Demographics & Profile Analysis (2026)
Guest Profile Summary for Rayong
- The typical guest profile for Airbnb in Rayong consists of predominantly international visitors (90%), with top international origins including United Kingdom, typically belonging to the Post-2000s (Gen Z/Alpha) group (50%), primarily speaking English or German.
- Domestic travelers account for 10.5% of guests.
- Key international markets include United States (12.3%) and United Kingdom (10.5%).
- Top languages spoken are English (41.8%) followed by German (8.8%).
- A significant demographic segment is the Post-2000s (Gen Z/Alpha) group, representing 50% of guests.
Recommendations for Hosts
- Focus marketing internationally, particularly towards travelers from United Kingdom.
- Tailor amenities and listing descriptions to appeal to the dominant Post-2000s (Gen Z/Alpha) demographic (e.g., highlight fast WiFi, smart home features, local guides).
- Highlight unique local experiences or amenities relevant to the primary guest profile.
- Consider seasonal promotions aligned with peak travel times for key origin markets.
Nearby Short-Term Rental Market Comparison
How does the Rayong Airbnb market stack up against its neighbors? Compare key performance metrics like average monthly revenue, ADR, and occupancy rates in surrounding areas to understand the broader regional STR landscape.
| Market | Active Properties | Monthly Revenue | Daily Rate | Avg. Occupancy |
|---|---|---|---|---|
| Huai Yai | 36 | $1,984 | $287.17 | 32% |
| Nong Pla Lai | 13 | $1,685 | $240.23 | 31% |
| Baan Klong Son | 124 | $1,322 | $205.65 | 34% |
| Khet Bang Rak | 35 | $1,299 | $104.31 | 50% |
| Haad Khlong Chao | 14 | $1,164 | $136.34 | 31% |
| Bang Lamung | 16 | $1,089 | $242.13 | 25% |
| Pathum Wan | 27 | $1,083 | $106.21 | 48% |
| Khao Chi Chan | 71 | $1,028 | $216.66 | 27% |
| Suan Luang | 14 | $951 | $79.56 | 53% |
| Na Chom Thian | 204 | $934 | $182.57 | 32% |