บ้านบางรักษ์ Airbnb Market Analysis 2026: Short Term Rental Data & Vacation Rental Statistics in Surat Thani Province, Thailand
Is Airbnb profitable in บ้านบางรักษ์ in 2026? Explore comprehensive Airbnb analytics for บ้านบางรักษ์, Surat Thani Province, Thailand to uncover income potential. This 2026 STR market report for บ้านบางรักษ์, based on AirROI data from February 2025 to January 2026, reveals key trends in the niche market of 57 active listings.
Whether you're considering an Airbnb investment in บ้านบางรักษ์, optimizing your existing vacation rental, or exploring rental arbitrage opportunities, understanding the บ้านบางรักษ์ Airbnb data is crucial. Leveraging the low regulation environment is key to maximizing your short term rental income potential. Let's dive into the specifics.
Key บ้านบางรักษ์ Airbnb Performance Metrics Overview
Monthly Airbnb Revenue Variations & Income Potential in บ้านบางรักษ์ (2026)
Understanding the monthly revenue variations for Airbnb listings in บ้านบางรักษ์ is key to maximizing your short term rental income potential. Seasonality significantly impacts earnings. Our analysis, based on data from the past 12 months, shows that the peak revenue month for STRs in บ้านบางรักษ์ is typically February, while October often presents the lowest earnings, highlighting opportunities for strategic pricing adjustments during shoulder and low seasons. Explore the typical Airbnb income in บ้านบางรักษ์ across different performance tiers:
- Best-in-class properties (Top 10%) achieve $5,782+ monthly, often utilizing dynamic pricing and superior guest experiences.
- Strong performing properties (Top 25%) earn $3,499 or more, indicating effective management and desirable locations/amenities.
- Typical properties (Median) generate around $1,072 per month, representing the average market performance.
- Entry-level properties (Bottom 25%) see earnings around $437, often with potential for optimization.
Average Monthly Airbnb Earnings Trend in บ้านบางรักษ์
บ้านบางรักษ์ Airbnb Occupancy Rate Trends (2026)
Maximize your bookings by understanding the บ้านบางรักษ์ STR occupancy trends. Seasonal demand shifts significantly influence how often properties are booked. Typically, Februarysees the highest demand (peak season occupancy), while January experiences the lowest (low season). Effective strategies, like adjusting minimum stays or offering promotions, can boost occupancy during slower periods. Here's how different property tiers perform in บ้านบางรักษ์:
- Best-in-class properties (Top 10%) achieve 76%+ occupancy, indicating high desirability and potentially optimized availability.
- Strong performing properties (Top 25%) maintain 56% or higher occupancy, suggesting good market fit and guest satisfaction.
- Typical properties (Median) have an occupancy rate around 34%.
- Entry-level properties (Bottom 25%) average 18% occupancy, potentially facing higher vacancy.
Average Monthly Occupancy Rate Trend in บ้านบางรักษ์
Average Daily Rate (ADR) Airbnb Trends in บ้านบางรักษ์ (2026)
Effective short term rental pricing strategy in บ้านบางรัก�ษ์ involves understanding monthly ADR fluctuations. The Average Daily Rate (ADR) for Airbnb in บ้านบางรักษ์ typically peaks in January and dips lowest during October. Leveraging Airbnb dynamic pricing tools or strategies based on this seasonality can significantly boost revenue. Here's a look at the typical nightly rates achieved:
- Best-in-class properties (Top 10%) command rates of $284+ per night, often due to premium features or locations.
- Strong performing properties (Top 25%) achieve nightly rates of $198 or more.
- Typical properties (Median) charge around $85 per night.
- Entry-level properties (Bottom 25%) earn around $59 per night.
Average Daily Rate (ADR) Trend by Month in บ้านบางรักษ์
Get Live บ้านบางรักษ์ Market Intelligence 👇

Explore Real-time Analytics
Airbnb Seasonality Analysis & Trends in บ้านบางรักษ์ (2026)
Peak Season (February, August, July)
- Revenue averages $3,064 per month
- Occupancy rates average 51.0%
- Daily rates average $156
Shoulder Season
- Revenue averages $2,125 per month
- Occupancy maintains around 38.3%
- Daily rates hold near $142
Low Season (January, October, November)
- Revenue drops to average $1,343 per month
- Occupancy decreases to average 27.9%
- Daily rates adjust to average $143
Seasonality Insights for บ้านบางรักษ์
- The Airbnb seasonality in บ้านบางรักษ์ shows highly seasonal trends requiring careful strategy. While the sections above show seasonal averages, it's also insightful to look at the extremes:
- During the high season, the absolute peak month showcases บ้านบางรักษ์'s highest earning potential, with monthly revenues capable of climbing to $3,514, occupancy reaching a high of 71.0%, and ADRs peaking at $171.
- Conversely, the slowest single month of the year, typically falling within the low season, marks the market's lowest point. In this month, revenue might dip to $1,183, occupancy could drop to 22.9%, and ADRs may adjust down to $128.
- Understanding both the seasonal averages and these monthly peaks and troughs in revenue, occupancy, and ADR is crucial for maximizing your Airbnb profit potential in บ้านบางรักษ์.
Seasonal Strategies for Maximizing Profit
- Peak Season: Maximize revenue through premium pricing and potentially longer minimum stays. Ensure high availability.
- Low Season: Offer competitive pricing, special promotions (e.g., extended stay discounts), and flexible cancellation policies. Target off-season travelers like remote workers or budget-conscious guests.
- Shoulder Seasons: Implement dynamic pricing that balances peak and low rates. Target weekend travelers or specific events. Offer slightly more flexible terms than peak season.
- Regularly analyze your own performance against these บ้านบางรักษ์ seasonality benchmarks and adjust your pricing and availability strategy accordingly.
Best Areas for Airbnb Investment in บ้านบางรักษ์ (2026)
Exploring the top neighborhoods for short-term rentals in บ้านบางรักษ์? This section highlights key areas, outlining why they are attractive for hosts and guests, along with notable local attractions. Consider these locations based on your target guest profile and investment strategy.
| Neighborhood / Area | Why Host Here? (Target Guests & Appeal) | Key Attractions & Landmarks |
|---|---|---|
| Koh Samui | A popular tourist destination known for its beautiful beaches, luxury resorts, and vibrant nightlife. Ideal for attracting holidaymakers looking for relaxation and adventure. | Chaweng Beach, Lamai Beach, Big Buddha, Ang Thong National Marine Park, Fishermans Village, Samui Elephant Sanctuary |
| Koh Phangan | Famous for its Full Moon Party, this island attracts young backpackers and party-goers as well as those seeking more tranquil beach experiences. | Haad Rin Beach, Thongsala Night Market, Bottle Beach, Phaeng Waterfall, Koh Ma, Than Sadet National Park |
| Surat Thani City | The capital of the province, it serves as a gateway to many islands and natural attractions. Suitable for travelers looking for convenient access to transport and local culture. | Surat Thani Night Market, Na Muang Temple, Surat Thani City Pillar Shrine, Rim Nam Hotel Pier, Phunphin Waterfall |
| Koh Tao | A picturesque island renowned for snorkeling and diving. It attracts eco-tourists and adventure seekers looking to explore marine life. | Shark Bay, Sairee Beach, Chalok Baan Kao Beach, Ao Leuk Bay, Koh Nang Yuan |
| Donsak | Less touristy yet offers access to beautiful beaches and natural parks. Great for visitors who prefer a more authentic experience away from the crowds. | Donsak Pier, Koh Tai Kha Island, Koh Samui viewpoints, Koh Ang Thong, Namuang Waterfalls |
| Koh Nang Yuan | A small island famous for its stunning beaches and snorkeling spots. Ideal for peaceful retreats and romantic getaways. | Viewpoint, Snorkeling spots, Coral reef, Small beach areas, Kayaking opportunities |
| Koh Madsum | Also known as Pig Island, known for its natural beauty and clear waters. It draws tourists looking for a quiet day trip and beach relaxation. | Pig beach, Snorkeling spots, Clear water lagoons, Sunbathing areas, Local food stalls |
| Koh Yao Noi | Less commercialized than nearby islands, it offers a beautiful, tranquil escape with stunning landscape. Preferred by those seeking relaxation and wellness. | Coconut groves, Pristine beaches, Yoga retreats, Local fishing villages, Scenic viewpoints |
Understanding Airbnb License Requirements & STR Laws in บ้านบางรักษ์ (2026)
While บ้านบางรักษ์, Surat Thani Province, Thailand currently shows low STR regulations, specific Airbnb license requirements might still exist or change. Always verify the latest short term rental regulations and Airbnb license requirements directly with local government authorities for บ้านบางรักษ์ to ensure full compliance before hosting.
(Source: AirROI data, 2026, finding no licensed listings among those analyzed)
Top Performing Airbnb Properties in บ้านบางรักษ์ (2026)
Benchmark your potential! Explore examples of top-performing Airbnb properties in บ้านบางรักษ์based on Trailing Twelve Month (TTM) revenue. Analyze their characteristics, revenue, occupancy rate, and ADR to understand what drives success in this market.
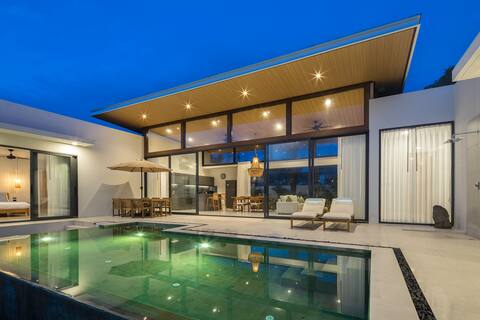
New 4 Bedroom Pool Villa Sunniva
Entire Place • 4 bedrooms
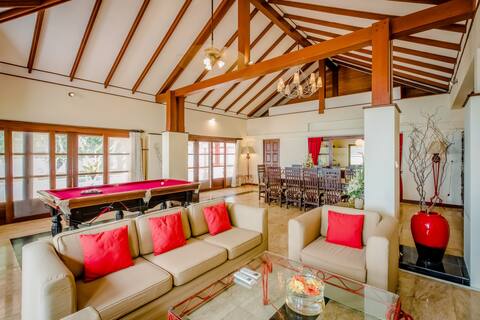
Grand Thai Modern Pool Vila for Family 5BR+Abf
Entire Place • 5 bedrooms

Brand New 7Bedroom Pool Villa Sandy
Entire Place • 7 bedrooms

Stylish 3BDR Villa Lun Than, Bo Put
Entire Place • 3 bedrooms
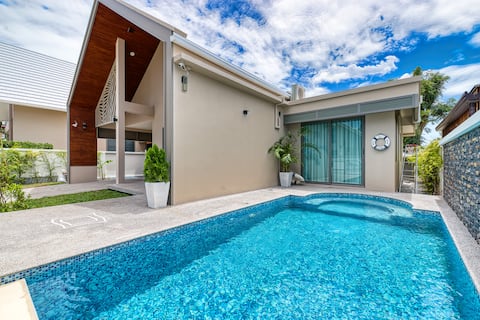
Villa Aurora - luxury hideaway in Bangrak
Entire Place • 3 bedrooms

Jasmine Pool Villa Bophut
Entire Place • 3 bedrooms
Note: Performance varies based on location, size, amenities, seasonality, and management quality. Data reflects the past 12 months.
Top Performing Airbnb Hosts in บ้านบางรักษ์ (2026)
Learn from the best! This table showcases top-performing Airbnb hosts in บ้านบางรักษ์ based on the number of properties managed and estimated total revenue over the past year. Analyze their scale and performance metrics.
| Host Name | Properties | Grossing Revenue | Stay Reviews | Avg Rating |
|---|---|---|---|---|
| Arphitsaya | 1 | $76,702 | 24 | 4.88/5.0 |
| The Privilege Hotel Ezra Beach | 1 | $74,567 | 7 | 4.71/5.0 |
| Daria | 2 | $72,480 | 28 | 4.88/5.0 |
| Rattana | 1 | $67,160 | 25 | 4.92/5.0 |
| Olga | 1 | $63,538 | 22 | 4.95/5.0 |
| Matthew | 1 | $56,802 | 21 | 4.90/5.0 |
| Villa Tropicale Nature Et Lac | 2 | $50,464 | 7 | 5.00/5.0 |
| Chaoh'S Villa | 2 | $43,814 | 29 | 4.84/5.0 |
| Lilly | 1 | $43,249 | 4 | 5.00/5.0 |
| Mary Stone Real Estate | 2 | $39,049 | 16 | 4.96/5.0 |
Analyzing the strategies of top hosts, such as their property selection, pricing, and guest communication, can offer valuable lessons for optimizing your own Airbnb operations in บ้านบางรักษ์.
Dive Deeper: Advanced บ้านบางรักษ์ STR Market Data (2026)
Ready to unlock more insights? AirROI provides access to advanced metrics and comprehensive Airbnb data for บ้านบางรักษ์. Explore detailed analytics beyond this report to refine your investment strategy, optimize pricing, and maximize your vacation rental profits.
Explore Advanced Metricsบ้านบางรักษ์ Short-Term Rental Market Composition (2026): Property & Room Types
Room Type Distribution
Property Type Distribution
Market Composition Insights for บ้านบางรักษ์
- The บ้านบางรักษ์ Airbnb market composition is heavily skewed towards Entire Home/Apt listings, which make up 50.9% of the 57 active rentals. This indicates strong guest preference for privacy and space.
- However, a notable 49.1% share for Private Rooms suggests opportunities for budget-conscious travelers or hosts renting out spare rooms.
- Looking at the property type distribution in บ้านบางรักษ์, House properties are the most common (38.6%), reflecting the local real estate landscape.
- Houses represent a significant 38.6% portion, catering likely to families or larger groups.
- The presence of 36.8% Hotel/Boutique listings indicates integration with traditional hospitality.
บ้านบางรักษ์ Airbnb Room Capacity Analysis (2026): Bedroom Distribution
Distribution of Listings by Number of Bedrooms
Room Capacity Insights for บ้านบางรักษ์
- The dominant room capacity in บ้านบางรักษ์ is 1 bedroom listings, making up 36.8% of the market. This suggests a strong demand for properties suitable for couples or solo travelers.
- Together, 1 bedroom and 3 bedrooms properties represent 56.1% of the active Airbnb listings in บ้านบางรักษ์, indicating a high concentration in these sizes.
- A significant 28.1% of listings offer 3+ bedrooms, catering to larger groups and families seeking more space in บ้านบางรักษ์.
บ้านบางรักษ์ Vacation Rental Guest Capacity Trends (2026)
Distribution of Listings by Guest Capacity
Guest Capacity Insights for บ้านบางรักษ์
- The most common guest capacity trend in บ้านบางรักษ์ vacation rentals is listings accommodating 2 guests (35.1%). This suggests the primary traveler segment is likely couples or solo travelers.
- Properties designed for 2 guests and 6 guests dominate the บ้านบางรักษ์ STR market, accounting for 52.6% of listings.
- 26.3% of properties accommodate 6+ guests, serving the market segment for larger families or group travel in บ้านบางรักษ์.
- On average, properties in บ้านบางรักษ์ are equipped to host 3.1 guests.
บ้านบางรักษ์ Airbnb Booking Patterns (2026): Available vs. Booked Days
Available Days Distribution
Booked Days Distribution
Booking Pattern Insights for บ้านบางรักษ์
- The most common availability pattern in บ้านบางรักษ์ falls within the 271-366 days range, representing 68.4% of listings. This suggests many properties have significant open periods on their calendars.
- Approximately 87.7% of listings show high availability (181+ days open annually), indicating potential for increased bookings or specific owner usage patterns.
- For booked days, the 31-90 days range is most frequent in บ้านบางรักษ์ (40.4%), reflecting common guest stay durations or potential owner blocking patterns.
- A notable 14.1% of properties secure long booking periods (181+ days booked per year), highlighting successful long-term rental strategies or significant owner usage.
บ้านบางรักษ์ Airbnb Minimum Stay Requirements Analysis
Distribution of Listings by Minimum Night Requirement
1 Night
28 listings
49.1% of total
2 Nights
3 listings
5.3% of total
3 Nights
8 listings
14% of total
4-6 Nights
3 listings
5.3% of total
7-29 Nights
1 listings
1.8% of total
30+ Nights
14 listings
24.6% of total
Key Insights
- The most prevalent minimum stay requirement in บ้านบางรักษ์ is 1 Night, adopted by 49.1% of listings. This highlights the market's preference for shorter, flexible bookings.
- A significant segment (24.6%) caters to monthly stays (30+ nights) in บ้านบางรักษ์, pointing to opportunities in the extended-stay market.
Recommendations
- Align with the market by considering a 1 Night minimum stay, as 49.1% of บ้านบางรักษ์ hosts use this setting.
- Explore offering discounts for stays of 30+ nights to attract the 24.6% of the market seeking extended stays.
- Adjust minimum nights based on seasonality – potentially shorter during low season and longer during peak demand periods in บ้านบางรักษ์.
บ้านบางรักษ์ Airbnb Cancellation Policy Trends Analysis (2026)
Flexible
12 listings
21.1% of total
Moderate
5 listings
8.8% of total
Firm
27 listings
47.4% of total
Strict
13 listings
22.8% of total
Cancellation Policy Insights for บ้านบางรักษ์
- The prevailing Airbnb cancellation policy trend in บ้านบางรักษ์ is Firm, used by 47.4% of listings.
- A majority (70.2%) of hosts in บ้านบางรักษ์ utilize Firm or Strict policies, indicating a market where hosts prioritize booking security.
Recommendations for Hosts
- Consider adopting a Firm policy to align with the 47.4% market standard in บ้านบางรักษ์.
- Regularly review your cancellation policy against competitors and market demand shifts in บ้านบางรักษ์.
บ้านบางรักษ์ STR Booking Lead Time Analysis (2026)
Average Booking Lead Time by Month
Booking Lead Time Insights for บ้านบางรักษ์
- The overall average booking lead time for vacation rentals in บ้านบางรักษ์ is 33 days.
- Guests book furthest in advance for stays during January (average 91 days), likely coinciding with peak travel demand or local events.
- The shortest booking windows occur for stays in February (average 19 days), indicating more last-minute travel plans during this time.
- Seasonally, Winter (62 days avg.) sees the longest lead times, while Spring (28 days avg.) has the shortest, reflecting typical travel planning cycles.
Recommendations for Hosts
- Use the overall average lead time (33 days) as a baseline for your pricing and availability strategy in บ้านบางรักษ์.
- For January stays, consider implementing length-of-stay discounts or slightly higher rates for bookings made less than 91 days out to capitalize on advance planning.
- Target marketing efforts for the Winter season well in advance (at least 62 days) to capture early planners.
- Monitor your own booking lead times against these บ้านบางรักษ์ averages to identify opportunities for dynamic pricing adjustments.
Popular & Essential Airbnb Amenities in บ้านบางรักษ์ (2026)
Amenity Prevalence
Amenity Insights for บ้านบางรักษ์
- Essential amenities in บ้านบางรักษ์ that guests expect include: Air conditioning, Wifi, Free parking on premises. Lacking these (any) could significantly impact bookings.
- Popular amenities like Pool, TV, Hair dryer are common but not universal. Offering these can provide a competitive edge.
- A pool is a highly desired but not standard amenity, making it a key feature for attracting guests seeking leisure in บ้านบางรักษ์.
Recommendations for Hosts
- Ensure your listing includes all essential amenities for บ้านบางรักษ์: Air conditioning, Wifi, Free parking on premises.
- Prioritize adding missing essentials: Free parking on premises.
- Consider adding popular differentiators like Pool or TV to increase appeal.
- Highlight unique or less common amenities you offer (e.g., hot tub, dedicated workspace, EV charger) in your listing description and photos.
- Regularly check competitor amenities in บ้านบางรักษ์ to stay competitive.
บ้านบางรักษ์ Airbnb Guest Demographics & Profile Analysis (2026)
Guest Profile Summary for บ้านบางรักษ์
- The typical guest profile for Airbnb in บ้านบางรักษ์ consists of predominantly international visitors (98%), with top international origins including United Kingdom, typically belonging to the Post-2000s (Gen Z/Alpha) group (50%), primarily speaking English or French.
- Domestic travelers account for 2.4% of guests.
- Key international markets include France (16.9%) and United Kingdom (14.5%).
- Top languages spoken are English (45.1%) followed by French (12%).
- A significant demographic segment is the Post-2000s (Gen Z/Alpha) group, representing 50% of guests.
Recommendations for Hosts
- Focus marketing internationally, particularly towards travelers from United Kingdom.
- Tailor amenities and listing descriptions to appeal to the dominant Post-2000s (Gen Z/Alpha) demographic (e.g., highlight fast WiFi, smart home features, local guides).
- Highlight unique local experiences or amenities relevant to the primary guest profile.
- Consider seasonal promotions aligned with peak travel times for key origin markets.
Nearby Short-Term Rental Market Comparison
How does the บ้านบางรักษ์ Airbnb market stack up against its neighbors? Compare key performance metrics like average monthly revenue, ADR, and occupancy rates in surrounding areas to understand the broader regional STR landscape.
| Market | Active Properties | Monthly Revenue | Daily Rate | Avg. Occupancy |
|---|---|---|---|---|
| Baan Thong Po | 135 | $3,724 | $378.37 | 45% |
| Baan Thong Krut | 30 | $3,723 | $633.64 | 39% |
| Baan Taling Ngam | 38 | $3,122 | $392.66 | 36% |
| Baan Chaweng Noi | 333 | $3,038 | $289.57 | 45% |
| Ko Samui | 904 | $2,890 | $332.21 | 43% |
| Tong Yang | 56 | $2,766 | $562.71 | 38% |
| Baan Pang Ka | 15 | $2,734 | $245.69 | 45% |
| Ban Bang Khao | 58 | $2,702 | $405.58 | 38% |
| Baan Hua Thanon | 96 | $2,490 | $255.74 | 48% |
| Choeng Mon | 206 | $2,421 | $376.58 | 38% |